rentrez: An R package for the NCBI eUtils
API
by David J. Winter
Abstract The USA National Center for Biotechnology Information (NCBI) is one of the world’s most important sources of biological information. NCBI databases like PubMed and GenBank contain
mil-lions of records describing bibliographic, genetic, genomic, and medical data. Here I presentrentrez,
a package which provides an R interface to 50 NCBI databases. The package is well-documented, contains an extensive suite of unit tests and has an active user base. The programmatic interface to the
NCBI provided byrentrezallows researchers to query databases and download or import particular
records into R sessions for subsequent analysis. The complete nature of the package, its extensive
test-suite and the fact the package implements the NCBI’s usage policies all makerentreza powerful
aid to developers of new packages that perform more specific tasks.
Introduction
The USA National Center for Biotechnology Information (NCBI) is one of the world’s largest and most important sources of biological data. At the time of writing, the NCBI PubMed database provided information on 27.5 million journal articles, including 4.6 million full text records. The NCBI Nucleotide Database (including GenBank) had data for 243.3 million different sequences and dbSNP described 997.3 million different genetic variants. Records from all of these databases can be cross-referenced with the 1.3 million species in the NCBI taxonomy, and PubMed entries can be searched using a controlled vocabulary containing 272 thousand unique terms.
The NCBI provides access to a total of 50 databases through a web interface, public FTP sites and
an API called Entrez Programming Utilities (eUtils,Sayers and Wheeler 2004). R packages from the
Bioconductor project (e.g.,genomes,Stubben 2015;RMassBank,Stravs et al. 2013andMeSHSim,
Zhou and Shui 2015) or available from CRAN (e.g.,ape,Paradis et al. 2004;RISmed, Kovalchik 2017andpubmed.mineR,Rani et al. 2014) take advantage of the Eutils API to perform specific tasks.
Two packages,rentrezandreutils(Schöfl,2016), provide functions that cover the entire API. Here I
describerentrez, a package which provides users with a simple and consistent interface to eUtils. This
paper discusses the design of the package, illustrates its use in biological research and demonstrates how the provided functions can aid the development of other packages designed to meet more specific goals.
The eUtils API and rentrez
The eUtils API provides endpoints for searching each of the databases it covers, finding cross-references among records in those databases and fetching particular records (in complete or summary form).
The design ofrentrez mirrors that of eUtils, with each of these endpoints represented by a core
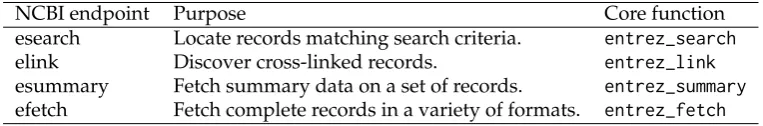
function that has arguments named to match those used in the API documentation (Table1). The most
[image:1.595.107.489.611.674.2]important arguments to each R function are documented, and the help pages associated with these functions contain a reference to the relevant section of the eUtils documentation.
Table 1:Core eUtils endpoints and theirrentrezcounterparts
NCBI endpoint Purpose Core function
esearch Locate records matching search criteria.
entrez_search
elink Discover cross-linked records.
entrez_link
esummary Fetch summary data on a set of records.
entrez_summary
efetch Fetch complete records in a variety of formats.entrez_fetch
Typically, a user will begin by usingentrez_searchto discover unique identifiers for database
records matching particular criteria. This function requires a database (argumentdb) and a search term
(argumentterm). Thetermargument can take advantage of the eUtils search syntax, in which queries
can be associated with particular ‘search fields’ (enclosed in square brackets), to limit the number of matching records. The fields available for a given database can be retrieved with the function
pubmed_search <- entrez_search(db="pubmed",
term="(R package[TITL]) AND 2017[PDAT]", use_history=TRUE)
pubmed_search
#> Entrez search result with 62 hits (object contains 20 IDs and a web_history object) #> Search term (as translated): R package[TITL] AND 2017[PDAT]
For the most part, the objects returned byrentrezfunctions are S3 objects that inherit from"list"
objects. Each of these classes has its ownprintmethod, providing users with a succint summary of
the object’s contents. In this case,entrez_searchreturns a an"esearch", object and the print method
describes the number of records matching the query. These objects also contain either a character
vector containing the unique identifiers of records that match the query or a"web_history"object that
serves as a reference to this set of identifiers stored on the NCBI’s servers. These"web_history"objects
are useful when dealing with large numbers of records, as they reduce the number of identifiers that
need to be exchanged between a user and NCBI servers. Both identifiers and"web_history"objects
can be passed to the other core functions to retrieve information about the records they represent.
For example, a call toentrez_summaryreturns information about each paper identified in the search
above.
pkg_paper_summs <- entrez_summary(db="pubmed", web_history=pubmed_search$web_history) pkg_paper_summs
#> List of 62 esummary records. First record: #>
#> $`28759592`
#> esummary result with 42 items:
#> [1] uid pubdate epubdate
#> [4] source authors lastauthor
#> [7] title sorttitle volume
#> [10] issue pages lang
#> [13] nlmuniqueid issn essn
#> [16] pubtype recordstatus pubstatus #> [19] articleids history references #> [22] attributes pmcrefcount fulljournalname #> [25] elocationid doctype srccontriblist
#> [28] booktitle medium edition
#> [31] publisherlocation publishername srcdate #> [34] reportnumber availablefromurl locationlabel #> [37] doccontriblist docdate bookname #> [40] chapter sortpubdate sortfirstauthor
In addition to matching each of the eUtils endpoints, rentrezprovides utility functions that
facilitate common workflows. For example, the functionextract_from_esummaryallows users to
extract some subset of the items contained in each of a set of summary records. In this case, the names of the journals that these papers appeared in can be retrieved. The resulting character vector can then be used to identify the PubMed-indexed journals that have published the most papers describing R packages this year.
journals <- extract_from_esummary(pkg_paper_summs, "fulljournalname") journals_by_R_pkgs <- sort(table(journals), decreasing = TRUE) head(journals_by_R_pkgs,3)
#> journals
#> Bioinformatics (Oxford, England) BMC bioinformatics
#> 16 9
#> Molecular ecology resources
#> 9
Demonstration: retrieving unique transcripts for a given gene
Records in the NCBI’s various databases are heavily cross-referenced, allowing users to identify and download data related to particular papers, organisms or genes. By providing a programmatic
download particular datasets for further analysis or load them into an R session. Here I demonstrate such a workflow, downloading DNA sequences corresponding to unique mRNA transcripts of a particular gene in a particular species.
Our aim is to retrieve the sequence of mRNA transcripts associated with the gene that encodes
Amyloid Beta Precursor Protein in humans. This gene is identified by the gene symbol1‘APP’. The
NCBI database dealing with genetic loci (rather than particular sequences) is called ‘Gene’, so the first step to recovering the sequence data is discovering the unique identifier associated with APP in this
database. This can be achieved withentrez_search, using the gene symbol and species in the search
term.
app_gene <- entrez_search(db="gene", term="(Homo sapiens[ORGN]) AND APP[GENE]") app_gene
#> Entrez search result with 1 hits (object contains 1 IDs and no web_history object) #> Search term (as translated): "Homo sapiens"[Organism] AND APP[GENE]
We now have a unique identifier for APP in the Gene database. In order to download sequences for this gene we need to find records from the NCBI Nucleotide database that are associated with the
Gene record. The functionentrez_linkcan be used to find cross-referenced records. In this case, a
single call toentrez_linkcan identify human APP sequences in the nucleotide database in general
and in a number of restrictive subsets of that database.
nuc_links <- entrez_link(dbfrom="gene", id=app_gene$ids, db="nuccore") nuc_links$links
#> elink result with information from 5 databases:
#> [1] gene_nuccore gene_nuccore_mgc gene_nuccore_pos #> [4] gene_nuccore_refseqgene gene_nuccore_refseqrna
The RefSeq RNA subset on the Nucleotide database contains a curated set of mRNA transcripts
for different genes. Thus the unique identifiers contained in thegene_nuccore_refseqrnaelement
correspond to the sequences we wish to download.The functionentrez_fetchallows users to retrieve
complete records in a variety of formats. Here the sequences are retrieved in the standard ‘fasta’
format, and returned as a character vector with a single element.
raw_recs <- entrez_fetch(db="nuccore",
id=nuc_links$links$gene_nuccore_refseqrna, rettype="fasta")
cat(substr(raw_recs, 1,303), "...")
#> >NM_001136131.2 Homo sapiens amyloid beta precursor protein (APP) ... #> GTCGGATGATTCAAGCTCACGGGGACGAGCAGGAGCGCTCTCGACTTTTCTAGAGCCTCAGCGTCCTAGG #> ACTCACCTTTCCCTGATCCTGCACCGTCCCTCTCCTGGCCCCAGACTCTCCCTCCCACTGTTCACGAAGC #> CCAGGTACCCACTGATGGTAATGCTGGCCTGCTGGCTGAACCCCAGATTGCCATGTTCTGTGGCAGA...
Sequences retrieved in this way could be written to file to be used by other software.
cat(raw_recs, file="APP_transcripts.fasta")
Alternatively, the sequences can be analysed within R using packages designed for sequence data.
In this case, the data can be represented as a'DNAbin'object using the phylogenetics packageape.
tf <- tempfile() cat(raw_recs, file=tf)
ape::read.dna(tf, format="fasta")
#> 10 DNA sequences in binary format stored in a list. #>
#> Mean sequence length: 3477.9 #> Shortest sequence: 3255 #> Longest sequence: 3648 #>
#> Labels:
#> NM_001136131.2 Homo sapiens amyloid beta precursor protein (...
#> NM_001136016.3 Homo sapiens amyloid beta precursor protein (... #> NM_001204303.1 Homo sapiens amyloid beta precursor protein (... #> NM_001204301.1 Homo sapiens amyloid beta precursor protein (... #> NM_001204302.1 Homo sapiens amyloid beta precursor protein (... #> NM_201414.2 Homo sapiens amyloid beta precursor protein (APP... #> ...
#>
#> Base composition:
#> a c g t
#> 0.276 0.223 0.258 0.244
The workflow detailed above provides a relatively simple example of how functions provided by
rentrezcan be used to identify, retrieve and analyse data from the NCBI’s databases. The package includes an extensive vignette which documents each of the eUtils endpoints and demonstrates a number of detailed workflows. This document also describes how analyses can be scaled to analyse much larger datasets than are described in this paper. The tutorial can be accessed from within an R
session by typingvignette(topic="rentrez_tutorial").
Demonstration: development of a new package
Development ofrentrezhas deliberately focused on producing a "low-level" package that provides a
flexible interface to the entire eUtils API. As a result the package does not provide functions for any particular analysis or return records in any of the object classes made available for biological data by other packages. Rather, it is hoped that by providing a reliable interface to the eUtils API that
meets the NCBI’s terms of userentrezwill help other developers to build packages for more specific
use-cases. Indeed, the package has already been used to integrate NCBI data into packages dealing
with sequence analysis (genbankr,Becker and Lawrence 2017), retrieval of phylogenetic trees (rotl,
Michonneau et al. 2016) and handling of full-text journal articles (fulltext,Chamberlain 2016).
New packages that take advantage ofrentrezwill usually focus on providing a simple interface to
users, so researchers will not need to be familiar with the syntax or arguments used in eUtils to perform
tasks. Packages may also provide functions to parse files returned byentrez_fetch, either to extract
particular information from those files or represent them as R objects. Here I present an example of a small package that performs both of these tasks.The software repository for this manuscript (https://github.com/dwinter/rentrez_ms) includes the code for a package called ‘tidytaxonomy’ that can be used to explore the taxonomic diversity of various NCBI databases. This demonstrates
how the low-level code inrentrezcan be used to develop specific applications that have a simpler
interface than could be achieved with corerentrezfunctions alone.
The exposed functions fromtidytaxonomyretrieve data from NCBI, but do not require the user to
have any knowledge of the eUtils API. Internal functions
parse the XML formatted records returned from the NCBI Taxonomy database and extract relevant
information. The core functiontidy_taxonomyallows users to retrieve a part of the NCBI Taxonomy
database in ‘tidy data’ format (Wickham,2014).
# install.packages('devtools') # (If not already installed) devtools::load_all("tidytaxon")
animal_orders <- tidy_taxonomy("animals",
lowest_rank="order",
higher_ranks=c("phylum", "class")) head(animal_orders,3)
#> phylum class order
#> 1 Chordata Actinopteri Lutjaniformes #> 2 Chordata Actinopteri Gerreiformes #> 3 Chordata Actinopteri Priacanthiformes
Once this data is obtained, two additional functions make it easy to include the number of
records a given taxon has in a particular database. The functiontaxon_childrenis specifically for
counting taxonomy records which are subordinate to a given taxonomic group. The other function,
taxon_records, discovers records in any NCBI database.
animal_orders$species <- taxon_children(animal_orders$order)
species (n = 468,699) Sabellida Araneae Blattodea Coleoptera Diptera Hemiptera Hymenoptera Lepidoptera Odonata Orthoptera Trichoptera Amphipoda Decapoda Isopoda Cypriniformes Perciformes Caudata Passeriformes Chiroptera Rodentia Squamata Clitellata Polychaeta Arachnida Malacostraca
Actinopteri Amphibia Mammalia
Anthozoa Bivalvia Gastropoda Chromadorea Enoplea Cestoda Trematoda Annelida Arthropoda Chordata Cnidaria Mollusca Nematoda
papers (n = 21,235,871)
Carnivora Lagomorpha
Primates Rodentia
Chordata
sequences (n = 119,943,315)
Araneae Ixodida Coleoptera Diptera Hemiptera Hymenoptera Lepidoptera Decapoda Isopoda Cichliformes Cypriniformes Perciformes
SalmoniformesSiluriformes Galliformes
Passeriformes Carnivora Chiroptera Insectivora Lagomorpha Primates Rodentia Sirenia Squamata Testudines Scleractinia Zoantharia Ascaridida Rhabditida Tricladida Arachnida Insecta Malacostraca Maxillopoda Actinopteri Amphibia Aves Mammalia Anthozoa Hydrozoa Asteroidea Cestoda Trematoda Annelida Arthropoda Chordata Cnidaria Echinodermata Mollusca Nematoda
genomes (n = 765)
[image:5.595.144.452.69.380.2]Araneae Ixodida Scorpiones Blattodea Coleoptera Diptera Hemiptera Hymenoptera Lepidoptera Odonata Decapoda Isopoda Cichliformes Cyprinodontiformes Perciformes Anura Caudata GalliformesGruiformes Passeriformes Psittaciformes CarnivoraCetacea Chiroptera Primates Rodentia Crocodylia SquamataTestudines Zoantharia Bivalvulida Myoida Mytiloida Rhabditida Spirurida Tylenchida Arachnida Malacostraca Actinopteri Ascidiacea Aves Mammalia Anthozoa Chromadorea Enoplea Cestoda Trematoda Annelida Arthropoda Chordata CnidariaMollusca Nematoda Platyhelminthes
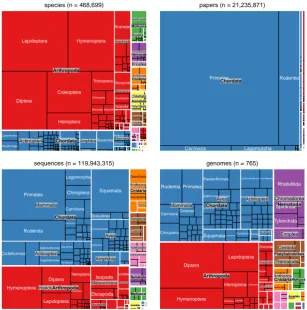
Figure 1:Taxonomic diversity of various NCBI databases (considering only animals). Panels in each plot are scaled to represent the number of database records corresponding to a given taxonomic rank and are shaded to reflect the phylum to which they belong. Starting from the upper left in clockwise direction subplots represent number of species in NCBI Taxonomy, the number of papers in PubMed, the number of sequences in NCBI Nucleotide database and the number of nuclear genome sequences in NCBI Genome database.
animal_orders$sequences <- taxon_records(animal_orders$order, db="nuccore") animal_orders$papers <- taxon_records(animal_orders$order, db="pubmed") head(animal_orders,3)
#> phylum class order species genomes sequences papers #> 1 Chordata Actinopteri Lutjaniformes 279 0 9315 0
#> 2 Chordata Actinopteri Gerreiformes 62 0 901 0
#> 3 Chordata Actinopteri Priacanthiformes 34 0 602 0
The resulting data can be used to visualise the taxonomic diversity of NCBI databases (Figure
1). The Appendix to this paper includes code that takes advantage oftreemap(Tennekes,2017) to
produce these visualisations.
Continued development of rentrez
rentrezcovers the complete eUtils API, is well-documented at the function and package level and includes an extensive test suite that covers internal functions as well as typical use-cases of the software.
The current version ofrentrezis thus considered a stable release, and it is unlikely any additional
functionality will be added. The software is nevertheless still actively maintained to keep pace with CRAN and NCBI policies and to fix any bugs that arise. Software issues, including bug reports and requests for help with particular use-cases, are welcomed at the package’s software repository:
Acknowledgements
Development ofrentrezhas benefited greatly from being part of the rOpenSci project. I am especially
grateful to Scott Chamberlain for his guidance. I am also very grateful to everyone who has pro-vided pull-requests or filed issues including Chris Stubben, Karthik Ram, Han Guangchun, Matthew O’Meara, Reed Cartwright and Pavel Fedotov.
Bibliography
G. Becker and M. Lawrence.Genbankr: Parsing GenBank Files into Semantically Useful Objects, 2017. R
package version 1.2.1. [p4]
S. Chamberlain.Fulltext: Full Text of ’Scholarly’ Articles Across Many Data Sources, 2016. URLhttps:
//CRAN.R-project.org/package=fulltext. R package version 0.1.8. [p4]
S. Kovalchik.RISmed: Download Content from NCBI Databases, 2017. URLhttps://CRAN.R-project.
org/package=RISmed. R package version 2.1.7. [p1]
F. Michonneau, J. W. Brown, and D. J. Winter. rotl: An r package to interact with the open tree of life
data.Methods in Ecology and Evolution, 7(12):1476–1481, 2016. URL
https://doi.org/10.1111/2041-210x.12593. [p4]
E. Paradis, J. Claude, and K. Strimmer. APE: Analyses of phylogenetics and evolution in R language.
Bioinformatics, 20:289–290, 2004. [p1]
J. Rani, S.Ramachandran, and A. R. Shah.An R Package for Text Mining of PubMed Abstracts., 2014. R
package version 1.0.5. [p1]
E. Sayers and D. Wheeler.Building Customized Data Pipelines Using the Entrez Programming Utilities
(eUtils). NCBI, 2004. [p1]
G. Schöfl.Reutils: Talk to the NCBI EUtils, 2016. URLhttps://CRAN.R-project.org/package=reutils.
R package version 0.2.3. [p1]
M. A. Stravs, E. L. Schymanski, H. P. Singer, and J. Hollender. Automatic recalibration and processing
of tandem mass spectra using formula annotation.Journal of Mass Spectrometry, 48(1):89–99, 2013.
[p1]
C. Stubben.Genomes: Genome Sequencing Project Metadata, 2015. R package version 3.4.0. [p1]
M. Tennekes. Treemap: Treemap Visualization, 2017. URLhttps://CRAN.R-project.org/package=
treemap. R package version 2.4-2. [p5]
H. Wickham. Tidy data.The Journal of Statistical Software, 59, 2014. URLhttp://www.jstatsoft.org/
v59/i10/. [p4]
J. Zhou and Y. Shui.MeSHSim: MeSH(Medical Subject Headings) Semantic Similarity Measures, 2015. R
package version 1.6.0. [p1]
David J. Winter
Institute of Fundamental Sciences, Massey University Palmerston North 4442
New Zealand
ORCiD: 0000-0002-6165-0029
Appendix
Code used to produce Figure1, usinganimal_ordersdata generated above.
# Format the total number of records for a graph title make_title <- function(col_name, data){
n <- sum(data[,col_name])
paste0(col_name, " (n = ", with_commas, ")") }
# Generate a treemap from taxonmic data.frame # * data= tidy_taxonomy data.frame
# * size_col = name of column for tm tile-size # * fill_col = name of column for tile-fil # * row = plot row in 2x2 grid
# * col = plot col in 2x2 grid # * pal = palette for fill
taxic_diversity_tm <- function(data, size_col, fill_col, row, col, pal){ treemap(data,
index=c("phylum", "class", "order"), vSize=size_col, vColor=fill_col, palette=pal, type='categorical', position.legend="none",
title=make_title(size_col, data), border.col=c("white","white","black"), vp = viewport(layout.pos.row = row, layout.pos.col = col)
) }
library(treemap) library(grid) library(gridExtra)
# 24 phyla means some fill-colours will be re-used, ordering phylum factor by spp # will prevent any "major" phyla from getting the same colour.
spp_per_phylum <- aggregate(species ~ phylum, FUN=sum, data=animal_orders)
phyla_ordered <- spp_per_phylum$phylum[ order(spp_per_phylum$species, decreasing=TRUE)] animal_orders$phylum<- factor(animal_orders$phylum, levels=phyla_ordered)
pal <- rep(RColorBrewer::brewer.pal(8, name="Set1"), 3)
grid.newpage()
pushViewport(viewport(layout = grid.layout(2, 2)))
Massey Documents by Type Journal Articles