Int. J. Electrochem. Sci., 12 (2017) 2822 – 2835, doi: 10.20964/2017.04.32
International Journal of
ELECTROCHEMICAL
SCIENCE
www.electrochemsci.orgHigh-rate-capability Graphene Oxide/Li
4Ti
5O
12-composite
Anode for Lithium-Ion Batteries
Wen Li1,2, *, Aijia Wei1,2, Xiaohui Li1,2, Lihui Zhang1,2, Hao Wang3, Wujie Ge3, Zhenfa Liu1, 2,*
1
Institute of Energy Resources, Hebei Academy of Science, Shijiazhuang, Hebei Province 050081, PR China.
2
Hebei Engineer Research Center for Water Saving in Industry, Shijiazhuang, Hebei Province 050081, PR China
3
Chengdu Institute of Organic Chemistry, Chinese Academy of Sciences, Chengdu 610041, PR China
*
E-mail: liwen_cc@yeah.net, liuzhenfa@hebut.edu.cn
Received: 12 December 2016 / Accepted: 9 February 2017 / Published: 12 March 2017
A graphene oxide/Li4Ti5O12 (GO/LTO) composite was prepared with 1 wt% GO and 99 wt%
commercial LTO by stirring at a high speed and then drying at a low temperature. Compared with pure LTO, the GO/LTO composite demonstrated higher charge capacity and better rate capability over 0-3 V. The charge capacities at 0.5, 1, 3, 5, and 10 C were 246.3, 234.0, 223.2, 220.6, and 214.1 mAh g-1, respectively, for GO/LTO and 233.7, 218.7, 202.1, 190.5, and 148.5 mAh g-1, respectively, for LTO. Furthermore, the GO/LTO composite retained 95.1% of the initial capacity after 200 cycles at a high rate of 5 C, which was considerably higher than that that retained by the pure LTO (57.9%). The greatly improved electrochemical performance is attributed to an enhancement of lithium ion and electron conductivity caused by GO addition. GO acts as a binder, thereby improving the adhesive power of the electrode materials to the current collector. The electrode polarization is reduced and the electrolyte reduction decomposition is partially suppressed by adding GO. The process of preparing the GO/LTO composite is simple, low-cost and suitable for industrial use.
Keywords: graphene oxide, Li4Ti5O12, composite, lithium-ion batteries
1. INTRODUCTION
The spinel Li4Ti5O12 (LTO) is suggested as one of the most promising anode materials to
within a wide range of operating temperatures [1-4]. Unfortunately, LTO shows a low intrinsic electronic conductivity and lithium-ion diffusion coefficient, which seriously hinders its high-rate performance [5]. A number of approaches have been used to overcome these problems in attempts to improve the electrochemical performance of LTO anodes, including morphological optimization [6-20], nanostructuring [21-25], doping [26-37], surface coating [38-44] and formation of composite [45-54]. Among these methods above, preparation of LTO-based composites by adding high conductive carbon materials via a facile route is practicable and economical for large-scale industrialization.
To our best knowledge, graphene as a carbon resource usually fabricated by reducing graphene oxide (GO), has attracted intense attention recently [55]. Due to its superior electrical conductivity and high specific surface area (>2600 m2
g-1), graphene has been used to prepare the LTO/graphene composites to enhance the electrochemical properties of LTO [56-62]. The added graphene could avoid aggregation of the LTO particles, increase the apparent conductivity of the electrode and provide large active contact area between the electrode and electrolyte, thereby improving the electrode performance, especially its rate capability [56-64]. As the precursor of graphene, GO also presents a higher lithium storage capacity and the preparation of GO is simpler and lower cost than graphene itself because it does not need a reduction treatment [65-66]. However, GO and GO-based composites direct used as anode materials in LIBs are hardly reported. We have previously used GO to prepare graphite/GO composites and GO/graphite/carbon composites as anode materials. These anode materials demonstrated good electrochemical performance, including a higher storage capacity than traditional graphite anode materials [66-67]. Moreover, GO has been found lithium to easily form self-assembled membranes and can be used instead of a polymer binder in electrodes [66-67]. Thus, commercial LTO, GO, and conductive carbon black were recently applied to fabricate a binder-free GO/LTO composite as an anode material in our work [68]. The addition of GO provides the additional capacity via oxygen-containing functional group and nano-cavity [68-69]. In addition to contributing to the lithium-ion storage, GO also acted as a binder, replacing the carboxy methylated cellulose, which makes the composite with CMC binder free, thereby speeding up the lithium ion diffusion in anode materials [68].
Unfortunately, the binder-free GO/LTO composite required more than 10 wt% GO to obtain outstanding electrode adhesion and electrochemical performance, which is prohibitive due to the high cost of GO. In this study, we used a simple method that required only 1 wt% GO mixed with 99 wt% commercial LTO to prepare a novel GO/LTO composite material and investigated this material for use as a lithium battery anode.
2. EXPERIMENTAL
2.1. Synthesis and characterization
treatment for about 30 min to give a stable amber dispersion [68]. Commercial LTO powder (Shanghai Dian Yang Industrial Co., Ltd.) was then added to the aqueous GO dispersion and stirred for 4 h at a linear velocity of 18 m per s Finally, the mixture was dried at 105 °C to obtain the GO/LTO composite.
Powder X-ray diffraction (XRD, Xpert MPD DY1219) with Cu Kα radiation was used to
identify the phase composition of the materials. The diffraction patterns were collected at room temperature by step scanning over a 10-90° range at a scanning rate of 0.02° per 10 s. The morphology of the materials was determined using scanning electron microscopy (SEM, Sirion 200 FEI Netherlands) and high-resolution transmission electron microscopy (TEM, JEM-100CX, JEOL).
2.2. Electrochemical measurements
The electrochemical properties of the prepared materials were measured using a CR2032 coin-type half-cell in which the cathode and Li-metal anode were separated by a porous polypropylene film (Celgard 2400, Celgard Inc., USA). The cathode slurry was prepared by homogeneously mixing the active material (LTO or GO/LTO), Super-P carbon black, and LA-132 binder in a mass ratio of 85:5:5 in deionized water. Then the slurry was cast onto a Cu foil and dried for 12 h under vacuum at 105 °C. Finally, the electrode laminate was punched into disks (10 mm in diameter) and dried in a vacuum oven at 105 °C for 24 h. The coin-cell assembly was performed in an argon-filled glovebox. A solution of 1 mol L-1 LiPF6 in ethylene carbonate, dimethyl carbonate, and diethyl carbonate (1:1:1, in volume)
was used as the electrolyte (Shenzhen Capchem Technology (Shenzhen) Co., Ltd.).
Galvanostatic charge-discharge tests were conducted over 0-3 V at different charge/discharge C-rates between 0.2 and 10 C (1 C = 250 mAh g-1) at 25 °C using an automatic galvanostatic charge-discharge unit (Land 2001A, Wuhan, China). An electrochemical workstation (PARSTAT 2273, USA) was used to carry out cyclic voltammetry (CV) and electrochemical impedance spectroscopy (EIS) tests. The CV tests were carried out over 0-3 V at a scan rate of 0.2 mV s-1. The EIS measurements were performed over a frequency range of 10 mHz to 100 kHz at the stable voltage of 1.55 V during the first charge cycle.
3. RESULTS AND DISCUSSION
10 20 30 40 50 60 70 80 90
2
LTO
PDF#49-0207 LTO
Intensity
/(
a.u.)
[image:4.596.186.409.70.238.2]GO/LTO
[image:4.596.56.543.294.476.2]Figure 1. The standard XRD pattern of LTO and XRD patterns of both samples
Figure 2. SEM micrographs of (a) LTO and (b) GO/LTO
[image:4.596.55.541.531.718.2]
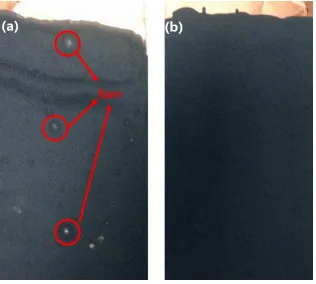
Figure 4. Photographs of (a) LTO and (b) GO/LTO electrodes
The GO appears as thin sheets (Fig. 3a), while GO sheets cover the LTO particles in the GO/LTO composite (Fig. 3b). Photographs of LTO and GO/LTO electrodes prepared under the same conditions are shown in Fig. 4.
0.0 0.5 1.0 1.5 2.0 2.5 3.0
-1.0 -0.5 0.0 0.5
0.6 0.8 1.0 -0.1
0.0 0.1
electrolyte decomposition LTO
GO/LTO
Voltage (V)
C
urre
nt
(
m
A
m
g
-1 )
0 50 100 150 200 250 300
0.0 0.5 1.0 1.5 2.0 2.5 3.0
electrolyte decomposition charge
discharge
V
ol
tage
(V
vs. Li/
L
i
+ )
Specific capacity (mAh g-1) LTO
[image:6.596.146.442.71.286.2]GO/LTO (b)
Figure 5. (a) CV curves of both samples at a scanning of 0.2 mV s-1 and (b) discharge-charge curves of both samples at 0.2 C-rate (1 C = 250 mAh g-1) over 0-3 V
The pure LTO electrode is unevenly coated with some bare Cu foil visible, but the GO/LTO electrode is perfectly coated with no bare Cu foil visible. This is a result of the added GO acts as a binder and enhancing the bond strength between the Cu foil and the electrode materials.
The electrochemical properties of both LTO and GO/LTO electrodes in the range of 0-3 V were systematically studied. Fig. 5a shows the CV curves of both electrodes over a 0-3 V range at a scan of 0.2 mV s-1. The cathodic and anodic peaks at around 1.6 and 1.5 V, respectively, are attributed to the Ti4+/Ti3+ redox couple, and the reduction and oxidation peaks below 0.6 V are caused by the further reduction of Ti4+ [69-70]. Moreover, for both samples, an obvious irreversible peak appears at around 0.7 V during the reduction process.
0 40 80 120 160 200 240
80 100 120 140 160 180 200 220 240 5C 57.9% 95.1% Ca p a city (m Ah g -1 ) Cycle number LTO GO/LTO (a) 5C
0 5 10 15 20 25 30
120 140 160 180 200 220 240
0 2 4 6 8 10
150 175 200 225 250
Rate (C, 1 C= 250 mAh g-1)
Ca p a city (m Ah g -1 ) Cycle number LTO GO/LTO 0.5 C 10 C 5 C 3 C 1 C 0.5 C (b)
Figure 6. (a) Cycling performance and (b) rate capacity at various C-rates over 0-3 V and discharge capacity as a function of the C-rates (inset Fig. 6b) over 0-3 V of both samples (1 C = 250 mAh g-1)
[image:7.596.144.446.74.498.2]
discharge capacity of 270.6 mAh g-1, which is close to the results of reported work [71]. In the region above 1.0 V, the discharge capacity of 162.1mAh g-1 is corresponding to the transition from the spinel (LTO) to the rock-salt structure (Li7Ti5O12). And in the section below 1.0 V, the discharge capacity is
108.5 mAh g-1, which is higher than the theoretic capacity for the single phase transition from Li7Ti5O12 to Li8.5Ti5O12 (about 87.5 mAh g-1) [71]. The extra capacity is mainly attributed to the
[image:8.596.145.447.528.731.2]lithium storage in the conductive carbon black and to the side reaction between the electrolyte and the electrode [71]. For the GO/LTO composite, the discharge curve is similar as that for pure LTO. In the first section (3.0-1.0 V), the discharge capacity is 164.7 mAh g-1, which is nearly equal to that of the pure LTO. However, in the following section (1.0-0 V), the discharge capacity of 126.3 mAh g-1 is relatively higher than that of pure LTO (108.5 mAh g-1). Comparing with LTO, the extra discharge capacity of the GO/LTO composite can be due to the lithium storage in the added GO. Xiang etal reported the LTO/graphene composite contains about 8 wt% garphene sheets showed a total discharge capacity of over 430 mAh g-1, but a really low coulombic efficiency of 65.8% [71], which could be ascribed to the more side reactions on the active graphene sheets with high specific surface area [66-68, 71]. Whereas, the GO/LTO composite shows a relative higher coulombic efficiency of 87.5%, which is due to the less addition amount of GO.
Fig. 6a shows the cycling performance of both electrodes over 0-3 V and one can see that the GO/LTO composite exhibits significantly better cycling stability than pure LTO. The capacity retention of the GO/LTO composite electrode at a high rate of 5 C from cycles 35-230 is 95.1%, which is much higher than that of the pure LTO electrode (57.9%). Fig. 6b shows the rate capacity of both samples at various C-rates over 0-3 V, and the second-cycle discharge capacity at each rate is compared in the inset of Fig. 6b. The charge capacity decreased with increasing C-rate for both samples. The respective charge capacities at 0.5, 1, 3, 5, and 10 C are 233.7, 218.7, 202.1, 190.5 and 148.5 mAh g-1 for pure LTO and 246.3, 234.0, 223.2, 220.6 and 214.1 mAh g-1 for the GO/LTO composite, demonstrating that the charge capacity of GO/LTO was better than that of LTO at all tested C-rates.
0 50 100 150 200 250
0.0 0.5 1.0 1.5 2.0 2.5 3.0
LTO
Specific capacity (mAh g-1)
V
ol
tage
(
V
vs. Li/
L
i
+ )
0.5 C 1 C 3 C 5 C 10 C
0 50 100 150 200 250
0.0 0.5 1.0 1.5 2.0 2.5 3.0
GO/LTO
Specific capacity (mAh g-1)
V
ol
tage
(V
vs. Li/
L
i
+ )
0.5 C 1 C 3 C 5 C 10 C
[image:9.596.142.447.72.280.2](b)
Figure 7. Discharge-charge curves of (a) LTO and (b) GO/LTO at different C-rates over 0-3 V
In our previous report, the pure LTO is co-modified with Mg2+ and F- and the electrochemical performance in the range of 0-3 V was studied [69]. The charge capacities of Mg2+ and F- co-modified LTO at 0.5C, 1C, 3C, 5C and 10C rate were 234.1, 218.6, 200.8, 182 and 148mAh g-1, respectively [69]. Therefore, the GO/LTO composite electrode exhibits better rate capability than the Mg2+ and F -co-modified LTO.
Table 1. Potential differences (△V, V) between discharge voltage platform(φdischarge,V) and charge
voltage platform (φcharge, V) at different C-rates
C-rate LTO φdischarge φcharge GO/LTO
△V φdischarge φcharge △V
0.5 C 1.548 1.594 0.046 1.550 1.591 0.041
1 C 1.532 1.611 0.079 1.541 1.604 0.063
3 C 1.477 1.673 0.196 1.506 1.645 0.139
5 C 1.439 1.723 0.284 1.476 1.678 0.202
10 C 1.271 1.860 0.589 1.389 1.756 0.367
Fig. 7 shows the discharge-charge curves of both samples at different C-rates over 0-3 V. For both electrodes, it can be seen that the potential difference between discharge and charge voltage platforms becomes larger with increasing C-rate, suggesting increased electrode polarization at higher C-rates. Table 1 lists the values of discharge voltage platforms (φdischarge), charge voltage platforms
[image:9.596.45.548.494.597.2]
smaller for the GO/LTO composite electrode compared to the pure LTO electrode at all tested C-rates, which indicates that adding GO reduces the electrode polarization.
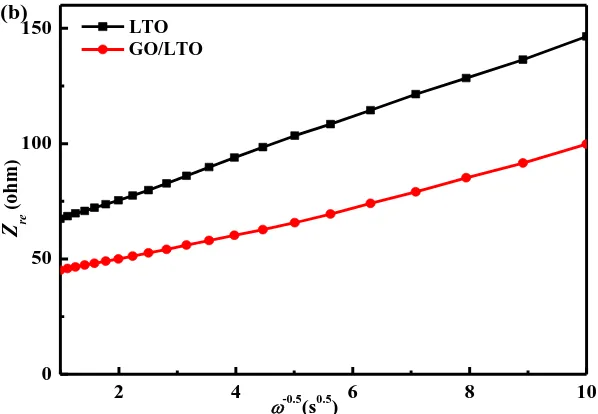
EIS is considered to be one of the most sensitive tools for studying changes in electrode behavior. The results of EIS measurements at the stable voltage of 1.55 V are shown in Fig. 8 for all samples. The impedance spectra in Fig. 8a are composed of one semicircle at higher frequencies followed by a linear section at lower frequencies [69-70]. The low frequency region of the straight line is attributed to the diffusion of lithium ions into the bulk of the electrode material, the so-called Warburg diffusion [69-70]. The relationship between the imaginary impedance and the low frequencies is illustrated in Fig. 8b. This relationship is governed by Eqs. (1) and (2). Diffusion coefficient values for the lithium ions in the bulk electrode materials are calculated by Eq. (3). The exchange current density i is obtained by Eq. (4).
5 . 0 ''
Z , [1]
5 . 0 r
s ct
e
R
R
Z
, [2]2 2 ) ( 5 . 0 C AF RT D
, [3]
ct
nFR RT
i , [4]
where Z'' is the imaginary impedance, ω is the angular frequency in the low frequency region, Rs is the electrolyte resistance, Rct is the charge-transfer resistance, R is the gas the gas constant; D is the diffusion coefficient; T is the absolute temperature; F is Faraday's constant; A is the area of the electrode surface; C is the molar concentration of lithium ions and i is the exchange current density. The EIS parameters are stated in Table 2.
0 50 100 150 200
2 4 6 8 10
0 50 100
150 LTO
GO/LTO
Z re
(
ohm
)
-0.5
(s0.5)
(b)
[image:11.596.144.443.75.282.2]Figure 8. (a) EIS curves and (b) the relationship between Zre and the lower angular frequencies of both samples
Table 2. The EIS parameters of both samples
Sample Rs(Ω) Rct (Ω)
5
0.
ω (Ω cm2
s-1) D (cm2 s-1) i (mA cm-2)
LTO 2.89 51.13 8.78 1.83E-9 1.96E-3
GO/LTO 2.91 36.29 6.08 3.82E-9 2.76E-3
The value of D for the GO/LTO composite is higher than that of pure LTO, indicating that lithium ions have greater mobility within the GO/LTO composite than within pure LTO. Furthermore, the value of i for the GO/LTO composite is also higher than that of pure LTO, suggesting that the charge-transfer reaction is stronger for the GO/LTO composite electrode than the pure LTO electrode. Therefore, the GO/LTO composite has better ionic and electronic conductivity than pure LTO. This is likely to be due to the following factors: (1) The added GO acts as a binder and enhances the adhesion of the electrode materials to the current collector, thereby improving the transport of lithium ions and electrons among the electrode materials; (2) The GO sheets cover a portion of the catalytic sites for decomposition of electrolyte, thereby suppressing SEI layer formation and effectively accelerating the diffusing of lithium ions and electrons to the electrode surface when compared with the SEI-layer-coated LTO electrode.
4. CONCLUSION
[image:11.596.45.555.369.435.2]
GO. Meanwhile, the GO/LTO composite exhibits higher lithium ion and electron conductivity than pure LTO. Hence, the GO/LTO composite shows superior rate capability and cycling performance over 0-3 V compared with pure LTO. In particular, the GO/LTO composite retains 95.1% of the initial capacity after 200 cycles at a high rate of 5 C.
ACKNOWLEDGEMENTS
This work was financially supported by Science and Technology Program of Hebei Province (16294403D) and Project of Hebei Academy of Science (161302).
References
1. B. Yan, M. Li, X. Li, Z. Bai, J. Yang, D. Xiong, D. Li, J. Mater. Chem. A 3 (2015) 11773. 2. J. Mosa, J.F. Velez, I. Lorite, N. Arconada, M. Aparicio, J. Power Sources 205 (2012) 491. 3. K. Mukai, Y. Kato, H. Nakano, J. Phys. Chem. C 118 (2014) 2992.
4. D.V. Safronov, S.A. Novikova, A.M. Skundin, A.B. Yaroslavtsev, Inorg. Mater. 48 (2012) 57. 5. B.T. Zhao, R. Ran, M.L. Liu, Z.P. Shao, Meter. Sci. Eng. R 98 (2015) 1.
6. L. Sun, J. Wang, K. Jiang, S. Fan, J. Power Sources 248 (2014) 265.
7. J. Cheng, R. Che, C. Liang, J. Liu, M. Wang, J. Xu, Nano Res. 7 (2014) 1043. 8. Y. Zhao, J. Sun, X. Chen, H. Zhu, W. Yang, New J. Chem. 38 (2014) 1173 9. A. Nugroho, K.Y. Chung, J. Kim, J. Phys. Chem. C 118 (2014) 183. 10.A.K. Haridas, C.S. Sharma, T.N. Rao, Small 11 (2015) 290.
11.A. Izumi, M. Sanada, K. Furuichi, K. Teraki, T. Matsuda, K. Hiramatsu, H. Munakata, K. Kanamura, J. Power Sources 256 (2014) 244.
12.Y. Wu, H. Wu, S. Luo, K. Wang, F. Zhao, Y. Wei, P. Liu, K. Jiang, J. Wang, S. Fan, RSC Adv. 4 (2014) 20010.
13.S. W. Han, S.J. Kim, E.S. Oh, J. Electrochem. Soc. 161 (2014) A587. 14.G.M. Zhou, F. Li, H.M. Cheng, Energy Environ. Sci 7 (2014) 1307.
15.B.T. Zhao, G.M. Yang, R. Ran, C. Kwak, D.W. Jung, H.J. Park, Z.P. Shao, J. Mater. Chem. A 2 (2014) 9126.
16.J.H. Choi, W.H. Ryu, K. Park, J.D. Jo, S.M. Jo, D.S. Lim, I.D. Kim, Sci. Rep. 4 (2014) 7334. 17.J. Liu, K. Song, P.A. van Aken, J. Maier, Y. Yu, Nano Lett. 14 (2014) 2597.
18.X. Wang, B. Liu, X. Hou, Q. Wang, W. Li, D. Chen, G. Shen, Nano Res. 7 (2014) 1073. 19.L. Gao, S. Li, D. Huang, Y. Shen, M. Wang, J. Mater. Chem. A 3 (2015) 10107.
20.S. Cao, X. Feng, Y. Song, X. Xue, H. Liu, M. Miao, J. Fang, L. Shi, ACS Appl. Mater. Interfaces 7 (2015) 10695.
21.Y. J. Gu, Z. Guo, H. Q. Liu, Electrochim. Acta 123 (2014) 576.
22.H. Hayashi, T. Nakamura, T. Ebina, J. Ceram. Soc. Jpn. 122 (2014) 78.
23.S.W. Han, J. Jeong, D.H. Yoon, Appl. Phys. A: Mater. Sci. Process. 114 (2014) 925.
24.D. Wang, X. Wu, Y. Zhang, J. Wang, P. Yan, C. Zhang, D. He, Ceram. Int. 40 (2014) 3799. 25.H. Xu, X. Hu, W. Luo, Y. Sun, Z. Yang, C. Hu, Y. Huang, ChemElectroChem 1 (2014) 611. 26.C.C. Yang, H.C. Hu, S.J. Lin, W.C. Chien, J. Power Sources 258 (2014) 424.
27.J.G. Kim, M.S. Park, S.M. Hwang, Y.U. Heo, T. Liao, Z. Sun, J.H. Park, K.J. Kim, G. Jeong, Y.J. Kim, J.H. Kim, S.X. Dou, ChemSusChem 7 (2014) 1451.
28.V.D. Nithya, S. Sharmila, K. Vediappan, C.W. Lee, L. Vasylechko, R.K. Selvan, J. Appl. Electrochem. 44 (2014) 647.
31.C.W. Xiao, Y. Ding, J.T. Zhang, X.Q. Su, G.R. Li, X.P. Gao, P.W. Shen, J. Power Sources 248 (2014) 323.
32.Q. Zhang, H. Lu, H. Zhong, X. Yan, C. Ouyang, L. Zhang, J. Mater. Chem. A 3 (2015) 13706. 33.X. Li, S. Tang, M. Qu, P. Huang, W. Li, Z. Yu, J. Alloys Compd. 588 (2014) 17.
34.E.F. Rodriguez, F. Xia, D.H. Chen, A.F. Hollenkamp, R.A. Caruso, J. Mater. Chem. A, 4 (2016) 7772.
35.Q.Y. Zhang, M.G. Verde, J.K. Seo, X. Li, Y.S. Meng, J. Power Sources, 280 (2015) 355. 36.S.Y. Yang, J. Yuan, Y.R. Zhu, T.F. Yi, Y. Xie, Ceramics International, 41 (2015) 7073. 37.F. Zhao, P. Xue, H.H. Ge, L. Li, B.F. Wang, J. Electrochem. Soc., 163 (2016) A690. 38.Y.L. Zhang, X.B. Hu, Y.L. Xu, C. Chen, Solid State Ionics, 276 (2015) 18.
39.T.F. Yi, J.Z. Wu, M. Li, Y.R. Zhu, Y. Xie, R.S. Zhu, RSC Adv., 5 (2015) 37367.
40.C. Wang, Z. Guo, W. Shen, Q. Xu, H. Liu, Y. Wang, Adv. Funct. Mater. 24 (2014) 5511. 41.Y.R. Zhu, T.F. Yi, H.T. Ma, Y.Q. Ma, L.J. Jiang, R.S. Zhu, J. Chem. Sci 126 (2014) 17.
42.M. Krajewski, M. Michalska, B. Hamankiewicz, D. Ziolkowska, K.P. Korona, J.B. Jasinski, M. Kaminska, L. Lipinska, A. Czerwinski, J. Power Sources 245 (2014) 764.
43.C. Cheng, H. Liu, X. Xue, H. Cao, L. Shi, Electrochim. Acta 120 (2014) 226. 44.N. Li, J. Liang, D. Wei, Y. Zhu, Y. Qian, Electrochim. Acta 123 (2014) 346. 45.L.P. Fan, X. Tan, T. Yu, Z.Q. Shi, RSC Adv., 6 (2016) 26406.
46.J.E. Hong, R.G. Oh, K.S. Ryu, J. Electrochem. Soc., 162 (2015) A1978. 47.C.H. Chen, R. Agrawal, C.L. Wang, Nanomaterials, 5 (2015) 1469.
48.Z.K. Fang, Y.R. Zhu, T.F. Yi, Y. Xie, ACS Sustainable Chem. Eng., 4 (2016) 1994.
49.C. Lin, X. Fan, Y. Xin, F. Cheng, M.O. Lai, H. Zhou, L. Lu, J. Mater. Chem. A 2 (2014) 9982. 50.C. Chen, Y. Huang, C. An, H. Zhang, Y. Wang, L. Jiao, H. Yuan, ChemSusChem 8 (2015) 114. 51.Y. Wang, H. Rong, B. Li, L. Xing, X. Li, W. Li, J. Power Sources 246 (2014) 213.
52.C. Wang, H. Li, A. Fu, J. Liu, W. Ye, P. Guo, G. Pang, X.S. Zhao, New J. Chem. 38 (2014) 616. 53.X. Sun, M. Hegde, Y. Zhang, M. He, L. Gu, Y. Wang, J. Shu, P.V. Radovanovic, B. Cui, Int. J.
Electrochem. Sci. 9 (2014) 1583.
54.M.M. Chen, X. Sun, Z.J. Qiao, Q.-Q. Ma, C.Y. Wang, J. Alloys Compd. 601 (2014) 38. 55.Y. Zhu, S. Murali, W. Cai, X. Li, J.W. Suk, J.R. Potts, R.S. Ruoff, Adv. Mater. 2 (2010) 3906. 56.N. Zhu, W. Liu, M. Xue, Z. Xie, D. Zhao, M. Zhang, J. Chen, T. Cao, Electrochim. Acta 55 (2010)
5813.
57.Y. Shi, L. Wen, F. Li, H.-M. Cheng, J. Power Sources 196 (2011) 8610. 58.H. Xiang, B. Tian, P. Lian, Z. Li, H. Wang, J. Alloys Compd. 509 (2011) 7205.
59.Q. Zhang, W. Peng, Z. Wang, X. Li, X. Xiong, H. Guo, Z. Wang, F. Wu, Ionics 19 (2013) 717. 60.A.K. Rai, J. Gim, S.-W. Kang, V. Mathew, A. Ly Tuan, J. Kang, J. Song, B.J. Paul, J. Kim, Mater.
Chem. Phys. 136 (2012) 1044.
61.X. Guo, H.F. Xiang, T.P. Zhou, W.H. Li, X.W. Wang, J.X. Zhou, Y. Yu, Electrochim. Acta 109 (2013) 33.
62.Y. Oh, S. Nam, S. Wi, J. Kang, T. Hwang, S. Lee, H.H. Park, J. Cabana, C. Kim, B. Park, J. Mater. Chem. A 2 (2014) 2023.
63.D.A.C. Brownson, D.K. Kampouris, C.E. Banks, J. Power Sources 196 (2011) 4873.
64.Q. Zhang, W. Peng, Z. Wang, X. Li, X. Xiong, H. Guo, Z. Wang, F. Wu, Solid State Ionics 236 (2013) 30.
65.D.R. Dreyer, S. Park, C.W. Bielawski, R.S. Ruoff, Chem. Soc. Rev. 39 (2010) 228.
66.J. X. Zhang, H. Q. Cao, X. L. Tang, W. F. Fan, G. C. Peng, M. Z. Qu, J. Power. Sources, 241 (2013) 619.
67.J.X. Zhang, Z.W. Xie, W. Li, S.Q. Dong, M.Z. Qu, Carbon, 74 (2014) 153. 68.Z.W. Xie, X. Li, W. Li, M.Z. Chen, M.Z. Qu, J. Power. Sources, 273 (2015) 754.
70.Y.B. He, F. Ning, B.H. Li, Q.S. Song, W. Lv, H.D. Du, D.Y. Zhai, F.Y. Su, Q.H. Yang, F.Y. Kang, J. Power. Sources, 202 (2012) 253.
71.H.F. Xiang, B.B. Tian, P.C. Lian, Z. Li, H.H. Wang, J. Alloys Compd. 509 (2011) 7205.