THE APPLICATION OF MULTI-OBJECTIVE ROBUST DESIGN METHODS
IN SHIP DESIGN
Robert Ian Whitfield, Engineering Design Centre, University of Newcastle, England. Bill Hills, Engineering Design Centre, University of Newcastle, England. Graham Coates, Engineering Design Centre, University of Newcastle, England.
Abstract
When designing large complex vessels, the evaluation of a particular design can be both complicated and time consuming. Designers often resort to the use of concept design models enabling both a reduction in complexity and time for evaluation. Various optimisation methods are then typically used to explore the design space facilitating the selection of optimum or near optimum designs. It is now possible to incorporate considerations of seakeeping, stability and costs at the earliest stage in the ship design process. However, to ensure that reliable results are obtained, the models used are generally complex and computationally expensive. Methods have been developed which avoid the necessity to carry out an exhaustive search of the complete design space. One such method is described which is concerned with the application of the theory of Design Of Experiments (DOE) enabling the design space to be efficiently explored. The objective of the DOE stage is to produce response surfaces which can then be used by an optimisation module to search the design space. It is assumed that the concept exploration tool whilst being a simplification of the design problem, is still sufficiently complicated to enable reliable evaluations of a particular design concept. The response surface is used as a representation of the concept exploration tool, and by it’s nature can be used to rapidly evaluate a design concept hence reducing concept exploration time.
While the methodology has a wide applicability in ship design and production, it is illustrated by its application to the design of a catamaran with respect to seakeeping. The paper presents results exploring the design space for the catamaran. A concept is selected which is robust with respect to the Relative Bow Motion (RBM), the heave, pitch and roll at any particular waveheading. The design space is defined by six controllable design parameters; hull length, breadth to draught ratio, distance between demihull centres, coefficient of waterplane, longitudinal centre of floatation, longitudinal centre of buoyancy, and by one noise parameter, the waveheading. A Pareto-optimal set of solutions is obtained using RBM, heave, pitch and roll as criteria. The designer can then select from this set the design which most closely satisfies their requirements. Typical solutions are shown to yield average reductions of over 25% in the objective functions when compared to earlier results obtained using conventional optimisation methods.
1. Introduction
in the models used during the development of the design concept. One result of this approach is that the models are large and the measure of performance is usually multi-criteria.
Such complexity usually meant that when the models were used in concept design studies, they were decomposed and each element of the model optimised and then the sub-optimal solutions were aggregated to produce an overall optimal design.
Clearly such an approach resulted in designs which were generally not the true overall optimum. Recent work in robust design methods, Whitfield [1], and multi-criteria optimisation, particularly the use of Genetic Algorithms (GAs), Todd [2], provide the designer with effective design environments which avoid the necessity to decompose the design model. Such an approach enables practical and realistic models to be used during the earliest stages of the design process.
The following section describes a brief history of the robust design process, extensions to the process and the current state of the art. Section 3 details the key parts of the framework and how they are combined to produce a robust concept exploration tool. A description of the catamaran design problem is given within section 4. Finally the results are illustrated and discussed, and concluded in sections 5 and 6.
2. Background
Japanese industrialists identified that both product quality and the associated manufacturing design processes needed to be significantly improved in order to achieve a more competitive manufacturing industry. Consequently, Genichi Taguchi, a quality consultant, was given the task of developing a methodology to meet these requirements. Robust design methodology was established to improve quality and enable manufacture at low cost by making product and process performance less sensitive to variability in product materials and process environments.
Substantial research has been undertaken to enhance robust design methodology since Taguchi’s work, particularly the statistical techniques used. Taguchi’s methodology involved experimental design and statistical analysis. The approach to experimental design involved a product array which was comprised of a control array and noise array. In an experiment, each combination of the control array was considered with every combination of the noise array. Taguchi assumed that no interactions exist between control factors and hence a large number of control factors could be studied in a small experiment. In addition, Taguchi recommended that noise effects only be tested at two or three settings. Taguchi’s approach to the analysis of experiments involves categorising robust design problems into three distinct groups related to their objectives. These are smaller-the-better, nominal-the better and larger-the-better. The optimal factor settings are identified by maximising the signal to noise (SN) ratios, these being Taguchi’s quality characteristic. Taguchi [3] used main effect plots and analysis of variance tables to determine factor settings that maximise SN ratios.
The experiments are then used by the simulation tools for evaluation. Finally “robust top-level design specifications” were produced from the response surface equations which were verified to demonstrate the suitability of the response surface. Welch et al [5] discuss the use of the combined array as opposed to Taguchi’s product array as well as the use of CCD to reduce the number of experimental runs required to produce the response surface.
Although not strictly addressing the subject of robust design, papers by Engelund et al [6] and Unal et al [7] identify most of the issues arising during robust design and are useful examples of application at the concept design stage. The aim of Engelund’s work was to produce a set of optimal design parameters for a space vehicle. A “baseline” concept for the vehicle was produced as a starting point. A small number of geometry parameters known to have a major influence on the aerodynamic characteristics were selected as design parameters. The objective of the analysis was to optimize the design parameters such that a minimum vehicle dry weight could be achieved whilst maintaining stability throughout several re-entry flight regimes. The optimization process was conducted for several different sets of constraints resulting from different mission profiles. A design was obtained that had a reduction of approximately 9% in the dry weight of the baseline concept whilst being stable throughout all the re-entry flight regimes.
The approach to robust design summarised by Alvarez et al [8] is similar to that described by Chen and Engelund. Initially, the engineer’s judgement was used to establish the input factors and criteria. The authors used the Box-Behnken experimental design method due to the small number of runs enabling the evaluation of a quadratic response surface. Simulations were then undertaken and upon completion, response surfaces were generated using regression analysis to approximate the simulated results. Finally, a range of input factors were identified which met the different criteria conditions simultaneously.
3. Description of Methodology
A product’s robustness is a measure of the variation in its utility experienced in a typical application. That is to say, the lower the sensitivity or variation in utility, the greater the robustness of the design. In this work, we consider robust design to be the process by which a design is produced in which changes in the selected parameters which define the optimum design have relatively little effect on the performance of the design, i.e. the behaviour of the selected design is insensitive to modest changes in the parameters.
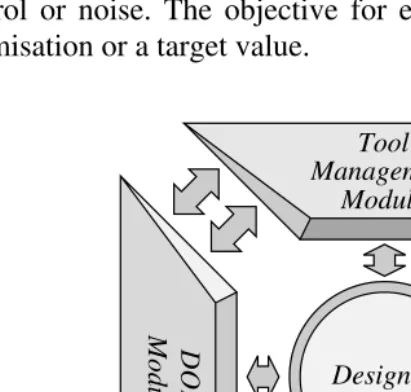
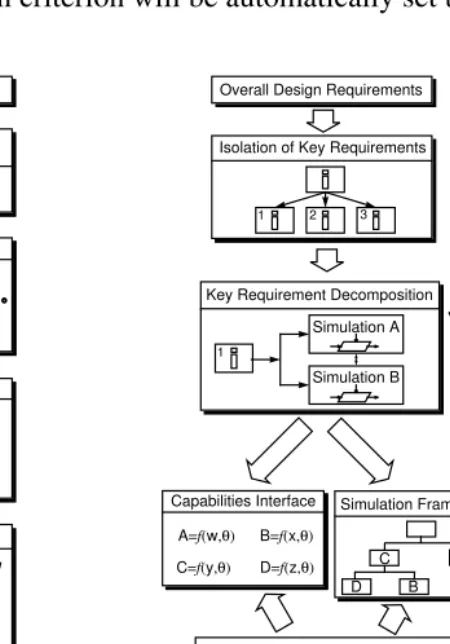
The robustness framework was developed using the philosophy of Taguchi whilst incorporating state-of-the-art statistical techniques. The framework was decomposed into a series of modules which were created to handle particular aspects of the robust design process. The modules are currently combined to produce the framework as a single system, however future work will enable the modules to be used as separate entities. A modular representation of the robustness framework can be seen in Fig. 1, whilst the progression of the robust design process can be seen in Fig. 2a.
a description of what the simulation tool is capable of whilst providing necessary information to the DOE module.
[image:4.792.202.408.202.398.2]Having decomposed the design problem, the designer then uses the DOE module to select the parameters used to define the design space. The design space parameters are defined as being input information to the simulation tools. Similarly, the designer can select any number of criteria which are regarded as being the output information from the simulation tools. The DOE module also enables the selection of the upper and lower bounds of the design space and the determination of the type of each parameter, i.e. control or noise. The objective for each criteria can also be selected as being either minimisation, maximisation or a target value.
Fig. 1. Modular representation of robustness framework.
The DOE module is also responsible for designing the experiment to explore the design space. A point generator is incorporated within the DOE module which is capable of generating full and variable fractional factorial and Central Composite Designs (CCD). The full and fractional factorial designs are available for any order of problem, whereas the CCD is currently designed to be used for second order problems only.
Typically, the first run of the analysis uses a saturated fractional factorial design to provide the designer with an overview of the design problem. With this information factors can be removed from the analysis that are not considered to be significant. This technique relies upon the assumption that the main effects have greater significance than the interaction terms, hence the removal of the factor from the analysis does not have any consequence on the response surface generated. The designer can subsequently study the design problem without having to dramatically increase the size of the experiment. A second order response surface design can then be used with the significant factors to produce a representation of the design concept that has more detail than the first order model.
The DOE module then passes the potential design concepts to the tool management module for evaluation. Design concepts are evaluated sequentially, however research is currently being undertaken exploring methods of integrating the robustness framework with a design coordination system operating in a distributed computing environment to considerably reduce the time taken for concept exploration -see Fig. 2b.
Following the concept exploration stage, the response surface module uses the information obtained from the DOE module to produce a set of normal equations. If a criterion is dependant on a noise
Designer Tool Management
Module
DOE
Module
Response Surface Module
Genetic
parameter the response surface module will produce two measurements for the criterion, one for the mean value, and one for the standard deviation using a similar philosophy as that used by Taguchi. The objective for the standard deviation criterion will be automatically set to minimisation.
Fig. 2a. Robustness framework. Fig. 2b. Design coordination system.
The genetic algorithm module then uses the response surfaces to quickly explore the design space and produce a Pareto-optimal set of solutions. The solutions are represented by a design concept with associated evaluations for the criteria. The designer can then select from the Pareto-optimal set the design that most closely satisfies the overall requirements. This selection process is currently undertaken manually although future developments will enable the selection to be guided by decision making processes.
4. Description of the Design Problem
A case study was selected with which staff in the Department of Marine Technology and the Engineering Design Centre have undertaken considerable work. The problem incorporates a single simulation tool which is capable of giving a number of measurements for the seakeeping of a catamaran.
Simulate y x M Control Factors Noise Factors Responses
Response Surface Methods First order regression
Second order regression
Check ‘Fitness’ of Model Analysis of Means (ANOM) Analysis of Variance (ANOVA)
Select Design Parameters Control Factors Noise Factors Responses and Ranges Robust Design OPTIMISE Multi Criteria Genetic Algorithm Overall Design Requirements
Select Point Generator
Second order First order
y=f(M,x)
Capabilities Interface A=f(w,θ) B=f(x,θ)
C=f(y,θ) D=f(z,θ)
Simulation Framework
A B C D Key Requirement Decomposition
1
Simulation A
Simulation B Overall Design Requirements
Isolation of Key Requirements
1 2 3
Select Design Parameters
Control Factors Noise Factors Responses and Ranges
Select Point Generator
Second order First order
The objective of the work is to explore the design space for the catamaran and select a concept which is most robust with respect to the selected seakeeping quantities for any particular waveheading.
The design space for the catamaran problem was defined by six control parameters and one noise parameter:
Control Parameters (Primary): Hull length L,
Breadth to draft ratio B/T,
Distance between demihull centres Hs,
Control Parameters (Secondary): Longitudinal centre of buoyancy LCB,
Coefficient of waterplane Cwp,
Longitudinal centre of flotation LCF,
Noise Parameter: Waveheading φ.
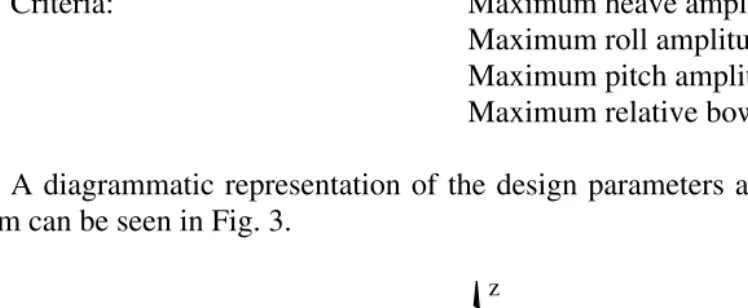
The seakeeping quantities selected here to be minimised are the peak values of the response amplitude operators, RAO, associated with heave, roll, pitch and the relative motion at the bow of each
demihull as a function of all three motion quantities combined relative to the free surface elevation, ,
at the bow located at (x,y).
(1)
Criteria: Maximum heave amplitude,
Maximum roll amplitude, Maximum pitch amplitude,
Maximum relative bow motion, RBM.
[image:6.792.116.490.477.631.2]A diagrammatic representation of the design parameters and criteria for the catamaran design problem can be seen in Fig. 3.
Fig. 3. Design parameters for catamaran.
Given this particular problem, the solution space would have eight dimensions; a mean and a standard deviation component for each of the four criterion, and would subsequently prevent the illustration of the results obtained from the optimisation process.
ζx y,
sr = s3+y s⋅ 4–x s⋅ 5–ζx y,
s3max s4max s5max sr max
Hs
z
x y
L T
B
S4
S3
For illustrative purposes, an example was chosen which demonstrates the application of the methodology with respect to the relative bow motion only. A complete analysis, however, was also undertaken using all of the criteria to illustrate the ranges of designs produced and the trade-offs made during the optimisation process.
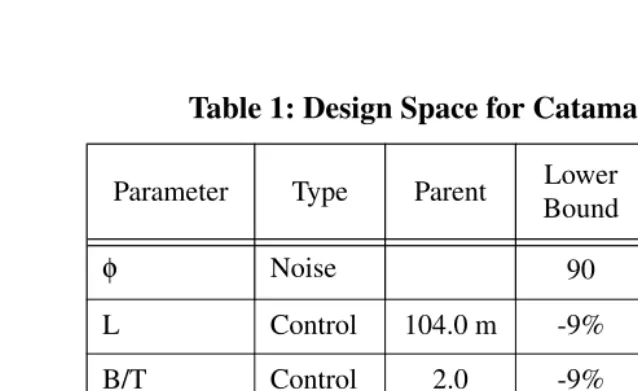
The design space was explored relative to a parent design and was expressed as a percentage change for the primary and secondary design parameters and in absolute terms for the noise parameter
as shown in Table 1. The control parameters were given an offset, rather than having a range of ±10%
and±1%, to eliminate cancellation during solution of the normal equations from having a mid point at
zero.
5. Results and Discussion
The DOE module is capable of selecting a number of different DOE methods to enable the efficient exploration of the design space. In this particular example, the DOE module designed 79 experimental runs to be undertaken using the CCD method to enable the generation of a quadratic response surface.
The tool management module was then requested to execute the design algorithms to evaluate the potential design concepts. The design space as defined by the DOE module was subsequently explored in approximately 10 minutes using a Sun UltraSparc 10 workstation. Coates et al [9] produced a design coordination mechanism which can be integrated within this framework that enables the execution of design activity to be undertaken in a parallel and distributed manner which significantly reduces the time taken to explore the design space.
[image:7.792.148.467.220.416.2]The results from the concept exploration stage were then used by the response surface module to construct the regression equations. A set of normal equations were produced using the method of least squares based upon the information generated from the concept exploration. These normal equations were then solved using Cholesky LU factorisation to produce the following regression equation for the relative bow motion as a function of the seven design parameters.
Table 1: Design Space for Catamaran Problem
Parameter Type Parent Lower
Bound
Mid Point
Upper Bound
φ Noise 90 135 180
L Control 104.0 m -9% +1% +11%
B/T Control 2.0 -9% +1% +11%
Hs Control 31.0 m -9% +1% +11%
LCB Control 45.408 -0.9% +0.1% +1.1%
Cwp Control 0.758 -0.9% +0.1% +1.1%
This regression equation is generated and used automatically within the robustness framework and hence, does not allow the manual removal of any insignificant terms. Future developments within the framework will, however, enable the automatic identification of insignificant regression equation terms and will subsequently prompt the user to enable their removal. The regression equation was used
to produce the response surfaces seen within Fig. 4 for a waveheading of 135°.RBM was plotted against
hull length and breadth to draft ratio for the parentHs, as well asLCFandLCBfor the parentCwp. The
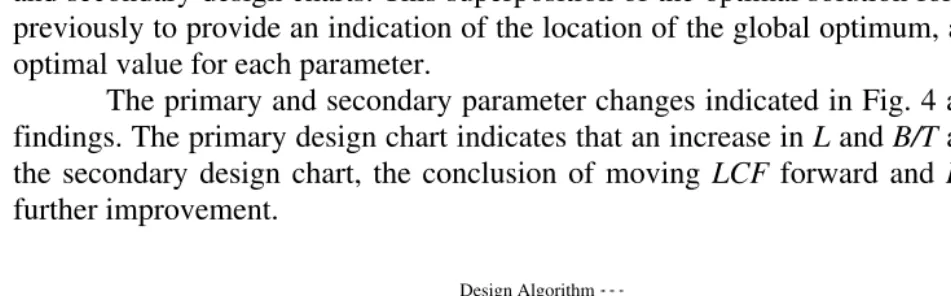
values of RBM are obtained with respect to the parent design, hence increasing negative values indicate increasing desirability. The simulation tool was used to obtain results from the same points for comparison. The designer could manually select an optimal combination of hullform parameters based on the optimal individual combinations of primary and secondary parameters indicated from the primary and secondary design charts. This superposition of the optimal solution for each group has been found previously to provide an indication of the location of the global optimum, although not necessarily the optimal value for each parameter.
The primary and secondary parameter changes indicated in Fig. 4 are consistent with previous
findings. The primary design chart indicates that an increase in LandB/Tare of benefit. Similarly, for
the secondary design chart, the conclusion of moving LCF forward and LCB aft would demonstrate
[image:8.792.68.544.469.616.2]further improvement.
Fig. 4. Primary and secondary design charts.
The GA module conducts an evaluation of the regression equation for a number of different waveheadings and produces estimates for the mean and standard deviation of the relative bow motion. These criteria are then used to guide the GA to facilitate the selection of a Pareto-optimal set of designs. The Pareto-optimal designs can be seen within Fig. 5. For a full description of the GA used within this framework see Todd et al [10].
9.5733x7
– +0.0003x12–0.0107x1x2–0.0073x1x3+0.0005x1x4–0.0051x1x5 Y = 3.6469–0.0786x1+1.1386x2+0.6558x3–0.0876x4+0.5590x5+2.5014x6
0.0283x1x6
– +0.1020x1x7–0.0007x22+0.0025x2x3–0.0002x2x4–0.0361x2x5
0.0094x2x6
– +0.0176x2x7+0.0070x32–0.0006x3x4–0.0165x3x5+0.0018x3x6
0.0175x3x7
– –0.0013x42–0.0041x4x5–0.0077x4x6+0.0013x4x7–0.0814x52
0.0375x5x6
– 0.2128x5x7 0.0273x6
2
0.7284x6x7 0.1844x7 2
+ + + + (2)
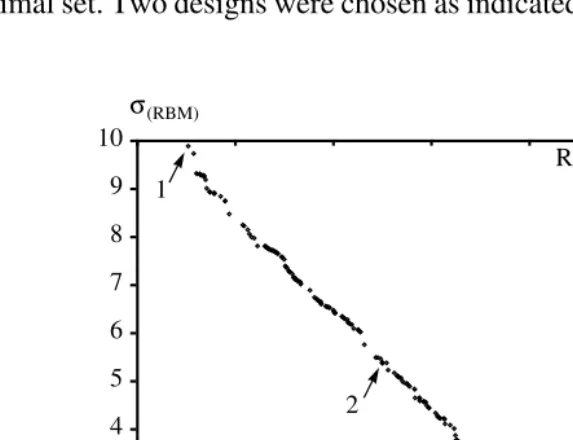
Fig. 5 represents 361 design concepts covering the range of values for the minimisation of both
the mean (µ)and standard deviation (σ)components of the relative bow motion. It represents a range of
designs having a low value of σindicating a relatively flat region of the response surface, to designs
having a highσindicating a spiked region. The designer can subsequently make trade-offs between the
[image:9.792.162.449.187.407.2]designs to suit the characteristics required. Fig. 5 also indicates that the trade-off between the mean and standard deviation is linear. This is discussed by examining a number of different designs from within the Pareto-optimal set. Two designs were chosen as indicated by the points within Fig. 5 and represented in Table 2.
Fig. 5. Variation in mean and standard deviation for Pareto-optimal designs.
The simulation tool was subsequently used to evaluate the two designs with respect to the RBM
by varying the waveheading between 90°and 180°. The results for these two designs can be seen in Fig.
6. The methodology can be seen to achieve average reductions of RBM of 19% for design 1. Fig. 6
indicates that the value for the standard deviation is due to the change ind(RBM)at 90°,having a higher
value than over most of the range of waveheadings for both of the designs. The designs indicated either
a detrimental change, or no change in d(RBM)around 90°.The lack of improvement for waveheadings
approaching 90° is explained by the dominance of the roll component over the vertical component
motions of heave and pitch.
Table 2: Designs selected for analysis.
Design d(L)% d(B/T)% d(Hs)% d(LCB)%L d(Cwp) d(LCF)%L µ(RBM) σ(RBM)
1 10.68 9.52 4.56 1.03aft 1.09 0.89forward -12.96 9.89
2 -0.70 8.38 10.84 0.95aft 1.09 0.88forward -9.00 5.38
0 1 2 3 4 5 6 7 8 9 10
-14 -12 -10 -8 -6 -4 -2 0
Relative Bow Motion
µ(RBM)
σ(RBM)
1
Despite design 2 having a lower standard deviation, suggesting that the design would be on a flatter region of the response surface indicating a greater robustness, it is evident that further reductions ind(RBM) can be obtained by selecting design 1.
[image:10.792.160.455.174.399.2]The advantages of using such a methodology are such that the designer is faced with a set of Pareto-optimal designs which can be used within the selection process when further information is required regarding customer requirements. Trade-offs can subsequently be made within later stages of the design process whilst ensuring that the chosen design has optimal criteria.
Fig. 6. Variation in RBM with waveheading for two Pareto-optimal designs.
Finally, the analysis was repeated using RBM, heave, pitch and roll as the objective functions. The experiments were repeated again using the 79 designs generated using the CCD technique. The design concepts generated were then used to build regression equations for the four objective functions. Future developments will enable the DOE module to store previous design concepts for possible reuse reducing the number of evaluations of the simulation tool and hence reducing the simulation time.
The GA produced a Pareto-optimal set of solutions consisting of 4372 designs having evaluations for the mean and standard deviation components of the RBM, heave, pitch and roll criteria. Future developments will enable the selection of suitable designs from the Pareto-optimal set using Multi-Criteria Decision Making (MCDM) techniques.
A number of interesting designs were selected manually and used for analysis. The values for the parameters for the designs can be seen in Table 3, whilst the results for the mean and standard deviation components of the criteria can be seen in Table 4.
Table 3: Designs selected for analysis.
Design d(L)% d(B/T)% d(Hs)% d(LCB)%L d(Cwp)% d(LCF)%L
3 10.86 9.71 -0.48 0.34aft 0.95 -0.68forward
4 10.85 -6.17 1.95 -0.53forward -0.71 0.04aft
-25 -20 -15 -10 -5 0 5
90 100 110 120 130 140 150 160 170 180 Design 1 Design 2
[image:10.792.72.536.656.727.2]The designs were selected on the basis that design 3 had considerable reductions in the mean values for RBM, heave and pitch, whilst design 4 had a considerable reduction in the mean value for roll. Table 3 suggests that designs having a high reduction in the roll criterion would be in a completely different area of the design space than for designs having high reductions in the other three criteria. This would indicate a trade-off situation which could be resolved by allowing the designer to identify the relative importance of each of the criteria and use an MCDM tool to facilitate the selection of a suitable design.
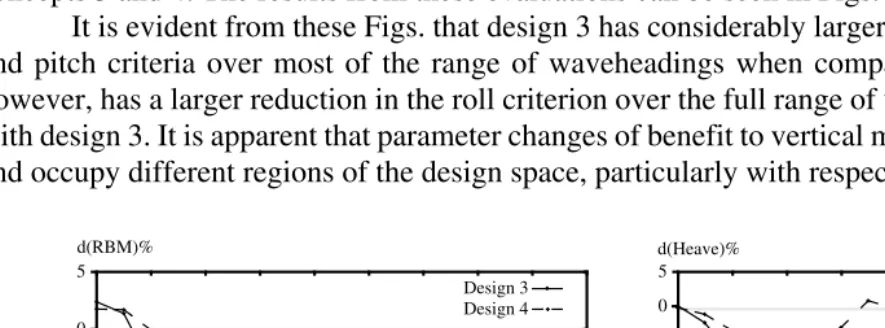
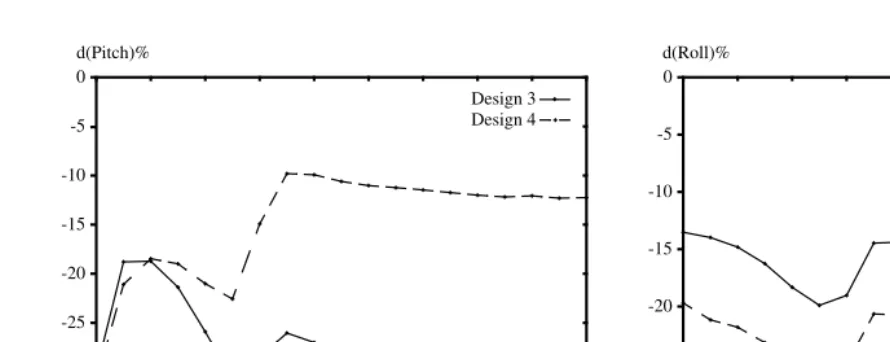
The simulation tool was used to evaluate the RBM, heave, pitch and roll criteria for design concepts 3 and 4. The results from these evaluations can be seen in Figs. 7-10.
It is evident from these Figs. that design 3 has considerably larger reductions in the RBM, heave and pitch criteria over most of the range of waveheadings when compared with design 4. Design 4, however, has a larger reduction in the roll criterion over the full range of waveheadings when compared with design 3. It is apparent that parameter changes of benefit to vertical motions and roll tend to conflict
[image:11.792.106.510.97.172.2]and occupy different regions of the design space, particularly with respect toB/T andCwp.
Fig. 7. Variation in RBM with waveheading. Fig. 8. Variation in heave with waveheading.
The primary and secondary parameter changes suggested to benefit RBM are consistent with
solutions found previously by Sen et al [11] with the exception of theLCBposition indicated. The LCB
parameter was previously found however to be of little significance with respect to the RBM, hence suggesting that it is of little significance with respect to the other criteria - Whitfield et al [1].
Table 4: Criteria for selected designs.
Design µ(RBM) σ(RBM) µ(Heave) σ(Heave) µ(Pitch) σ(Pitch) µ(Roll) σ(Roll)
3 -10.89 9.14 -20.80 18.00 -32.38 0.218 -17.42 0.47
4 -0.29 1.06 -2.59 0.41 -23.72 6.49 -25.25 0.70
-25 -20 -15 -10 -5 0 5
90 100 110 120 130 140 150 160 170 180 -45
-40 -35 -30 -25 -20 -15 -10 -5 0 5
90 100 110 120 130 140 150 160 170 180
Design 3 Design 4 Design 3
Design 4
d(RBM)% d(Heave)%
[image:11.792.86.528.411.575.2]Fig. 9. Variation in pitch with waveheading. Fig. 10. Variation in roll with waveheading.
The results indicate that significant improvements can be found for several motion quantities simultaneously through identifying appropriate combinations of hullform parameters via the approach presented. The results further suggest that these improvements can be obtained in considerably less time than with other optimisation methods. The entire process of concept exploration and optimisation using this methodology took approximately 12 minutes for the single criteria case, and 30 minutes for the multiple criteria case. These times were obtained using a Sun UltraSparc 10 platform. The times compare favourably with the estimated time of approximately 66 hours using conventional methods, i.e. GA guided optimisation using the simulation tool.
6. Conclusions
The approach to robust design described in this paper has been shown to be efficient and effective when applied to a design problem in which the design model is complex and solutions computationally time consuming. Such models are common in the MTO field and further work is currently being undertaken to determine the range of applicability of the proposed robust design methodology.
The methodology has shown to work successfully within this particular problem, however the framework was designed and intended to be used with multiple dependent or independent simulation tools each analysing a particular aspect of the overall design problem. Such an implementation would further test the multiple criteria nature of this framework.
The software environment described in this paper has been developed by staff in the Newcastle Engineering Design Centre. There is comprehensive user documentation which guides the user through the methodology and application.
Acknowledgements
The authors gratefully acknowledge the support given by the Engineering and Physical Sciences Research Council who provided the grant which enabled the work described within this paper to be carried out.
-35 -30 -25 -20 -15 -10 -5 0
90 100 110 120 130 140 150 160 170 180
Design 3 Design 4
-30 -25 -20 -15 -10 -5 0
90 100 110 120 130 140 150 160 170 180
Design 3 Design 4 d(Roll)%
d(Pitch)%
References
[1] Whitfield, R.I., Wright, P.N.H., Coates, G. & Hills, W. (1998) A robust design methodology for
application to one-off products,Journal of Engineering Design, Vol. 9, No. 4, pp. 373-387.
[2] Todd, D.S. & Sen, P. (1997) Multiple criteria scheduling using genetic algorithms in a shipyard
environment,Proceedings ICCAS’97, 9th International Conference on Computer Applications in
Shipbuilding, Yokohama, Japan, October 1997.
[3] Taguch, G. & Wu, Y. (1980) Introduction to Off-Line Quality Control(Nagaya, Japan, Central
Japan Quality Control Association).
[4] Chen, W., Allen, J.K., Mavris, D.N. & Mistree, F. (1996) A concept exploration method for
determining robust top-level specifications,Engineering Optimisation, 26, pp. 137-158.
[5] Welch, W.J., Yu, T.K., Kang, S.M. & Sacks, J. (1990) Computer experiments for quality control
by parameter design,Journal of Quality Technology, 22, pp. 15-22.
[6] Engelund, W.C., Stanley, D.O., Lepsch, R.A., McMillian, M.M. & Unal, R. (1993) Aerodynamic
configuration design using response surface methodology analysis, AIAA Aircraft Design
Systems Meeting, August 1993, Monterey, California, pp. 1-11.
[7] Unal, R. & Stanley, D.O. (1993) Designing for quality using response surface methods,American
Society for Engineering Management 14th Annual Conference, October 1993, Dallas, Texas, pp. 7-11.
[8] Alvarez, A.R., Abdi, B.L., Young, D.L., Weed, H.D., Teplik, J. & Herald, E.R. (1998)
Application of statistical design and response surface methods to computer-aided VLSI device
design, IEEE Transactions on Computer-Aided Design, February 1988, Vol. 7, No. 2, pp.
272-288.
[9] Coates, G., Whitfield, R.I., Duffy, A.H.B. & Hills, W. (1999) A methodology for design
coordination in a distributed computing environment,Proceedings ICED’99, 12th International
Conference on Engineering Design, 24-26 August 1999, Munich, Germany, To be published.
[10] Todd, D.S. & Sen, P. (1997) A multiple criteria genetic algorithm for containership loading,
Proceedings of the Seventh International Conference on Genetic Algorithms, Morgan Kaufmann, ISBN 1-55860-487-1, pp. 674-681.
[11] Sen, P., Rao, Z. & Wright, P.N.H. (1997) Multicriteria robust optimisation of engineering design
systems under uncertainty, Proceedings ICED’97, 11th International Conference on