Gas hold-up and bubble diameters in a gassed oscillatory
ba'ed column
M. S. N. Oliveira, X. Ni
∗Department of Mechanical and Chemical Engineering, Centre for Oscillatory Baed Reactor Applications (COBRA), Heriot-Watt University, Edinburgh EH14 4AS, Scotland, UK
Abstract
In this paper attempts are made to address how bubble behaviour in a batch oscillatory ba'ed column (OBC) contributes to the overall measured enhancement in mass transfer. A CCD camera is used to measure the bubble size distribution and the gas hold-up in the OBC. The experimental results of Sauter mean diameter and gas hold-up are correlated as a function of the power dissipation and super5cial gas velocity, in order to allow for comparisons with published correlations for the mass transfer coe6cient. In general, an increase in the oscillatory velocity causes an increase in the hold-up and a decrease in the Sauter mean diameter. Furthermore, we are able to show that the changes in the gas hold-up contribute more than the mean bubble size to the control of the mass transfer coe6cient.?2001 Elsevier Science Ltd. All rights reserved.
Keywords:Oscillatory ba'ed column; Bubble size distribution; Mean bubble size; Hold-up; Mass transfer
1. Introduction
Gas–liquid contact systems are widely employed in Chemical and Biological processes. Gas-sparged stirred tanks, bubble columns and airlift columns are the most commonly used devices for enhancing gas–liquid mass transfer. The oscillatory ba'ed column (OBC) is a rela-tively new mixing device and has recently been studied in gas–liquid applications (Hewgill, Mackley, Pandit, & Pannu, 1993; Ni, Gao, Cumming, & Pritchard, 1995). The OBC is based on the methodology of superimpos-ing periodic @uid oscillations onto a cylindrical column containing evenly spaced ori5ce ba'es. For batch opera-tions, such a column is usually operated vertically. Fluid oscillation is achieved by means of a piston or bellows at the base of the column, or by moving a set of ba'es up and down the column. The @ow passing the ba'es induces vortices, which provide intensive radial motion within the column. It is the strong radial velocity of sim-ilar magnitude to the axial velocity that gives uniform mixing in each inter-ba'e zone and cumulatively along the length of the column (Brunold, Hunns, Mackley, & Thompson, 1989; Mackley & Ni, 1991, 1993). The @uid
∗Corresponding author. Tel.: 4513781; fax:
+44-131-4513077.
E-mail address:x.ni@hw.ac.uk (X. Ni).
mechanical conditions in a batch OBC are governed by two dimensionless groups, i.e. oscillatory Reynolds (Reo) and Strouhal number (St), de5ned as
Reo=!xoD; (1)
St= D
4xo; (2)
whereDis the column diameter (m),the @uid density (kg m−3); the @uid viscosity (kg m s−1); xothe oscil-lation amplitude (m),!the angular frequency of oscilla-tion (= 2f) andfthe oscillation frequency (Hz). The oscillatory Reynolds number describes the intensity of mixing applied to the column, while the Strouhal number is the ratio of column diameter to stroke length, measur-ing the eGective eddy propagation (Ni & Gough, 1997). Using the quasi-steady approach proposed initially by Jealous & Johnson (1955) the time-averaged power den-sity in an OBC can be estimated by
(P=V)O= 23CN2b D
1−2
2 xo3!3 (W m−3); (3)
whereP=V is the time-averaged power density (W m−3);
Nb the number of ba'es per unit length (m−1); CDthe ori5ce discharge coe6cient (taken as 0.7 for this type of constriction, Perry & Green, 1984), the ba'e free cross-sectional area de5ned as Do=D and Do the ba'e
ori5ce diameter (m). In addition to the external power supplied to the OBC, the speci5c power dissipation due to rising gas bubbles in a gas–liquid system should also be considered. This term was originally suggested by Calderbank, Evans, and Rennie (1960) as
(P=V)B=Ugg (W m−3); (4)
whereUgis the super5cial gas velocity (m s−1) andgis the gravitational constant (m s−2). In gas–liquid systems
the overall time-averaged power density is thus the sum of the two terms:
P=V= (P=V)B+ (P=V)O: (5) The use of pulsation to enhance gas–liquid mass transfer has been reported previously, see for exam-ple, Baird and Garstang (1972), Baird and Rama Rao (1988), but only recently was this type of study ex-tended to an OBC. The overall gas–liquid volumetric mass transfer coe6cient, kLa, in an OBC was found to be six times higher than that in a bubble column (Hewgill et al., 1993) and 75% higher than that in a stirred tank fermenter involving a yeast culture (Ni et al., 1995). However, no attempt was made in these studies to identify which characteristics of the gas phase in the OBC provided such enhancements in the mass transfer rate. In an OBC, bubbles go through continuous breakage and coalescence processes along the column and stay in each ba'ed cell longer due to the motion of vortices as compared with a bub-ble column. We expect that both the bubbub-ble size and bubble mean residence time would contribute to the measured mass transfer enhancement. The mean res-idence time of the bubbles in the OBC can however be assumed to be proportional to the gas hold-up,
G. In this paper we report our experimental stud-ies of bubble size distribution and gas hold-up in an OBC with the view of identifying mass transfer contributions.
2. Experimental facilities and procedure
2.1. Experimental apparatus
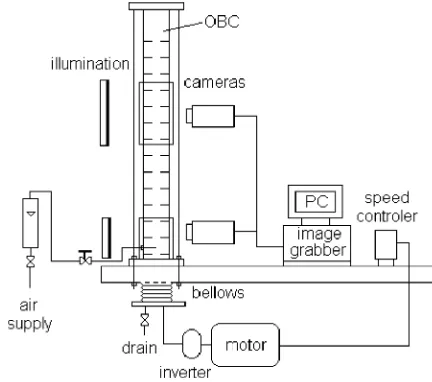
[image:2.595.312.528.69.260.2]A schematic diagram of the apparatus is shown in Fig. 1. The OBC consists of a 50 mm internal diameter and 1:5 m tall Perspex column. The column was @anged vertically onto a metal table and supported by four rods in order to minimise external mechanical vibrations. The column was operated at room temperature with the top open to atmosphere and was 5lled with 2:5 l of tap wa-ter. A set of 14 ori5ce ba'es was used with the ba'es being made of 2 mm thick polyethylene plate and de-signed to 5t closely to the wall of the column. The ba'es were equally spaced at 75 mm apart (1.5 times the tube internal diameter) and supported by four 2 mm diameter
[image:2.595.301.544.322.406.2]Fig. 1. Schematic diagram of the experimental apparatus.
Table 1
Conversion between aeration rate and super5cial gas velocity
Aeration rate Ug
(vvm) (m s−1)
0.05 1:06×10−3
0.1 2:12×10−3
0.13 2:76×10−3
0.2 4:24×10−3
0.3 6:37×10−3
Table 2
Range of operational variables examined
Oscillation Oscillation Aeration rates
amplitude (mm) frequency (Hz) (vvm)
Present study ind32 2;4;8 1;2;3 0:05;0:1;0:2
Present study inG 2;4;8 1;2;3;4;5 0:05;0:1;0:13;0:2;0:3
Ni and Gao (1996) inkLa 4;8;9;12 3;4;5;6;7;8 0;0:25;0:5;0:75;1
2.2. Bubble size distribution and mean bubble size
2.2.1. Procedure
Bubble images were obtained using the CCD cam-era opcam-erated at a shutter speed of 1=3000 s and placed at approximately 0:3 m away from the centre of the column. Back-illumination was provided by @oodlights masked with a semi-transparent paper. The images were acquired using VidPIV 4.0 Rowan and processed using AEQUITAS-IA (version 1.3) image analysis software. By measuring bubbles’ projected area, aproj, the
equiva-lent circular diameters, deq (diameter of a circle having
the same area as the projected area of the bubble), were calculated according to
deq=
4aproj
(m): (6)
The bubble size distribution (BSD) curves are generated by the bubble number fraction vs.deqand the Sauter mean
diameter,d32, can also be calculated via
d32=
(ni·d3eqi)
(ni·d2eqi)
(m); (7)
whereniis the number of bubbles with sizedeqi. Sample
size and repeatability tests were carried out and a mini-mum of 300 bubbles were selected to obtain a represen-tative BSD.
2.3. Gas hold-up
The gas hold-up was measured by recording the changes in the liquid height in the OBC using a CCD camera together with a 5ne scale 5xed on the column. The procedure involves measuring the liquid level, h0,
at the top of the column without the presence of gas and the corresponding level, h, when gas is continuously in-troduced at a given @ow rate. The hold-up is calculated from
G=h−hh0: (8)
3. Bubble size distribution and Sauter mean diameter
The application of oscillatory motion to a ba'ed column induces signi5cant modi5cations in bubble
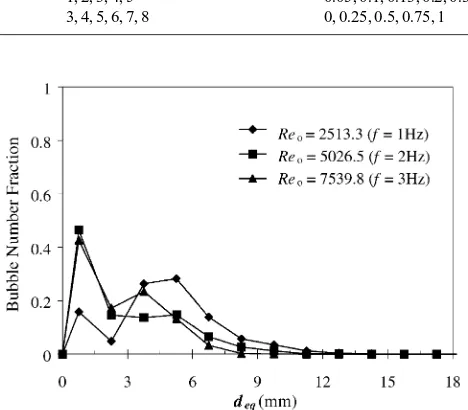
Fig. 2. Bubble size distribution. Ba'es, oscillation (xo= 8 mm),
aeration rate = 0:05 vvm.
trajectories, resulting in a complex liquid–bubble mixing pattern. This pattern is highly aGected by theReo andSt. At low oscillatory Reynolds numbers bubbles are seen to mainly move upwards, but as the level of oscillation is increased bubbles start to move downwards in certain phases of the oscillation cycle, exploring all the regions of the ba'ed-cells. At very intense levels of oscillation, rising bubbles are trapped within each cell for several sec-onds. The @uid oscillation in the presence of ba'es also makes breakage and coalescence of bubbles become reg-ular events in each ba'ed cell. The bubble size distribu-tion pro5les evidencing the frequency eGect are captured in Fig. 2, where the bubble number fraction is de5ned as Number fraction =ni
ni: (9)
The increase in the oscillatory Reynolds number via the oscillation frequency gave narrower BSD and reduced the mean bubble size. This is expected as the increase in the oscillation velocity causes an increase in the power density to the system, subsequently resulting in smaller bubbles.
Fig. 3 shows the eGect of the operating conditions on the Sauter mean bubble diameter, whered32 is plotted as
[image:3.595.307.541.139.344.2]Fig. 3. EGect of oscillatory Reynolds number and aeration rate ond32.
higher aeration rates. The observations are within our ex-pectations since, as the density of bubbles increases with the increase ofUg, more bubble coalescence is expected. For high oscillatory Reynolds numbers, more turbulence prevails within the OBC at increased power dissipation in the system, consequently the mean bubble diameter is signi5cantly reduced. In these cases, the eGect of super5-cial gas velocity is hindered and the oscillation becomes the dominating factor.
From the above discussion, it is clear that both the power density and aeration rate aGect d32. In analogy
to the mass transfer coe6cient, we anticipate that d32
will have a similar power law relationship with the time-averaged power density and the super5cial gas velocity as
d32=kUgm(P=V)n; (10) wherek; mandnare constants. By 5tting thed32results
to the above equation, we have
d32= 0:175Ug0:4(P=V)−0:2 (m): (11) The correlation indicates that on the control of d32 the
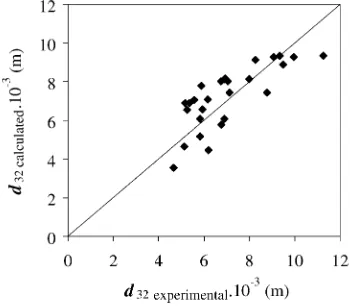
super5cial gas velocity plays a more signi5cant role than the oscillation intensity. Fig. 4 compares the measured Sauter mean diameter values with those predicted using the correlation and the average and maximum relative errors were±15% and±33%, respectively.
4. Gas hold-up
[image:4.595.54.269.67.246.2]The gas hold-up studies were carried out in the pres-ence of both ba'es and oscillation. The measurements of G as a function of the oscillatory Reynolds number are plotted in Fig. 5. There are generally two patterns that can be observed: at low oscillatory Reynolds num-bers the changes in hold-up are very small, but at high
Fig. 4. Comparison of the experimental and the calculatedd32. The line drawn corresponds to thex=yline.
Fig. 5. EGect of oscillatory Reynolds number and aeration rate onG.
oscillatory Reynolds numbers G increases with the in-creased oscillation intensities. For the latter case, the os-cillatory motion causes increased breakage, resulting in more of small and tiny bubbles from the experimental observations, hence longer residence times and higher hold-ups in the column. At a given oscillatory Reynolds number, the gas hold-up again increases with the increase of the aeration rate.
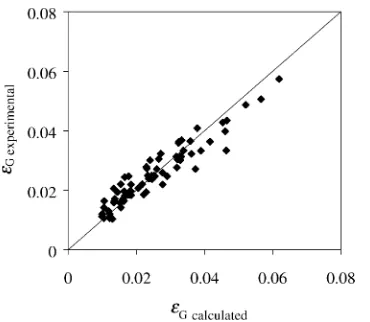
Once again, we assume the similar power law relation-ship betweenG; UgandP=V. By best 5tting the hold-up data, we have
G= 0:1Ug0:4(P=V)0:2: (12)
[image:4.595.336.511.70.223.2] [image:4.595.302.541.281.461.2]Fig. 6. Comparison of the experimental and the calculated gas hold-up. The line drawn corresponds to thex=yline.
5. Mass transfer coe"cient
Having established the correlations ofd32 andGwith the super5cial gas velocity and power density in the OBC, we can now determine the contributions of d32 and G tokLa. To do that, we use, as the starting point, the cor-relation ofkLaproposed by Ni and Gao (1996), as this was obtained using a similar geometric design and gas distributor. The correlation forkLawas reported as
kLa= 0:0256Ug0:37(P=V)0:425 (s−1) (13) for the operating conditions shown in Table 2. It should be noted that the de5nition ofP=V used by Ni and Gao (1996) did not take into account the power due to aer-ation. However, their oscillation ranges were relatively high and under those conditions the power due to the os-cillation was the dominating component. Consequently, the errors between the two power densities are relatively small. Combining Eqs. (11)–(13) together with dimen-sional analysis, we obtain the following:
kLa= 0:284
1:5
G
d0:6
32: (14)
This correlation shows that both bubble size and hold-up contribute to the kLa enhancement, with a sig-ni5cantly larger contribution from the gas hold-up. It is the combination of smaller bubbles with the tortuous routes for bubbles to travel (higherG) that promotes the enhanced mass transfer.
6. Conclusions
In this paper, we have reported our extensive experi-mental measurements of bubble size distributions and gas hold-up in an OBC. The results have led us to identify the individual contribution of the bubble mean diameter and gas hold-up to the overall mass transfer coe6cient. In the OBC, the changes in the gas hold-up play a more
signi5cant role than the changes in the mean diameter but it is the combination of smaller bubbles with longer res-idence times that resulted in the measured mass transfer enhancement.
Notation
aproj bubble projected area, m2
BSD bubble size distribution
CD ori5ce discharge coe6cient
D column diameter, m
Do ba'e ori5ce diameter, m
deq equivalent spherical bubble diameter, m
d32 bubble Sauter mean diameter in the bulk of the
column, m
f oscillatory frequency, Hz g gravitational constant, m s−2
h gas–liquid dispersion level, m
h0 liquid height, m
k constant (Eq. (10))
kLa gas–liquid volumetric mass transfer coe6cient, s−1
m constant (Eq. (10))
n constant (Eq. (10))
Nb number of ba'es per unit length OBC oscillatory ba'ed column
P=V time averaged power density, W m−3
Reo oscillatory Reynolds number
St Strouhal number
Ug super5cial gas velocity, m s−1
vvm volume of air per volume of liquid per minute
xo centre-to-peak amplitude of oscillation, m
Greek letters
ba'e free cross-sectional area
G gas hold-up
@uid viscosity, Pa s
liquid density, kg m−3
! radial frequency, rad s−1
References
Baird, M. H. I., & Garstang, J. H. (1972). Gas absorption in a pulsed bubble column.Chemical Engineering Science,27, 823–833. Baird, M. H. I., & Rama Rao, N. V. (1988). Characteristics of a
countercurrent reciprocating plate bubble column. II. Axial mixing and mass transfer.Canadian Journal of Chemical Engineering, 66, 222–231.
Brunold, C. R., Hunns, J. C. B., Mackley, M. R., & Thompson, J. W. (1989). Experimental observations on @ow patterns and energy losses for oscillatory @ow in ducts containing sharp edges. Chemical Engineering Science,44, 1227–1244.
Hewgill, M. R., Mackley, M. R., Pandit, A. B., & Pannu, S. S. (1993). Enhancement of gas–liquid mass transfer using oscillatory @ow in a ba'ed tube.Chemical Engineering Science,48, 799–809. Jealous, A. C., & Johnson, H. F. (1955). Power requirements for
pulse generation in pulse columns. Industrial and Engineering Chemistry,47(6), 1159–1166.
Mackley, M. R., & Ni, X. (1991). Mixing and dispersion in a ba'ed tube for steady laminar and pulsatile @ow.Chemical Engineering Science,46, 3139–3151.
Mackley, M. R., & Ni, X. (1993). Experimental @uid dispersion measurements in periodic ba'ed tube arrays. Chemical Engineering Science,48, 3293–3305.
Ni, X., & Gao, S. (1996). Scale-up correlation for mass transfer coe6cients in pulsed ba'ed reactors. Chemical Engineering Journal,63, 157–166.
Ni, X., & Gough, P. (1997). On the discussion of the dimensionless groups governing oscillatory @ow in a ba'ed tube. Chemical Engineering Science,52, 3209–3212.
Ni, X., Gao, S., Cumming, R. H., & Pritchard, D. W. (1995). A comparative study of mass transfer in yeast for a batch pulsed ba'ed bioreactor and a stirred tank fermenter.Chemical Engineering Science,50, 2127–2136.