Int. J. Electrochem. Sci., 12 (2017) 3782 – 3794, doi: 10.20964/2017.05.29
International Journal of
ELECTROCHEMICAL
SCIENCE
www.electrochemsci.orgA Method for Improving the Electrochemical Properties of a
Li
1.2Ni
0.15Co
0.1Mn
0.55O
2Cathode Material
Ying-jie Zhang1, Zhe-zhong Shi1, Hong-ren Mao1, Zhen-ping Qiu1, Cheng-yun Yang2, Hai-bo Luo2, Peng Dong1,*
1
National and Local Joint Engineering Laboratory for Lithium-ion Batteries and Materials Preparation Technology, Key Laboratory of Advanced Battery Materials of Yunnan Province, Faculty of Materials Science and Engineering, Kunming University of Science and Technology, Kunming 650093, China.
2
Yunnan Energy Investment Heolo Technology Co., Ltd, Yuxi 653103, China.
*
E-mail: [email protected]
Received: 18 January 2017 / Accepted: 10 March 2017 / Published: 12 April 2017
A method for improving the electrochemical properties of Li1.2Ni0.15Co0.1Mn0.55O2 is described in this
paper. The improvement of the electrochemical properties of Li1.2Ni0.15Co0.1Mn0.55O2 was achieved by
introducing small amounts of H2O molecules. The modification was carried out by using a method of
water quenching and tempering at a proper temperature. A remarkable specific capacity of 283.8 mAh g-1 (0.2 C) was achieved. The high specific capacity and cycling ability is assigned to the change of lattice parameters by the inserted H2O molecules, leading to the increased mobility and enhanced
distribution of Li+ ions in the Li1.2Ni0.15Co0.1Mn0.55O2 layers.
Keywords: Li1.2Ni0.15Co0.1Mn0.55O2; water quenching; tempering temperatures; H2O compounds;
lattice parameters
1. INTRODUCTION
improving the energy density of cathode materials is the key to enhancing the energy density of lithium ion batteries. At present, conventional cathode materials mainly include layered NCM ternary materials (LiNi1/3Co1/3Mn1/3O2 and LiNi0.5Co0.2Mn0.3O2) [3], olivine lithium iron phosphate (LiFePO4)
[4], and spinel lithium manganate (LiMn2O4) [5]. Due to their low specific capacity (< 200 mAh g-1), it
is hard to satisfy the demands of constructing lithium ion battery system with a high specific energy for cathode materials. Li-rich Mn-based cathode materials have the highest possibility to become a 300 Wh kg-1 high-energy and high-density cathode material for lithium ion batteries because their discharge capacity reaches 250 mAh g-1. Additionally, relative to other cathode materials, low Co contents give these materials advantages in terms of cost and environmental friendliness.
Generally, layered Li-rich Mn-based cathode materials (xLi2MnO3∙(1-x)LiMO2) include
Li2MnO3 and LiMO2 [6]. In the first charging process, when the charging voltage reaches 4.5 V,
Li2MnO3 is activated. In the reaction, some oxygen ions break away from the lattice. During
discharging, the vacancy for embedding Li+ ions is reduced, so the initial coulombic efficiency is lower [7]. In addition, the rate capability of these materials is relatively weak. At present, the primary methods of improving the cathode materials of the lithium-rich solid solution include phase mixtures [8, 9], surface modifications [10-12] and improved synthetic methods [13, 14]. In addition, the literature reports that the process of rapid cooling can acquire smaller grains and reduce migration resistances of Li+ ions [15, 16], which improve the electrochemical performance of lithium-rich cathode materials. Thus, with a sol-gel method and rapid cooling with water quenching, a Li1.2Ni0.15Co0.1Mn0.55O2 cathode material was synthesized. Moreover, the influences of different
tempering temperatures on the electrochemical performance of the samples were explored.
2. EXPERIMENT
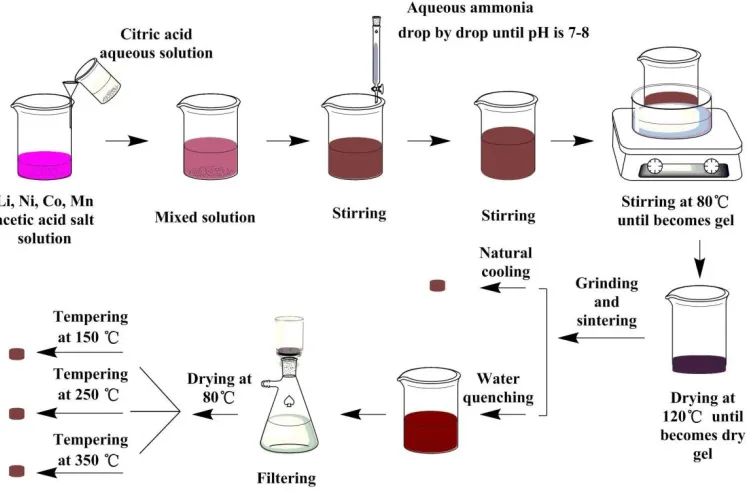
Li1.2Ni0.15Co0.1Mn0.55O2 powders were synthesized according to a sol-gel method, as shown in
Figure 1. Lithium acetate, manganese acetate, cobalt acetate, and nickel acetate were dissolved in 300 ml of deionized water to obtain solution A, and citric acid was dissolved into 100 ml of deionized water to obtain solution B. Solution B was added to solution A with continuous stirring, and ammonium hydroxide was used to adjust the pH of solution C (the mixture of solution A and B) to 7-8. Then, solution C was stirred at a constant temperature of 80 °C until it turned into a sol state. Finally, the sol was put into a drying cabinet at a temperature of 120 °C for 24 h to obtain a dry gel. After grinding, the dry gel was put into a muffle furnace, which was warmed to 500 °C for 5 h after preheating with a heating rate of 4 °C min-1. After the furnace cooled to room temperature, the sample was taken out, ground, put into the muffle furnace again, and calcined by warmed to 850 °C with a heating rate of 4 °C min-1 for 15 h. After calcining, the broiling powders were poured into deionized water promptly, and the filtered deionized water dissolved the powders to obtain the sample. The resulting sample was dried at 80 °C and subsequently tempered at different temperatures. The Li1.2Ni0.15Co0.1Mn0.55O2 fabricated by furnace cooling is indicated as sample a; the sample fabricated
[image:3.596.113.486.124.370.2]
indicated as sample d; the sample fabricated by water quenching and tempered at 350 °C is indicated as sample e.
Figure 1. Flow diagram of the synthesis procedure the Li1.2Ni0.15Co0.1Mn0.55O2 powders
The sample (active material), acetylene black and poly (tetrafluoroethylene) binder in a mass ratio of 8:1:1 were mixed in N-methyl pyrrolidone (NMP) to form a slurry. In addition, the slurry was smeared onto aluminum foil, put into a vacuum oven for 10 h at a temperature of 80 °C and then rolled into an active plate. A lithium metal plate was used as the negative pole, and a Celgard 2400 porous polyethylene film was used as the separator. A solution of 1 mol L-1 LiPF6 dissolved in EC, DC, and
DMC (EC:DEC:DMC = 1:1:1 volume ratio) was used as the electrolyte. The CR2016 button cells were assembled in an argon-filled glove box. A LAND Battery Tester was used to perform constant current charge-discharge performance test on the cells. An Autolab electrochemical workstation (PGSTAT-302n, Netherlands) was used to conduct cyclic voltammetry tests on the cells. Cu Kα radiation on a Mini600-XRD (Rigaku, Japan) instrument was used to determine the structure of the synthesized powders, andthe diffraction data were collected at 4° min-1 over a 2θ range from 10° to 80°. A VEGA3 SEM (Tescan, Czech Republic) was used to observe the surface morphology of the samples. A Master size 3000 (Malvern, England) was used to survey the particle size. The grain sizes were expressed as D10, D50, and D90. They correspond to the maximum diameter of 10 %, 50 % and 90 % of the total samples (i.e., 50 % of the particles smaller than D50).
3. RESULTS AND DISCUSSION
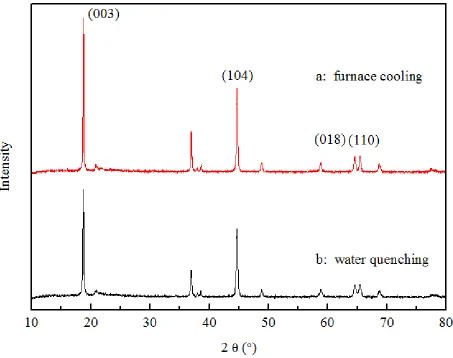
The XRD patterns of the Li1.2Ni0.15Co0.1Mn0.55O2 cathode materials synthesized under different
to the R-3m space group. It can be observed from Figure 2 that the two samples have distinct splitting of the (018)/(110) peaks, indicating that the synthesized materials have a good layered structure [17]. The main difference between the two samples lies in the full width at half maximum (FWHM). The FWHM of sample a is smaller than sample b (see Table 1), indicating that the crystallinity of sample a from furnace cooling is higher than that of sample b from water quenching. The abovementioned XRD results show that quenching by the sudden cooling treatment prevents grain growth in the samples, and therefore, this method provided a Li1.2Ni0.15Co0.1Mn0.55O2 cathode material with lower crystallinity.
Figure 2. The XRD patterns of the Li1.2Ni0.15Co0.1Mn0.55O2 cathode materials synthesized under
different cooling conditions: (a) Li1.2Ni0.15Co0.1Mn0.55O2 fabricated by furnace cooling; (b)
Li1.2Ni0.15Co0.1Mn0.55O2 fabricated by water quenching.
The morphologies of the Li1.2Ni0.15Co0.1Mn0.55O2 cathode materials synthesized under different
[image:4.596.77.530.220.578.2]
corresponding to 72.8 nm and 95.8 nm, respectively. The variations of D10 and D90 shown in Table 2 also have the same trend. The D10 and D90 of sample b is smaller than sample a.
Figure 3. The morphologies of the Li1.2Ni0.15Co0.1Mn0.55O2 cathode materials synthesized under
different cooling conditions: (a) Li1.2Ni0.15Co0.1Mn0.55O2 fabricated by furnace cooling; (b)
[image:5.596.114.482.127.343.2]Li1.2Ni0.15Co0.1Mn0.55O2 fabricated by water quenching.
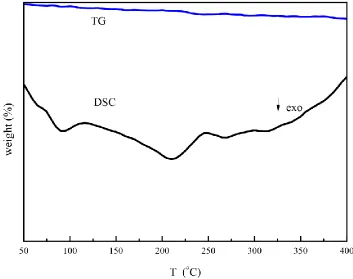
Figure 4. TGA and DSC analyses of the Li1.2Ni0.15Co0.1Mn0.55O2 cathode materials fabricated by water
[image:5.596.138.491.441.720.2]
The TG-DSC curve of the Li1.2Ni0.15Co0.1Mn0.55O2 cathode materials synthesized by water
quenching is shown in Figure 4. It can be observed from the TG curve that, for materials synthesized by water quenching, the quality is obviously reduced before 350 °C, but the quality has no change after 350 °C. However, the turning point is not obvious. It can be observed from the DSC curve that there are three prominent exothermic peaks at 89 °C, 219 °C, and 274 °C. The exothermic peak at 89 °C corresponds to water evaporation in the materials, indicating that the materials after water quenching fail to dry out fully after high-temperature drying at 80 °C. The exothermic peaks at 219 °C and 270 °C correspond to water release in the crystals of the materials, indicating that water quenching can insert hydrogen into the crystal structures of materials in the form of crystalline water.
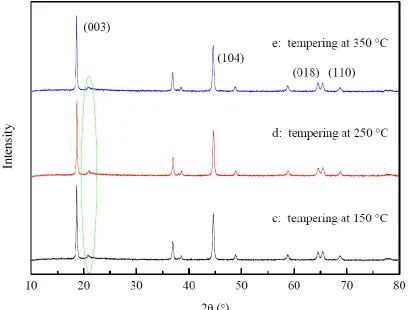
The X-ray diffraction of the Li1.2Ni0.15Co0.1Mn0.55O2 material synthesized by the water
quenching method and the materials obtained after tempering at different temperatures are shown in Figure 5. In the figure, samples c, d, and e represent the X-ray diffraction patterns of the materials obtained via tempering at temperatures of 150 °C, 250 °C, and 350 °C, respectively. It can be seen from Figure 5 that all of the materials have typical α-Na2FeO2 structures that belong to the R-3m space
group. All three of the samples have distinct splitting in the (018)/(110) peaks, indicating that the synthesized samples have a good layered structure [17]. The 20°-25° diffraction peak is produced by the superlattice structure of Li2MnO3 [18]. Apparently, the overall structure of the material is
significantly improved after the tempering treatment. The FWHM of the samples indicates that the crystallinity of the materials is enhanced after reheating the materials after the water quenching treatment (see Table 1).
[image:6.596.104.515.417.727.2]
According to the literature, the unit cell parameters, c/a value, and I(003)/I(104) value in the XRD spectrum can reflect the ordering of the layered structure of the material [19-21]. The lattice parameters shown in Table 1 were carried out by Rietveld refinements using the space group R-3m. It can be concluded that the lattice parameter c of powder b is larger than powder a, corresponding to c=14.20935 Å and c=14.12843 Å, respectively. It can also be concluded that the powders tempered at 150 °C and 250 °C still preserve a larger lattice parameter c, and tempering the powders at 350 °C leads to a smaller c value that is similar to powder a. When the c/a value is greater than 4.9, the material has a more stable layered structure. The diffraction peak intensity ratio I(003)/I(104) is related to the Li+ and Ni2+ mixing degree of the Li1.2Ni0.15Co0.1Mn0.55O2 cathode material. When I(003)/I(104)
is greater than 1.2, the Li+ and Ni2+ mixing level is relatively low. A higher I(003)/I(104) results in a lower mixing degree for Li+ and Ni2+ in the material. The lattice constants, c/a values and I(003)/I(104) of samples a, b, c, d, and e are listed in Table 1. Compared with other samples, sample d has the largest c/a and I(003)/I(104) values, indicating that the Li1.2Ni0.15Co0.1Mn0.55O2 cathode material has the best
[image:7.596.51.550.364.553.2]layered structure ordering after tempering at 250 °C.
Table 1. Lattice parameters of powders synthesized with different treatment
Sample Treatment conditions Lattice parameters
a (Å) c (Å) c/a FWHM I(003)/I(104)
a Furnace cooling 2.85159 14.12843 4.954579 0.166 1.490
b Water quenching 2.84925 14.20935 4.98704 0.222 1.430
c Tempering at 150 °C 2.85505 14.19542 4.9720 0.207 1.457 d Tempering at 250 °C 2.85432 14.21451 4.97999 0.210 1.488 e Tempering at 350 °C 2.84865 14.13759 4.96291 0.209 1.459
[image:8.596.115.485.90.230.2]
Figure 6. Effect of the tempering temperature on the micrographs of the water-quenched Li1.2Ni0.15Co0.1Mn0.55O2:(c) 150 °C, (d) 250 °C, (e) 350 °C
Table 2. Particle sizes of the powders synthesized from different treatment conditions
Name Treatment conditions Particle size (nm)
D10 D50 D90
a Furnace cooling 20.2 95.8 30200
b Water quenching 19.4 72.8 20700
c Tempering at 150 °C 19.4 72.3 21400
d Tempering at 250 °C 19.5 74.4 22900
e Tempering at 350 °C 20.8 125 32500
[image:8.596.83.512.335.538.2]
some removal of Li2O. This is the main reason for the material having a higher first discharge capacity
[22]. On the other hand, because O2- is removed during the first discharge process, the reverse cannot occur during the charging process. This leads to Li+ occupying an octahedron vacancy when it becomes embedded and thus results in a lower first coulombic efficiency [22, 23]. In the process of initial charging and discharging, the coulombic efficiency of samples a-e were 75.47 %, 74.01 %, 75.39 %, 77.79 %, and 76.20 %. Sample d had the highest coulombic efficiency, and sample b had the lowest coulombic efficiency. Although the difference seems to be small, the influence of the amount of water on the performance in terms of coulombic efficiency cannot be ignored.
Figure 7. The initial charge-discharge (0.2 C) curves of the Li1.2Ni0.15Co0.1Mn0.55O2 cathode material
synthesized under different conditions: (a) fabricated by furnace cooling, (b) fabricated by water quenching, (c) fabricated by water quenching and tempering at 150 °C, (d) fabricated by water quenching and tempering at 250 °C, and (e) fabricated by water quenching and tempering at 350 °C
[image:9.596.132.499.230.516.2][image:10.596.69.536.143.497.2]
cycle performance as high as 87.6 % after 30 cycles. Therefore, a less amount of crystalline water can not only increase the discharge capacity of the material but also improve the performance of the cycling of the material.
Figure 8. The cycle curves (0.2 C) of the Li1.2Ni0.15Co0.1Mn0.55O2 cathode materials synthesized under
different conditions: (a) fabricated by furnace cooling, (b) fabricated by water quenching, (c) fabricated by water quenching and tempering at 150 °C, (d) fabricated by water quenching and tempering at 250 °C, and (e) fabricated by water quenching and tempering at 350 °C.
Figure 9. The rate capacities of the Li1.2Ni0.15Co0.1Mn0.55O2 cathode materials synthesized under
different conditions: (a) fabricated by furnace cooling, (b) fabricated by water quenching, (c) fabricated by water quenching and tempering at 150 °C, (d) fabricated by water quenching and tempering at 250 °C, and (e) fabricated by water quenching and tempering at 350 °C
Figure 10 shows the cyclic voltammogram (CV) curves of these samples with a scanning speed of 0.2 mV s-1 and voltage from 2 V to 4.8 V. Figure 10 (A) and (B) show the CV curves of samples a-e in the first cycle. We can see from this figure that two oxidation peaks centered at 4.2 V and 4.7 V occur. The oxidation peak at 4.2 V corresponds to the oxidation reaction of the transition metal ion, while the one at 4.7 V corresponds to the loss of oxygen from Li2MnO3.
[image:11.596.61.544.76.436.2]
sharpness of the oxidation peaks of samples c, d and e also change. Tempering with a temperature of 250 °C resulted in a synthetic material that had the sharpest reductive peak among the water-quenched materials. A conclusion can be given that the crystalline water reduces impediment in the transportation of Li+ ions.
2.0 2.5 3.0 3.5 4.0 4.5 5.0 -0.0005
0.0000 0.0005 0.0010
c: tempering at 150 C d: tempering at 250 C e: tempering at 350 C
Voltage (V) C u rr e n t (A )
2.0 2.5 3.0 3.5 4.0 4.5 5.0 -0.0005
0.0000 0.0005 0.0010
d: tempering at 250 C
Potential (V) C u rr e n t (A ) 1st 2nd 3nd
C
2.0 2.5 3.0 3.5 4.0 4.5 5.0 -0.0005
0.0000 0.0005 0.0010
a: furnace cooling b: water quenching
Voltage (V) C u rr e n t (A )
B
A
Figure 10. Typical CV curves of the Li1.2Ni0.15Co0.1Mn0.55O2 cathode materials tempered at different
temperatures: (A) CV curves of samples a and b in the first cycle; (B) CV curves of samples c-e in thc-e first cyclc-e [(c) 150 °C, (d) 250 °C, and (c-e) 350 °C]; (C) CV curvc-es of samplc-e d in thc-e first three cycles.
4. CONCLUSIONS
A Li1.2Ni0.15Co0.1Mn0.55O2 cathode material, which was treated by high-temperature sintering,
was placed into water to cool rapidly. This resulted in water molecules inserting into the lattice structure of the Li1.2Ni0.15Co0.1Mn0.55O2 cathode material. Water molecules were removed when the
water-quenched material was tempered at temperatures over 350 °C. Compared to Li1.2Ni0.15Co0.1Mn0.55O2 produced by tempering at different temperatures, the cathode material
[image:12.596.77.531.178.519.2]
gave it the best discharge capacity and circulation performance. This means that less crystalline water can enlarge the gap between layers of the Li1.2Ni0.15Co0.1Mn0.55O2 cathode material and increase the
mobility of Li+ ions between layers to improve the electrochemical properties of the material. ACKNOWLEDGEMENTS
This paper was finished by Project supported by the National Natural Science Foundation of China (Grant No. 51364021) and project supported by the Natural Science Foundation of Yunnan Province (2014FA025).
References
1. H. Yu And H. Zhou, J Phys Chem Lett, 4 (2013) 1268. 2. M. Armand And J. M. Tarascon, Nature, 451 (2008) 652. 3. T. Ohzuku And Y. Makimura, Chem Lett , 1 (2001) 642.
4. A. K. Padhi, J. B. Goodenough And K. S. Nanjundaswamy, J Electrochem Soc, 144 (1997) 1188. 5. W. Liu, G. C. Farrington, F. Chaput And B. Dunn, J Electrochem Soc, 27 (1996) 879.
6. C. S. Johnson, J. S. Kim, C. Lefief, N. Li, J. T. Vaughey And M. M. Thackeray, Electrochem Commun, 6 (2004) 1085.
7. C. S. Johnson, N. Li, C. Lefief And M. M. Thackeray, Electrochem Commun, 9 (2007) 787. 8. L. F. Jiao, M. Zhang, H. T. Yuan, M. Zhao, J. Guo And W. Wang, J Power Sources, 167 (2007)
178.
9. Z. W. Fu, Y. Wang, X. L. Yue And Q. Z. Qin, J Phys Chem B, 108 (2012) 2236.
10. S. T. Myung, K. Izumi, S. Komaba, H. Yashiro, H. J. Bang, Y. K. Sun And N. J. Kumagai, J Phys Chem C, 111 (2007) 4061.
11. S. H. Lee, B. K. Koo, J. C. Kim And K. M. Kim, J Power Sources, 184 (2008) 276. 12. Q. Y. Wang, J. Liu, A. V. Murugan And A. Manthiram, J Mater Chem ,19 (2009) 4965.
13. D. K. Lee, S. H. Park, K. Amine, H. J. Bang, J. Parakash And Y. K. Sun, J Power Sources, 162 (2006) 1346.
14. H. Y. Xu, Q. Y. Wang And C. H. Chen, J Solid State Electr, 12 (2008) 1173. 15. S. S. Shin, Y. K. Sun And K. Amine, J Power Sources, 112 (2002) 634.
16. Q. Y. Wang, J. Liu, A. V. Murugan And A. Manthiram, J Mater Chem, 19 (2009) 4965. 17. T. Ohzuku, J Electrochem Soc, 140 (1993) 1862.
18. A. Boulineau, L. Croguennec, C. Delmas And F. Weill, Solid State Ionics, 180 (2010) 1652. 19. S. Sivaprakash, S. B. Majumder, S. Nieto And R. S. Katiyar, J Power Sources, 170 (2007) 433. 20. J. M. Zheng, X. B. Wu And Y. Yang, Electrochim Acta, 56 (2011) 3071.
21. X. J. Guo, Y. X. Li, M. Zheng, J. M. Zheng, J. Li, Z. L Gong And Y. Yong, J Power Sources, 184 (2008). 414.
22. C. S. Johnson, N. Li, C. Lefief And M. M. Thackeray, Electrochem Commun, 9 (2007) 787. 23. K. Du,X. Huang,F. Yang,G. Hu And Z. Peng, Chinese J Inorg Chem, 28 (2012) 983. 24. W. He, J. Qian, Y. Cao, X. Ai And H. Yang, Rsc Adv, 2 (2012) 3423.


![Figure 10. Typical CV curves of the Li1.2Ni0.15Co0.1Mn0.55O2 cathode materials tempered at different temperatures: (A) CV curves of samples a and b in the first cycle; (B) CV curves of samples c-e in the first cycle [(c) 150 °C, (d) 250 °C, and (e) 350 °C]](https://thumb-us.123doks.com/thumbv2/123dok_us/1810236.136256/12.596.77.531.178.519/figure-typical-cathode-materials-tempered-different-temperatures-samples.webp)