Int. J. Electrochem. Sci., 12 (2017) 7977 – 7988, doi: 10.20964/2017.09.24
International Journal of
ELECTROCHEMICAL
SCIENCE
www.electrochemsci.org
Studies of Zn-poly(aniline-co-5-aminosalicylic acid) Aqueous
Battery with Graphite Paper Current Collector
Zhuan Hu, Jinqing Kan*
School of Chemistry and Chemical Engineering, Yangzhou University, Yangzhou, 225002, China *
E-mail: jqkan@yzu.edu.cnrent collector
Received: 31 April 2017 / Accepted: 2 July 2017 / Published: 13 August 2017
Zn- PANI aqueous electrolyte secondary batteries have many advantages, such as low price and free of pollution, but some shortcomings still exist, for example, over-charge electrochemical degradation of the PANI, Zn passivation and Zn dendrite, especially current collector of PANI electrode is corroded easily. So far, how to overcome the many inherent questions of Zn- PANI secondary batteries is still a hot topic. Herein, an efficient strategy is proposed by increasing the electroactivity of current collector by potentiostatic deposition of poly (aniline-co-5-aminosalicylic acid) (PAASA) on graphite paper (PG, an excellent corrosion-resistant, low-cost, good conductivity, soft, elastic and light material) for collecting current. To study the electroactivity of the PAASA, cyclic voltammograms and electrochemical impedance spectra of PAASA cathode and Zn anode are measured in aqueous solution containing NH4Cl and ZnCl2. The electrochemical performances show that the specific capacity of the Zn-PAASA aqueous battery is 145 mAh g-1, which is far beyond that conventional Zn-PANI aqueous batteries under the same conditions, and retains 95 mAh g-1 of the capacity after 150 cycles. Thus, the Zn-PAASA secondary batteries may become the next generation of high-performance battery by further research.
Keywords: Poly (aniline-co-5-aminosalicylic acid); Zinc; aqueous secondary battery; Graphite paper; Current collector
1. INTRODUCTION
Compared with the conventional batteries, the Zn-PANI secondary batteries have shown many excellent characteristics, such as high reversible energy density (50-100Wh kg-1) and coulombic efficiency (70-100%), long cycle life and low self-discharge rate [9-11]. However, zinc is easily corroded in acidic aqueous electrolytes (pH≤4), while polyaniline has low electrochemical activity and low conductivity at pH > 4,the current collector of PANI electrode is especially a difficult problem to solve, which limits the commercialization of the aqueous secondary batteries [12,13].
Synthesizing new types of the aniline-based copolymers has attracted researchers’ interest recently. The copolymerization of aniline and other monomers (such as -SO3H, -OH, -COOH) have been widely used for improving the performance of PANI [14-15]. Mu [16] confirmed that poly (aniline-co-5-aminosalicylic acid) (PAASA) has excellent redox activity from pH 1.0 to 12.0. The copolymerization of aniline and other monomers provides a possibility to obtain a new PANI type of copolymer. A new copolymer not only retains the excellent performances of PANI itself, but also has new properties [17, 18].
According to the characteristics of the aqueous conductive polymer batteries, the platinum, gold and carbon materials can be used as current collectors [19, 20]. Platinum and gold are not suitable for commercial application duo to the expensive price and the lack of resources. It is reported that graphite plate is used as the current collectors of aqueous polymer battery. However, this is also not suitable for commercial applications owing to the brittleness of the graphite plate and its higher weight ratio in the battery [21]. This paper mainly describes the electrochemical performance of PAASA, Zn and Zn-PAASA aqueous secondary batteries by using graphite paper (PG) as the current collectors in the aqueous electrolyte of ZnCl2 and NH4Cl. We believe this will be an excellent solution of various conducting polymer current collectors due to a corrosion-resistant, low-cost, good conductivity, soft, elastic and light material of GP.
2. EXPERIMENTAL
2.1 Materials
Aniline (Shanghai Chem. Co.) was distilled under reduced pressure and stored in a refrigerator before use. Zinc chloride, ammonium chloride, sodium hydroxide, hydrochloric acid, 5-Aminosalicylic acid (ASA) and zinc sheet were obtained from Shanghai Chem. Co.. All of the chemicals used were analytic grade. The double distilled water was used for the preparation of the electrolytes.
2.2. Preparation of PAASA and PANI
aniline, 1.2 M HCl under the same experimental conditions. The films of PAASA and PANI were washed with double distilled water, respectively. They were dried under vacuum at 70 0C for 12 h.
2.3 Preparation of the battery
[image:3.596.156.442.289.417.2]The positive electrode was a thick PAASA or PANI film of 38.3 mg polymerized on a PG (0.3 mm in thickness) as current collector. A zinc sheet (25 cm2) was used as the active negative electrode. The electrolyte was an aqueous solution (3.0 M NH4Cl and 2.5 M ZnCl2, pH 4.70). The polypropylene non-woven fabrics (PNWF) were used to separate positive and negative electrodes. They were mounted in a transparent vessel. The structure schematic of the Zn-PAASA or Zn-PANI secondary battery is shown in Fig.1.
Figure 1. The structure schematic of the Zn-PAASA or Zn-PANI secondary battery.
2.4 Apparatus
Cyclic Voltammetry (CV), EIS were measured by using a CHI 660D electrolysis apparatus (CHI Instruments, USA) and an electrochemical workstation (AutoLab, Nova 1.9, Metrohm) in a classical three-electrode cell. A Saturated calomel electrode (SCE), a PAASA or PANI or zinc electrode and a Pt sheet were used as reference, working and counter electrodes, respectively. The CVs of the zinc or PANI or PAASA electrode were recorded at 50 mV s-1. All the given potentials are with referred to the SCE. The sinusoidal voltage signal of small amplitude was controlled at 10 mV. The data of the EIS were measured within the frequency range from 0.1 to 105 Hz. The charge and discharge study of batteries were carried out on a charge-discharge tester (CT- 3008W, China).
The surface morphologies of the PAASA or PANI were collected by a scanning electron microscope (SEM, SUPRA 55-4828, Germany). The FTIR spectra of PAASA were measured in the range from 4000 to 400 cm-1 (FTIR, Tensor 27, Bruker). The 1H NMR spectra of PAASA were recorded at room temperature in dimethyl sulfoxide-d6 (DMSO-d6) with AVANCE 600 spectrometer (Bruker, Germany).
3. RESULTS AND DISCUSSION
[image:4.596.148.444.389.519.2]3.1. FTIR and 1H NMR spectra of PAASA
Fig. 2 shows the FTIR and 1H NMR spectra of PAASA. The backbone structure of the PAASA obtained was basically the same as that of the literature [16]. A strong peak appears at 3441 cm-1 is assigned to the N-H stretching vibrations. The sharp peaks at 1568 and 1490 cm-1 are characteristic stretching bands of quinone (N=Q=N) and benzene rings (N-B-N), respectively [22]. The peak at 1303 cm-1 is due to the stretching vibrations of the C-O-H, which is in the range 1440-1210 cm -1
in the polymer chain [23]. The peak at 1146 cm-1 is identified as the C-N stretching vibrations. The weak peak at 1640 cm-1 is the stretching vibrations of C=O in the -COOH functional group of ASA unit in the PAASA chain, which is absent in the IR spectrum of PANI. 1H NMR spectrum of the PAASA also demonstrates that the NH free radical, –OH group and–COOH group is present in the copolymer chain. Three sharp equally spaced lines at 6.97, 7.06, and 7.15 ppm are caused by the NH proton resonance. The peak at 9.3 ppm come from the OH in DMSO. The broad peak at 9.53 ppm is due to the OH proton resonance caused by the intramolecular hydrogen bond between the hydrogen atom in the hydroxyl group and the oxygen atom of the C=O group in the carboxyl group. The FTIR and 1H NMR spectra of PAASA are consistent with that reported by Mu [16].
Figure 2. IR and 1H NMR spectra of PAASA.
Based on IR and 1H NMR spectra of PAASA, the structure of PAASA can be speculated as follows:
N H
NH N
H
N
H H
[
]
x[
]
(1-x)
A- A
-N
C O OH
O H
This indicates that the polymer synthesized by aniline and ASA is the copolymer of PAASA.
3.2. Cyclic voltammograms of PAASA and PANI
main difference between curve (a) and curve (b) is a larger enclosed area in curve (b) than that of curve (a), indicating that the electrochemical activity of PAASA is better than that of PANI in the same solution. The reason is that reversible oxidation and reduction process can appear due to two pH function groups of -OH and -COOH in ASA unit in PAASA chain. The redox activity of copolymer is enhanced by the charges of pH function groups [24]. Fig. 3B shows the electrochemical cycle behavior of PAAAS. The peak-current increases and the redox peak potential difference (ΔE) decreases with the increasing of cycle number, indicating that the reversibility increased with increasing cycles [25]. This is owing to the ion diffusion more easily during the electrochemical oxidation-reduction [26]. Moreover, the PAASA film synthesized by using the potentiostatic electrochemical copolymerization still keeps 100% of the original activity after 100 successive cycles, indicating that the PAASA has the excellent electrochemical stability in the aqueous electrolyte (3.0 M NH4Cl + 2.5 M ZnCl2,pH 4.70), which will be helpful to improve the performance of Zn-PANI secondary batteries.
Figure 3. Cyclic voltammograms in electrolyte: 3.0 M NH4Cl + 2.5 M ZnCl2, at pH 4.70. (A) Different polymer: (a) PANI, (b) PAASA; (B) Curves of PAASA: (1) first cycle; (2) fifth cycle (3) One hundredth cycle, scan rate: 50 mV s -1.
3.3. Cyclic voltammograms and Impedances of PAASA
Fig. 4A shows the CVs of the PAASA in the electrolytes containing 3.0 M NH4Cl and 2.5 M ZnCl2 with different pH in the range from 0.20 to 0.80 V at 50 mV s-1. Although the three CV curves of PAASA present a pair of redox peaks, and the curves a and b are somewhat similar in shape, the curve b has the largest enclosed area. This may be because the PAASA will become a high oxidation state more easily at higher pH than that of lower pH [27]. The area of the CV of the PAASA is the smallest at pH 5.20 in Fig. 4A, which is due to the effect of a high pH on the intramolecular hydrogen bond of PAASA. Hence, pH 4.70 was also chosen as a balance between electrochemical activity of PAASA and Zn corrosion in acidic solutions [28, 29].
[image:5.596.120.478.293.414.2]
concentration of ZnCl2 increases from 2.0 to 3.0 M, but curve b has the largest enclosed area. This means that the concentration of ZnCl2 has a certain degree of effect on the electrochemical activity of the PAASA.
Curve b’ in Fig. 4B represents the CVs of the blank PG electrode measured in an electrolyte containing 3.0 M NH4Cl + 2.5 M ZnCl2 with pH=4.70. It can be clearly seen from Fig. 4 b’ that redox peak of PG does not appear, indicating that the redox reaction of PG doesn't occur in the electrolytes. Based on the data in Fig. 4 the PAASA holds higher electroactivity in 3.0 M NH4Cl and 2.5 M ZnCl2 electrolyte (pH 4.70). Hence, the electrolyte may be more geared to Zn-PAASA secondary batteries.
Figure 4. Cyclic voltammograms:(A) an electrolyte containing 3.0 M NH4Cl + 2.5 M ZnCl2 with different pHs, curves: (a) 4.20, (b) 4.70, (c) 5.20, (B) an electrolyte containing 2.5 M ZnCl2 and various concentrations of NH4Cl with pH 4.70: (a) 2.5 M, (b) 3.0 M, (c) 3.5 M and (C) an electrolyte containing 3.0 M NH4Cl and various concentrations of ZnCl2 with pH 4.70: (a) 2.0 M, (b) 2.5 M, (c) 3.0 M, (b’) was CVs of blank GP in an electrolyte containing 3.0 M NH4Cl + 2.5 M ZnCl2 with pH=4.70, scan rate: 50 mV s -1.
EIS measurements were usually used to study the charge-transport kinetics and conductivity of the polymer films [30, 31]. The plots semicircle of EIS Nyquist related to charge transfer resistance (Rct) in the high frequency region, and the straight line of EIS Nyquist is associated with mass transfer control of electrode reaction at low frequencies [32, 33]. The intercept at the X-axis of very high frequency represents a combined internal resistance (Rs) of the electrolyte, intrinsic resistance of active substance and the interface resistance between active substance and current collectors [34]. Fig. 5A presents the Nyquist plots of the PAASA on PG electrode measured in open-circuit voltage in the electrolyte (3.0 M NH4Cl +2.5 M ZnCl2) with different pHs. The semicircle is not observed in the high frequency regions, indicating that the charge transfer process of PAASA electrode is fast [35]. In addition, it can be seen that the three straight lines are parallel with each other and the Rs value of the PAASA increases with the increase of pHs at low frequencies. The results clearly show that the conductivity of the electrolyte decreases with the increase of the pH. These results are also consistent with the results of solution conductivity measurement (see Table 1 (No.1)).
[image:6.596.76.519.231.347.2]
ZnCl2 concentration, the curve b has the largest value of the Rs (compare to curve a and c). In fact, at the intermediate concentration of ZnCl2, the aqueous electrolyte has highest of the conductivity in Table 1 (No. 2). The reason is that the ZnCl2 will precipitate and cover the surface of the copolymer [36] when the concentration of ZnCl2 increase to 2.5 M, which can be seen by the naked eyes and increases the total resistance.
Fig. 5C represents the Nyquist plots of the PAASA on PG electrode at the open-circuit voltage in the electrolytes consisting of 2.5 M ZnCl2 and various concentrations of NH4Cl (pH 4.70). The Warburg resistance in the low frequency region comes from ion diffusion [37]. Curve a and c have the almost equal Rs, while at the intermediate concentration of NH4Cl, curve b has the largest Rs, which is related to forming the highest complexation efficiency between Zn2+ and NH3in the solutions [38]. Although the fact that Zn2+ complication results in the decrease of the number of conductive particles can affect the conductive ability of electrolyte, it contributes to the inhibition of Zn-dendrite growth in the charging process of Zn-PAASA polymer batteries.
[image:7.596.78.517.308.421.2]Figure 5. EIS of PAASA obtained at open circuit potential. (A) 3.0 M NH4Cl + 2.5 M ZnCl2 with different pHs, curves: (a) 4.20, (b) 4.70, (c) 5.20; (B) 3.0 M NH4Cl and various concentrations of ZnCl2 with pH 4.70, curves: (a) 2.0 M, (b) 2.5 M, (c) 3.0 M; (C) 2.5 M ZnCl2 and various concentrations of NH4Cl with pH 4.70, curves: (a) 2.5 M, (b) 3.0 M, (c) 3.5 M.
Table 1. Electrical conductivity of the electrolyte at various concentrations and pH values
No.1 pH value Conductivity / mS.cm-1
2.5 M ZnCl2 + 3.0 M NH4Cl 4.2 81.6
4.7 81.3
5.2 76.4
No.2 concentrations of ZnCl2 / M Conductivity / mS.cm-1
3.0 M NH4Cl +? ZnCl2 2.0 79.5
(pH=4.70) 2.5 81.3
3.0 73.2
No.3 concentrations of NH4Cl / M Conductivity /mS.cm-1
2.5 M ZnCl2+? NH4Cl 2.5 65.5
(pH= 4.70) 3.0 81.3
[image:7.596.70.490.530.744.2]
3.4. Cyclic voltammograms and Impedances of Zn
Fig. 6A shows the CV curves of a Zn electrode in an electrolyte containing 3.0 M NH4Cl and 2.5 M ZnCl2 with various pHs in the range from -1.15 to -0.9 V at 50 mV s-1. It can be seen from Fig. 6A that the enclosed areas of CVs increase with increasing pHs, which shows that the redox performance of Zn electrode is better at higher pH.
Fig. 6B shows the CV curves of Zn electrode in 3.0 M NH4Cl and various concentrations of ZnCl2 (pH 4.70). It can be seen that curve b has the largest enclosed area and best symmetry in Fig. 6B, the symmetry in the CV curves represents the good redox reversibility of Zn during the charge and discharge of battery [39]. This behavior could be explained by zinc ion complexation, which leads to the decrease of free zinc ion activity [40].
Fig. 6C shows the CV curves of the Zn electrode in 2.5 M ZnCl2 and various concentrations of NH4Cl (pH 4.70). The enclosed area of the CVs in Fig. 6C has some change of the concentration of NH4Cl increases from 2.5 to 3.5 M, which has the similar results with the change of ZnCl2 concentration. Although the Fig. 6B and the Fig. 6C are very similar, they come from different experimental conditions.
Figure 6. Cyclic voltammograms:(A) an electrolyte containing 3.0 M NH4Cl + 2.5 M ZnCl2 with different pHs, curves: (a) 4.20, (b) 4.70, (c) 5.20, (B) an electrolyte containing 3.0 M NH4Cl and various concentrations of ZnCl2 with pH 4.70: (a) 2.0 M, (b) 2.5 M, (c) 3.0 M and (C) an electrolyte containing 2.5 M ZnCl2 and various concentrations of NH4Cl with pH 4.70: (a) 2.5 M, (b) 3.0 M, (c) 3.5 M, scan rate: 50 mV s -1.
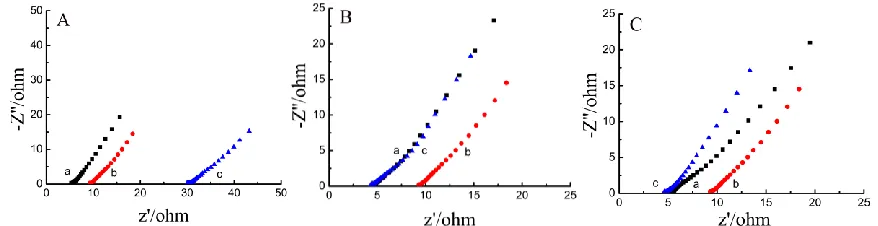
Fig. 7A shows the EIS of Zn electrode measured in 3.0 M NH4Cl and 2.5 M ZnCl2 with different pHs at open-circuit voltage. Obviously, the Rct decreases with increasing pHs and the Warburg impedance nearly disappears in Fig. 7A, showing that the Zn has better electrochemical activity at higher pHs. This result is also consistent with that of CVs in Fig. 6A, in which the enclosed area of the CVs is the largest at pH 5.20.
[image:8.596.77.518.358.476.2]
Fig. 7C shows the EIS of Zn electrode at open circuit potential in 3.0 M NH4Cl and various concentrations of ZnCl2 (pH 4.70). The Rct increases with increasing the concentration under the condition of low ZnCl2 concentration, the removed rate of ions (Zn+) near the Zn electrode is faster than the generation rate in the electrolyte [41]. At the high ZnCl2 concentration, zinc salt attached on the Zn electrode surface leads to the increases of charge transfer resistance, which is similar to our previous observation.
Figure 7. EIS of Zn electrodes obtained at open circuit potential. (A) 3.0 M NH4Cl + 2.5 M ZnCl2 with different pH, curves: (a) 4.20, (b) 4.70, (c) 5.20; (B) 2.5 M ZnCl2 and various concentrations of NH4Cl with pH 4.70, curves: (a) 2.5 M, (b) 3.0 M, (c) 3.5M; (C) 3.0 M NH4Cl and various concentrations of ZnCl2 with pH 4.70, curves: (a) 2.0 M, (b) 2.5 M, (c) 3.0 M.
3.5. Performances of the rechargeable batteries
Fig. 8A shows the galvanostatic charge-discharge curves for the Zn-PAASA battery at 4.5, 3, and 1.5 mA (corresponding to 117.5, 78.3, and 39.2 mA g-1 or the charge and discharge rate of 1.5C, 1C, and 0.5C), respectively. The charge-discharge curves are almost identically in the symmetry, which indicate that the Zn-copolymer battery has the ability to rapidly charge and discharge in the above current range. The charge-discharge time increased with the decrease of the current density from 117.5 to 39.2 mA g-1. These results show that the Zn-PAASA battery may be used as high current charge-discharge battery.
[image:9.596.79.521.190.304.2]
Figure 8. Cycle performances of the Zn-PAASA (a) and Zn-PANI (b) rechargeable batteries under a constant current of 78.3 mA g-1 (1C rate) from 0.75 to 1.5 V in solution (3.0 M NH4Cl + 2.5 M ZnCl2) with pH 4.70, (A) Galvanostatic charge-discharge curves of the Zn-PAASA battery at different constant current densities: (a) 117.5 (1.5C rate), (b) 78.3 (1C rate) and (c) 39.2 mA g-1 (0.5C rate), (B) Discharge capacity, (C) Coulombic efficiency.
[image:10.596.99.502.69.171.2]3.6. Morphology of PANI and PAASA
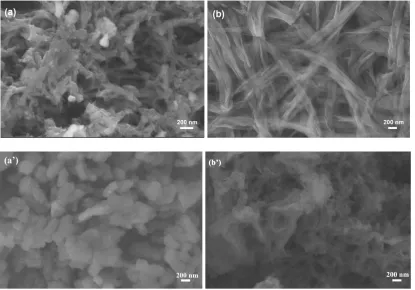
Figure 9. SEM images: (a) PANI; (b) PAASA; (a’) after 150 cycles of PANI; (b’) after 150 cycles of PAASA.
[image:10.596.93.508.308.598.2]
has kept intact of chain structure and an excellent permeability compared with the PANI in Fig. 9a’ [45]. Hence, the doping ions may be easier with ion diffusion balance in the PAASA redox process, this is very beneficial for the Zn-PAASA secondary battery.
4. CONCLUSIONS
In conclusion, we have fabricated a new Zn-PAASA secondary battery by using the Zn sheet as anode, PAASA as cathode and PG as current collector. The optimal electrolyte of the Zn-PAASA battery was an aqueous solution of 2.0 M ZnCl2 and 3.0M NH4Cl (pH 4.70). At 1C rate, the Zn-PAASA secondary batteries have an output large-capacity of 145 mAh g-1 with a Columbic efficiency of 97% over at least 150 cycles between 0.75 V and 1.5 V. Compared with traditional Zn-PANI batteries, the specific energy and large current performance of Zn-PAASA secondary battery were better than that of Zn-PANI secondary battery. This is due to the quantity of stored charge are improved by two pH functional groups (-OH and -COOH) in the PAASA chain, which takes an important part in adjusting the pHs in the copolymer. These results show that the new Zn-PAASA secondary battery will possess broad commercial application prospect duo to good electrochemical properties of PAASA and excellent corrosion-resistant, low-cost, good conductivity, soft, elastic and light material of GP.
ACKNOWLEDGEMENTS
This project was supported by the National Science Foundation of China (No.20873119), and by the Priority Academic Program Development of Jiangsu Higher Education Institutions. Part of the data was from the Testing Center of Yangzhou University.
References
1. J. W. Jeon, S. R. Kwon, F. Li, J. L. Lutkenhaus, ACS Appl. Mater. Inter., 7 (2015) 24150-24158. 2. W. Qiu, R. Zhou, L.Yang, Q. Liu, Solid State Ionics, 86 (1996) 903-906.
3. M. Wang, H. Zhang, C. Wang, X. Hu, G. Wang, Electrochim. Acta, 91 (2013) 144-151.
4. K. Ghanbari, M. F. Mousavi, M. Shamsipur, H. Karami, J. Power Sources, 170 (2007) 513-519. 5. M. S. Ram, S. Palaniappan, J. Mater. Sci., 39 (2004) 3069-3077.
6. A.Wu, E. C.Venancio, A. G. MacDiarmid, Synthetic Met., 157 (2007) 303-310. 7. Y. Yin, C. Liu, S. Fan, Nano Energy, 12 (2015) 486-493.
8. Z. L. Wang, R. Guo, G. R. Li, H. L. Lu, Z. Q. Liu, F. M. Xiao, J. Mater. Chem., 22 (2012) 2401-2404.
9. M. Chen, G. A. Rincon-Mora, IEEE T. Energy Conver., 21 (2006) 504-511.
10.B. Z. Jugovic, T. L Trisovic, J. S. Stevanovic, M. D. Maksimovic, B. N. Grgur, Electrochim. Acta, 51 (2006) 6268-6274.
11.M. Pasta, C. D. Wessells, R. A. Huggins, Y. Cui, Nat. commun., 3(2012) 1149. 12.M. Sima, T. Visan, M. Buda, J. Power Sources, 56 (1995) 133-136.
13.B. Z. Jugovic, T. Lj. Trisovic, J. S. Stevanovic, M. M. Gvozdenovic, B. N. Grgur, J. Appl. Electrochem., 39 (2009) 2521-2528.
14.C. U. Udeh, N. Fey, C. F. Faul, J. Mater. Chem.,21 (2011) 18137-18153.
16.S. Mu, Synthetic Met., 161 (2011) 1306-1312.
17.Z. Cai, J. Guo, H. Yang, Y. Xu, J. Power Sources, 279 (2015) 114-122. 18.N. Gospodinova, L. Terlemezyan, Prog. Polym. Sci., 23(1998) 1443-1484.
19.F. Sopaj, M. A. Rodrigo, N. Oturan, F. I. Podvorica, J. Pinson, M. A. Oturan, Chem. Eng. J., 262(2015) 286-294.
20.Y. Ding, S. Kan, J. Gu, J.Kan, Int. J. Electrochem. Sci., 9 (2014) 6281- 6293. 21.S. Mu, Q. Shi. Synthetic Met., 221(2016) 8-14.
22.T. Alemayehu, D. Abiebie, J. Serb.Chem. Soc., 66(2001) 1-4.
23.E. Pretsch, P. Buhlmann, C. Affolter, E. Pretsch, P. Bhuhlmann, C. Affolter, Structure determination of organic compounds, Berlin: Springer, 2009, p291.
24.J. Zhang, D. Shan, S. Mu, J. Power Sources, 161 (2006) 685-691.
25.A. Guerfi, J. Trottier, I. Boyano, I. De Meatza, J. A. Blazquez, S. Brewer, K. Zaghib,J. Power Sources, 248 (2014) 1099-1104.
26.K. S. Ryu, K. M. Kim, Y. S. Hong, Y. J. Park, S. H. Jang, B. Kor. Chem. Soc.,23(2002), 1144-1148.
27.M. H. Pournaghi-Azar, H. Nahalparvari, Electrochim. Acta, 50 (2005) 2107-2115.
28.C. Karlen, I. O. Wallinder, D. Heijerick, C. Leygraf, C. R. Janssen, Sci. Total Environ., 277 (2001) 169-180.
29.T. K. Hoang, K. E. K. Sun, P. Chen, RSC Adv., 5(2015) 41677-41691.
30.S. Gao, L. Zhang, Y. Qiao, P. Dong, J. Shi, S. Cao, RSC Adv., 6 (2016) 58854-58861. 31.S. He, J. Wei, F. Guo, R. Xu, C. Li, X. Cui, D. Wu, J. Mater. Chem. A, 2 (2014) 5898-5902. 32.F. Zhao, X. Wu, M. Wang, Y. Liu, L. Gao, S. Dong, Anal.Chem.,76 (2004) 4960-4967. 33.C. Wang, A. J. Appleby, F. E. Little, J. Electroanal. Chem., 497 (2001) 33-46.
34.T. Zhou, Y. Qin, J. Xu, Y. Tao, M. Lu, Y. Kong, Synthetic Met., 199 (2015) 169-173.
35.Y. Zhao, Y. Huang, L. L. Xue, X. Sun, Q. Wang, W. Zhang, Polym. Test, 32 (2013) 1582-1587. 36.C. Chen, X. Hong, A. Chen, T. Xu, L. Lu, S. Lin, Y. Gao, Electrochimi. Acta, 190 (2016) 240-247. 37.J. C. Li, Z. Ma, Y. Chi, S. P. Guo, J. Mater. Sci., 52 (2017) 1573-1580.
38.Y. Lu, J Cao, S. Mu, J. Yangzhou Teach. Coll., 7 (1987) 55-58.
39.F. Zhang, L. Hao, L. Zhang, X. Zhang, Int. J. Electrochem. Sci., 6 (2011) 2943-2954. 40.B. N. Grgur, J. Adv. Eng Sci, 1 (2007) 21-32.
41.M. Sima, T. Visan, M. Buda, J. Power Sources 56 ( 1995) 133-l 36
42.B. C. Dalui, I. N. Basumallick, S. Ghosh, Indian J. Chem. Techn., 15(2008) 576-580. 43.Y. Zhao, S. Si, C. Liao, J. Power Sources, 241 (2013) 449-453.
44.S. Mu, J. Electroanal. Chem., 743 (2015) 31-37. 45.Z. Ma, J. Kan, Synthetic Met., 174 (2013) 58-62.

![Fig. 2 shows the FTIR and 1obtained was basically the same as that of the literature [16]](https://thumb-us.123doks.com/thumbv2/123dok_us/1819040.137494/4.596.148.444.389.519/fig-shows-ftir-obtained-basically-literature.webp)


![Fig. 7C shows the EIS of Zn electrode at open circuit potential in 3.0 M NH4concentrations of ZnClcondition of low ZnClthan the generation rate in the electrolyte [41]](https://thumb-us.123doks.com/thumbv2/123dok_us/1819040.137494/9.596.79.521.190.304/electrode-circuit-potential-concentrations-znclcondition-znclthan-generation-electrolyte.webp)