parameters.
.
White Rose Research Online URL for this paper:
http://eprints.whiterose.ac.uk/146146/
Version: Published Version
Article:
Avrutin, Eugene orcid.org/0000-0001-5488-3222 and Zhang, Lixiong (2019) Dynamics of
of single- and multicontact external cavity semiconductor lasers under intracavity
frequency sweeping: effects of material and laser parameters. European physical journal
b. ISSN 1434-6028
https://doi.org/10.1140/epjb/e2019-90639-3
[email protected] https://eprints.whiterose.ac.uk/
Reuse
This article is distributed under the terms of the Creative Commons Attribution (CC BY) licence. This licence allows you to distribute, remix, tweak, and build upon the work, even commercially, as long as you credit the authors for the original work. More information and the full terms of the licence here:
https://creativecommons.org/licenses/
Takedown
If you consider content in White Rose Research Online to be in breach of UK law, please notify us by
Eur. Phys. J. B(2019) 92: 137
https://doi.org/10.1140/epjb/e2019-90639-3
T
HE
E
UROPEAN
P
HYSICAL
J
OURNAL
B
Regular Article
Dynamics of single- and multicontact external cavity
semiconductor lasers under intracavity frequency sweeping:
effects of material and laser parameters
⋆
Eugene A. Avrutin1,aand Lixiong Zhang1,2
1
Department of Electronic Engineering, University of York, York YO105DD, UK
2
Xuzhou Lixiong Intelligence Technology Co. Ltd, Xuzhou, P.R. China
Received 31 October 2018 / Received in final form 16 February 2019 Published online 24 June 2019
c
The Author(s) 2019. This article is published with open access atSpringerlink.com
Abstract. We present numerical analysis of the dynamic behavior of a single- and multicontact Fabry– Perot semiconductor laser frequency-swept by means of an ultrafast intracavity filter. The interrelated roles of the tuning speed, the filter bandwidth, the cavity length, and the self-phase modulation in laser dynamics are analyzed. Regular and irregular mode hopping, as well as fundamental and second harmonic sliding frequency mode locking and chaotic laser operation are identified as important dynamic regimes. The relation between the tuning dynamics asymmetry and the self-phase modulation in the laser is studied. The operation of a multicontact laser with an intracavity saturable absorber in a combined sliding-frequency and passive mode locking regime is shown; the dynamic asymmetry in the laser behavior is shown to be reduced but not eliminated by the presence of the absorber.
1 Introduction and background
Fast tunable lasers can find a number of practical appli-cations, mainly in information acquisition systems. Those can involve tunable laser spectroscopy, or swept source Optical Coherence Tomography (OCT) (see [1] for an extensive and up-to-date overview of the field). OCT involves using a laser whose frequency is swept rapidly across a wide wavelength range to measure the spectrum of interferences between tissue reflections and a reference reflector, which in turn is used to create a subsurface image of the tissue. The requirements to the laser source are as follows: (a) wide tuning range (∼100 nm) for a
high (<15 µm) depth resolution of imaging; (b) fast tun-ing (100 kHz) for fast data acquisition (combined with the wide tuning range, this determines the speed of fre-quency sweeping of up to∼1 GHz ns−1); and, finally, (c)
a narrow dynamic linewidth (<13 GHz) for a large imag-ing depth capability (although too narrow a linewidth is inadvisable too, in order to avoid artefacts). Thus, swept-source OCT typically uses external cavity laser diodes frequency-swept by means of a tunable intracavity fil-ter. Ring lasers have been used initially [2]; however, the later development of a highly frequency selective, com-pact reflecting filter has allowed a simpler, more comcom-pact Fabry–Perot construction to be used [3,4]. Since such a
⋆Contribution to the Topical Issue “Non-Linear and
Com-plex Dynamics in Semiconductors and Related Materials”, edited by Kathy L¨udge.
a
e-mail:[email protected]
construction is relatively short (1–10 cm in length), the laser is frequency-swept through its intermodal frequency interval in only a few round-trips and thus operates in a perpetually transient regime. Depending on the combina-tion of the filter bandwidth, the cavity intermodal interval and the sweeping speed, either near-single-mode hopping or quasi-continuous envelope tuning are possible. The tun-ing is strongly asymmetric, with the red tuntun-ing (dynamic decrease of the operating frequency, or increase of wave-length) being more smooth and producing higher power output than the opposite case of blue tuning [2,3]. The output power decreases with tuning speed, and beyond a certain tuning speed, the laser does not switch on at all.
lasers depending on the spectral width of the filter reflec-tivity peak and the tuning speed, and in particular to discuss in more detail, in the spirit of this Special Issue, the role of the material (and laser design) parameters in the laser dynamic regime. Namely, we discuss the role of the self-phase modulation (quantified by the linewidth enhancement factor), and incorporate the analysis of mul-ticontact laser structure with an intracavity saturable absorber, in particular to analyze its potential in reducing the tuning asymmetry.
2 The model and the single contact
structure studied
We use the travelling-wave laser model LasTiDom (see [10–12] for the model description), applied previously to a number of laser designs including mode-locked lasers and self-seeded gain-switched external cavity laser diodes. The construction used is schematically shown in Figure1and consists of an active semiconductor chip with the outer facet reflecting and the inner facet (facing a passive cavity) with zero reflectance, a passive resonator, and a tunable reflector simulating the filter.
The gain chip is assumed to be a MQW semiconductor laser amplifier; the parameters (see Tab. 1) are largely taken from the literature.
The new feature in the model, specific to the fast tun-able construction, is the account for the tuntun-able frequency filter. Following [5,6], we chose a Lorentzian approxima-tion for the filter reflectance curve (compared in Fig.2to a typical measured filter reflectance; note that in dynamic simulations, the peak reflectance was set to a smaller value, to account for possible coupling losses).
This is implemented as an operator ∧ρ which has the same functional form as the gain dispersion operator in the model, and in frequency domain takes the form
∧ Er=
∧ ρE∧i=
ρmax 1 +j∆ν−∆νf(t)
δνf
∧
Ei (1)
whereEr andEi are the slow amplitudes of the reflected
and incident waves (the hat symbol denotes operating in frequency rather than time domain), ρ is the amplitude reflectance of the filter (ρmax being the peak value), ∆ν is the optical frequency detuning from the reference value
νref, ∆νf is the time-dependent spectral position of the
filter reflectance peak (with respect to the same reference value), andδνf is the filter bandwidth (full width at half
maximum). Such an approximation, while quite accurate (Fig. 2), can be straightforwardly implemented in time domain using a simple infinite impulse response digital filter [12]:
Er= ∧ ρ Ef
=ρmaxδΩf ∞
R
o
Ef(t−τ) exp[(−δΩf+j2π∆νf(t−τ))τ]dτ
[image:3.595.311.549.70.119.2](2)
Fig. 1. Schematic of the simulated laser geometry.
Fig. 2.The measured [4] and approximated reflectance curves of the intracavity tunable filter.
Here, δΩf = 2πδνf is the filter bandwidth in terms
of angular frequency. The formula (2) allows numer-ical implementation via a simple recursive procedure, thus easily and efficiently keeping the modeling fully in time domain as opposed to a more complex approach alternating time and frequency domain as in [2].
The threshold condition, used to normalize the pumping in the subsequent sections, was determined assuming the filter was exactly resonant with one of the external cavity modes:
gth= 1 Γ
1
2LSOA
ln 1
Rfacetρ2max +aint
(3)
with Rfacet the reflectance of the facet opposite to the external cavity (Fig.1), Γ the confinement factor, andaint the internal (dissipative) loss. The main parameters of the simulation, unless otherwise specified, are summarized in Table 1.
3 Results and discussion
Following earlier work [5,6], we note that there are two main cases of possible laser dynamics. The first of them is realized in the short, or narrowband filter, construction, which is defined as the construction where the intermodal interval ∆νIMis of the same order as the filter bandwidth.
In an external cavity design, ∆νIM ≈2(Lext+ngLSOA)/c,
Lext and LSOA being the external cavity and semicon-ductor optical amplifier (SOA) chip lengths (Fig.1), and
ng the group velocity refractive index in the SOA chip.
With parameter values as shown in Table 1, ∆νIM =
2.7 GHz, andδνf = 2 GHz in our simulations for the
[image:3.595.310.550.157.296.2]Eur. Phys. J. B(2019) 92: 137 Page 3 of10
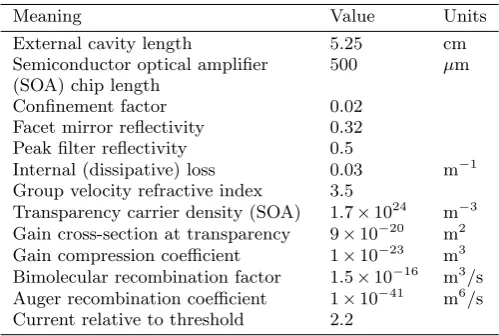
Table 1.Parameters used and their values unless
other-wise specified.
Meaning Value Units
External cavity length 5.25 cm Semiconductor optical amplifier
(SOA) chip length
500 µm
Confinement factor 0.02 Facet mirror reflectivity 0.32 Peak filter reflectivity 0.5
Internal (dissipative) loss 0.03 m−1
Group velocity refractive index 3.5 Transparency carrier density (SOA) 1.7×1024
m−3
Gain cross-section at transparency 9×10⁻²⁰ m2
Gain compression coefficient 1×10⁻²³ m3
Bimolecular recombination factor 1.5×10⁻¹⁶ m3/s
Auger recombination coefficient 1×10−41 m6/s
Current relative to threshold 2.2
The behavior of the construction with a short resonator has been described in our conference papers [5,6] and is briefly summarized here for reference purposes. In steady state, the laser remains single-frequency. Under tuning, the filter reflectance peak position ∆νf is swept, starting
at a certain timetstart, at a constant rate dνf/dtso that
∆νf= (dνf/dt) (t−tstart). Then, the output settles, after
an initial transient, to a quasi-periodic process (Figs. 3a and 3b) identified as hopping between the longitudinal modes of the external cavity (Fig. 3c), with the mode nearest to the filter reflectance peak dominating in the spectrum during each of the inter-hop intervals. Each hop is accompanied by an irregular relaxation transient a few nanoseconds in duration (typical for any intensity tran-sient in a semiconductor laser), while the duration of the inter-hop interval is roughly the time it takes the filter peak to move through one intermodal interval ∆νIM. The
hop time is then estimated as
∆Thop= ∆νIM(dνf/dt) −1
. (4)
Due to the permanently transient nature of the laser dynamics, the laser emission never becomes genuinely single-frequency, but the slower the tuning and the longer the inter-hop interval, the closer it becomes to true single-frequency emission. In common with the ring lasers [2] the power dynamics is asymmetric, with the power at blue tuning being lower than at red tuning. The nature of this asymmetry is associated [2] with the asymmetric mode interaction due to the nonzero linewidth enhancement factorαH in the laser (the Bogatov effect [13]).
The same asymmetry is also seen in of the output power time averaged over the entire tuning period, is shown in Figure4.
Figure 4 also illustrates the fact that at high tuning speed, when the filter sweeps past each resonator mode too fast for the modal power to build up, the laser fails to switch on at all so the output is zero. The tuning speed corresponding to this switch-off, too, is asymmetric: faster red tuning is possible than blue tuning.
Fig. 3. Transient output of a swept source under blue (a) and red (b) tuning and the corresponding operating frequency, filtered for clarity by time-averaging over intervals∼10 ps (c).
The dynamics in the long resonator/broadband filter case is considerably richer than in the narrowband filter one.
The construction we concentrate on has ∆νIM =
2.7 GHz,δνf = 20 GHz, so the filter bandwidth is greater
[image:4.595.42.292.92.260.2]Fig. 4.Power output averaged over the entire simulation time (1 µs) as function of tuning speed; parameter values as in Figure3.
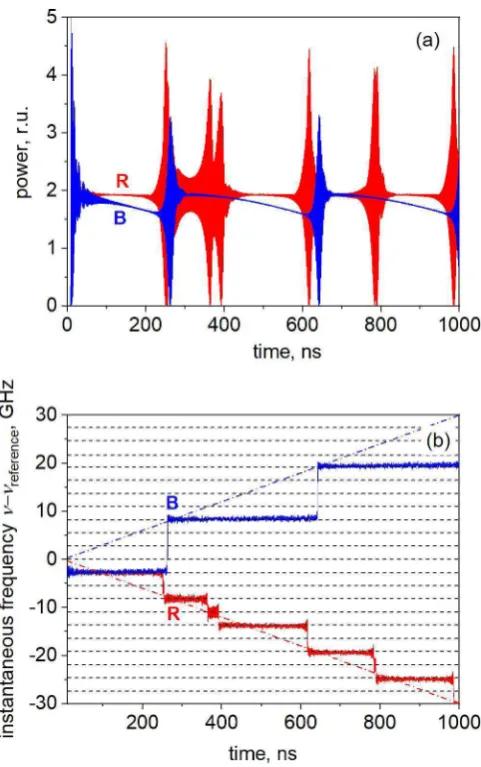
Fig. 5.As Figure3, with a broad filter width (20 GHz). Note the different time scale to Figure3. R and B refer to red and blue tuning respectively.
Fig. 6. Long-scale dynamics of output intensity for different values of (constant) slow to medium red tuning speed.
to that of the short-filter design (Fig. 5; notice the dif-ference in time scales from Fig. 3); however there is an interesting distinction. The behavior under both red and blue tuning is in the form of mode hops, not over one mode but over several, with the hop time an integer multiple of ∆Thopgiven by (3).
[image:5.595.47.288.304.688.2]Eur. Phys. J. B(2019) 92: 137 Page 5 of10
Fig. 7.Short-scale dynamics of output intensity for different values of (constant) medium to fast red tuning speed. Figure7a corresponds to Figure6c.
operating speed, he long-range output behavior remains
qualitatively the same.
However, a further increase in the red tuning speed does change the dynamics on the short (commensurate with the round trip) time scale. Inspection of the output shown in Figure6c on this shorter time scale reveals pulse-like structure with a repetition period of half of the round-trip time of laser cavity; in other words, with two pulses for each repetition period (Fig.7a), and a weak envelope modulation which disappears with increase in the tuning speed leaving a stable trail of pulses. This can be identified as harmonic sliding frequency mode locking. With further increase in the tuning speed, a period doubling bifurcation
Fig. 8.Eye diagram (100 pulses) (a) and spectra of two pulses in the stream (b) for red tuning with δνf = 20 GHz and a
tuning speed of−6.0 GHz/ns.
is seen: first, the amplitudes of the two pulses in the repetition period become different (Fig. 7b), and even-tually a single pulse per period is observed, corresponding to fundamental harmonic sliding frequency mode locking (Fig. 7c).
Similar transition from the second harmonic to funda-mental repetition frequency in quasiperiodic output was also observed in ring lasers [2]; however in the monolithic Fabry–Perot construction, which supports much fewer modes, the pulses are more pronounced and regular.
[image:6.595.70.268.67.533.2]Fig. 9. Instantaneous frequency at the peak of self-mode-locking pulse as function of the tuning time (dots) and the corresponding position of the filter reflectance peak (dashed line, almost entirely within the dot area). The range used to plot the eye diagram in Figure8is shown with an arrow.
time-bandwidth product ∆ν∆τ.As expected, forαH= 2, we found the pulses chirped, though only slightly (e.g. for the tuning speed of −3 GHz/ns we find ∆ν∆τ ≈ 0.45,
as compared to the transform limited value ∆ν∆τ ≈0.39
observed in the simulations with the same conditions and
αH = 0).
The SFML regime does not rely on the presence of any saturable absorption or similar nonlinearity, and as such is reminiscent of the self-ML seen under some conditions in monolithic DBR lasers [14]. SFML is different however in that it relies by its very nature on the tuning process: in the absence of tuning, the laser operates single-frequency. Thus, although the output intensity or power shows an approximately periodic behavior as described above and illustrated by Figure 8a, the instantaneous frequency of laser emission is not constant, but changes slightly from one round-trip to another, following the frequency sweep-ing of the filter. This is illustrated in Figure 8b (note that the shape of the single-pulse spectrum is maintained during tuning, only the central frequency changes) and also in Figure9which shows the instantaneous frequency registered at the peak of each pulse as function of the pulse maximum position (the position of the peak filter reflectance at the time is shown as a dashed line and virtually coincides with the peak pulse frequency).
[image:7.595.64.271.70.231.2]The periodicity of the SFML process is by necessity only approximate because of the gradual change in pulse parameters due to the varying detuning between the oper-ating point and the gain peak. For the same reason, the tuning process, and hence the SFML dynamics, can-not last indefinitely because at some point in time, the laser will be tuned out of its gain bandwidth. At higher tuning speeds, this point is indeed reached during the simulation span (1 µs in our case) and manifests itself, first, as gradual decrease in pulse power with time and later as switch-off as the laser is detuned to a certain fre-quency offset ∆ν. This offset point corresponds in the first approximation to the detuning-dependent threshold cur-rent raising above the operating curcur-rent I: Ith(∆ν) ≈ I.
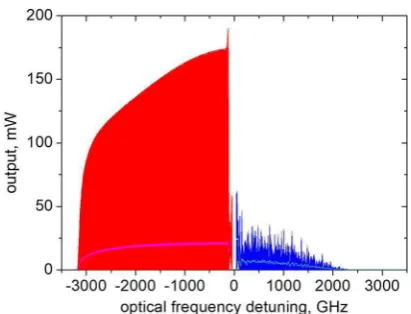
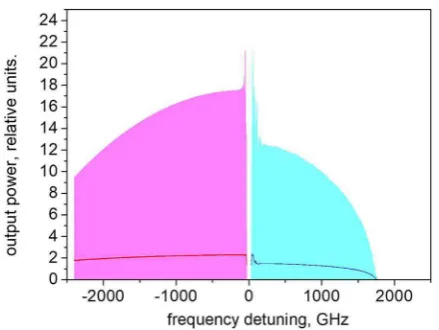
Fig. 10.Detuning dependence of instantaneous (darker lines) and time-averaged (pale lines) output power for blue and red tuning with the absolute tuning speed of 4 GHz/ns.
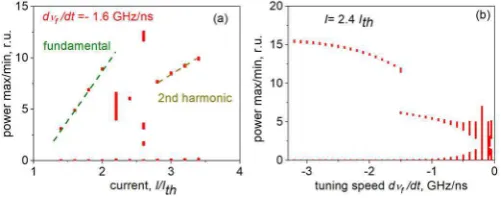
Fig. 11.Diagram of regimes in the laser under red tuning.
More precisely, the modal interaction also plays a part, and ∆ν depends to some extent on the tuning speed and direction. This is illustrated in Figure10.
[image:7.595.328.524.278.440.2]Eur. Phys. J. B(2019) 92: 137 Page 7 of10
Fig. 12.Bifurcation diagrams for cross = sections of Figure11
[image:8.595.42.293.69.168.2]at a given tuning speed (a) and current (b).
Fig. 13. Power output in a hypothetical laser construction with αH = 0.25 (a) and 0.5 (b) under blue tuning with the
tuning speed of 3 GHz/ns.
With the structure and pumping parameters used in our simulations, no harmonics above second were observed (increasing the current beyond the limits of the figure resulted in unstable behavior rather than stable operation in a higher harmonic).
Note that the results shown in Figures11and12 repre-sent red tuning only. Under fastbluetuning, thelong-term
power evolution due to the movement of the laser line through the gain spectrum is also observed (see Fig.10); however theshort-term dynamics is, in general, different from the case of red tuning. With no self-phase modu-lation, the tuning speed dependence of pulse behavior is symmetric, as in the case of a narrowband filter, and the pulsed structure in the short term dynamics is correspond-ingly observed for blue as well as red tuning. However as the linewidth enhancement factor is increased from zero, the approximately-periodic SFML pulse spectrum acquires an irregular envelope (Fig.13a).
With higher still αH, the dynamics becomes progres-sively irregular with a single pulse stream quickly giving way to multiple competing ones (Fig. 13b) and then apparently chaotic dynamics – note the irregular behav-ior of blue tuning compared to red tuning in Figure10. As in all earlier studies [5–9], the SFML regime was never observed for blue tuning with nonzero αH – the output instead remained irregular under all conditions studied; the corresponding bifurcation point thus appears to be exactly atαH = 0.
The tuning speed dependence of the output power for the case of the broadband filter is shown in Figure 14. The asymmetry and the average power decrease visible in Figure5are seen in this case too; however, higher tuning speed values are possible, approximately scaling with the filter bandwidth.
Fig. 14. As in Figure 5, for the “broad” filter bandwidth
δνf = 20 GHz.
A number of dynamic features of the Fabry–Perot lasers with a broadband filter (pulsed output under red tun-ing, period doubling with the increase in the tuning speed, irregular blue tuning, output asymmetry caused by self-phase modulation) are qualitatively similar to the behavior of long-cavity ring lasers studied in [2]. The main difference is the degree of regularity in the pulsed output: while the optical pulses reported in [2] are fairly irregu-lar and have a relatively small space to mark ratio (the “pulse” duration is a substantial fraction of the repeti-tion period), the output of the shorter Fabry–Perot laser is of a much more regular self-mode locking type, produc-ing short pulses (more than an order of magnitude smaller than the repetition period/round trip time) and we believe would have been completely periodic were it not for the gain bandwidth limitation. The likely explanation is that in the relatively short, very fast tuned Fabry–Perot res-onators, each longitudinal mode is only present in the laser output for a few round-trip times. During such short time, output instabilities have no time to develop and the regime remains stable. We note also that in the more conven-tional semiconductor laser constructions with a saturable absorber, stable mode locking is also difficult to achieve at repetition rates comparable to, or below, the carrier lifetime in the gain section [16]. We note indeed that in simulations with laser cavity lengths 2–5 times the value reported above, we found that for the same parameters studied here, the stable long pulse structures of Figure7b (and reminiscent to those seen in [2]) are simulated for a fairly broad range of tuning speeds; however the short pulse, self-ML type dynamics of the type of Figure 7c is not seen for any operating parameters.
[image:8.595.43.292.211.308.2]Fig. 15.Schematic of the simulated geometry of the laser with an intracavity saturable absorber (SA).
Table 2. The values of the SA parameters used.
Meaning Value Units
Saturable absorber length (if present) 96 µm Transparency carrier density (SA) 4×1024
m−3
SA cross-section 3×10⁻¹⁹ m2
SA compression coefficient 2×10⁻²³ m3
SA Henry factor 1
Sweepout time 10 ps
suitable for OCT but no studies of laser tuning symmetry or otherwise at high sweeping rates were reported. One notes that the lowαH is only seen in QD materials in a very narrow range of parameters, usually near threshold; in general, self-phase modulation in QD and QDh lasers, including mode locked ones, can be very significant (see e.g. [16] for an overview).
An alternative route might involve using a traditional mode locking structure with a material that can be bulk, QW or QD, and including a saturable absorber (SA) incor-porated in it (Fig. 15). It is known that the self-phase modulation in gain and absorber section to some extent cancel each other [17], and it can be argued that if the mode interaction is caused largely by the mode beating in the saturable absorber (which is widely believed to have a lower αH than the gain section) this would reduce the asymmetry.
In the simulation, we assumed the SA to occupy a fifth of the semiconductor chip, with the parameters, again, within the range quoted in the literature (Tab. 2). We found that the dynamics of a laser of this type are different from those of a single-contact device. The qualitative dif-ference between red and blue tuning is absent; instead, the dynamics are qualitatively similar in all cases (Fig.16).
Short-pulse mode locking was observed, unsurprisingly, under both blue and red tuning, as well as in the case of no tuning present. Due to the large cavity length, we did not observe any self-pulsating instability; however, harmonic ML was observed (Figs. 16 and 17); indeed in Figure16, the operating frequency corresponds to the second harmonic of the cavity round-trip even at the rel-atively modest current of 2.2 times threshold. Unlike the single-contact laser case, harmonics higher than second have also been observed in the simulations, which can also be the case in long cavity passively mode locked lasers [16,18].
Due to the presence of self-phase modulation, the dia-gram of regimes is not symmetric, with transition to higher harmonics happening at lower currents for blue tuning than for red tuning (Figs. 17 and 18). Interest-ingly, slow tuning seems to destabilize mode locking at
[image:9.595.43.292.185.267.2]Fig. 16. Fragments of the mode-locking pulse train for the laser with an intracavity saturable absorber under fast blue and red tuning as well as without tuning.
Fig. 17. Diagram of regimes in the laser with a saturable absorber under red and blue tuning.
Fig. 18. Bifurcation diagram for a cross-section of Figure17
for a given current.
many currents whereas fast tuning may restabilize it. At fastest tuning, variation in pulse parameters are partly due to tuning the laser out of the gain bandwidth.
[image:9.595.305.554.289.409.2] [image:9.595.331.524.456.629.2]Eur. Phys. J. B(2019) 92: 137 Page 9 of10
Fig. 19.Dependence of the average output power (normalized to the case of no tuning) on the tuning speed. Solid line: aver-aging over the entire 0.8µs simulation time thus taking into account spectral detuning effects. Dashed curve: averaging over the first 200 ns of tuning.
Fig. 20. Frequency detuning dependence of instantaneous (pale lines) and time-averaged (darker lines) output power for blue (right) and red (left) tuning in a two-contact laser with the absolute tuning speed of 3 GHz/ns.
it is to some extent reduced at least at the initial stage of tuning (Fig.19; compare to Fig.14).
The figure shows that there is also no initial sharp drop in the output power with the start of tuning, the depen-dence of the average power on tuning speed is noticeably more gentle than in a single-contact laser. The asymme-try in the tuning curve is still noticeable, if also somewhat gentler than in the case of a single-contact laser; in fact, red tuning in this case can cause an increase in power compared to the case of no tuning for the initial tuning period, before detuning from the gain spectrum. It may be possible to use this fact by positioning the operating spectrum at the slope of the gain spectrum of the laser.
The optical frequency range of tuning in a two-contact laser shows very little improvement over a single-contact one (Fig.20, cf. Fig.10). We note also that in a realistic laser design, the saturable absorber cross-section will be wavelength dependent which limits the spectral range in which the mode-locking behavior will be observed and is
very likely to affect the tuning properties. It is therefore fair to say that a structure with a saturable absorber offers some modest improvement in the tuning asymmetry and also a more smooth tuning curve, but at the expense of the tuning range.
Finally we note that all the designs considered here had a laser chip positioned near one of the ends of the cav-ity. Since the original submission of this paper, Johnson et al. [19] have published a demonstration of blue tuning with a power similar to that of red tuning, with a moder-ately broadband filter and the amplifier chip (without an absorber) positioned near themiddle of the cavity rather than at the side, with two pulses of significantly different amplitude passing through the chip per round-trip which plays an important part in the tuning mechanism. Ele-ments of SFML were observed under blue tuning, but no stable SFML unlike the case of red tuning. Systematic analysis of dynamic regimes in a cavity of that type, sim-ilar to that reported here, may be an interesting topic for future research.
4 Summary
We have used a time domain travelling wave model to simulate the dynamics of a relatively short (a few cm) extended Fabry–Perot cavity laser diode under fast intra-cavity frequency sweeping. The different dynamics in the case of narrowband and broadband filter has been identified, with near-periodic sliding-frequency self-mode-locking regime observed within a range of parameters at fast red tuning of a laser with a broadband filter. The qualitative asymmetry between the blue and red tuning was found to exist for any nonzero value of the linewidth enhancement factor. The qualitative asymme-try is removed in a construction with a broadband filter and an intracavity saturable absorber; however some quantitative asymmetry remains.
Author contribution statement
Eugene Avrutin formulated and mostly coded the model and performed approximately half of the simulations; Lixiong Zhang made some modification to the code and performed the rest of the simulations, both authors con-tributed to interpretation of results.
Open Access This is an open access article distributed under the terms of the Creative Commons Attribution License (http://creativecommons.org/licenses/by/4.0), which permits unrestricted use, distribution, and reproduction in any medium, provided the original work is properly cited.
References
1. T. Klein, R. Huber, Biomed. Opt. Express 8, 828 (2017)
[image:10.595.58.278.292.457.2]3. M. Kuznetzov et al., Proc. SPIE7554, 75541F (2010) 4. D.C. Flanders, W.A. Atia, B.C. Johnson, M.E. Kuznetsov,
C.R. Melendez, Optical coherence tomography laser with integrated clock, US Patent Application 2009/0290167 A1 5. E.A. Avrutin, L.S. Zhang, in Proceedings of NUSOD
International Conference, Rome, 5–7 September 2011 6. E.A. Avrutin, L. Zhang, inProceedings 14th Conference on
Transparent Optical Networks, Coventry, UK, 2012, paper Mo.C.4.3., 1–4, IEEE
7. G. Slepneva, B. O’Shaughnessy, B. Kelleher, et al., Opt. Express22, 181177 (2014)
8. B.C. Johnson, W. Atia, M. Kuznetsov, D. Flanders, Photonics West 2013 Poster 8571-103, 2013 (unpublished) 9. B.C. Johnson, W. Atia, M. Kuznetsov, B.D. Goldberg, P. Whitney, D. Flanders, Biomed. Opt. Express 8, 1045 (2017)
10. E.A. Avrutin, B.M. Russell, IEEE J. Quantum Electron.
45, 1456 (2009)
11. E.A. Avrutin, N. Dogru, B.S. Ryvkin, J.T. Kostamovaara, IET Optoelectron.10, 57 (2016)
12. E.A. Avrutin, V.V. Nikolaev, D. Gallagher, Mono-lithic mode-locked semiconductor lasers, inOptoelectronic Devices – Advanced Simulation and Analysis, edited by J. Piprek (Springer, NY, 2005), p. 185
13. A.P. Bogatov, P.G. Eliseev, B.N. Sverdlov, IEEE J. Quantum Electron.11, 510 (1975)
14. P. Bardella, I. Montrosset, IEEE J. Select. Top. Quantum Electron.11, 361 (2005)
15. B.J. Stevens, D.T.D. Childs, K.M. Groom, M. Hopkinson, R.A. Hogg, Appl. Phys. Lett.91, 121119 (2007)
16. E.A, Avrutin, E.U. Rafailov, Advances in Mode-Locked Semiconductor Lasers, in Semiconductors and Semimet-als, edited by J.J. Coleman, A.C. Bryce, C. Jagadish (Academic Press, Burlington, 2012), Vol. 86, p. 93 17. R.A. Salvatore, S. Sanders, T. Shrans, A. Yariv, IEEE J.
Quantum Electron.32, 941 (1996)
18. A.G. Vladimirov, D. Turaev, Phys. Rev. A 72, 033808 (2005)
![Fig. 2. The measured [4] and approximated reflectance curvesof the intracavity tunable filter.](https://thumb-us.123doks.com/thumbv2/123dok_us/1774556.131460/3.595.311.549.70.119/fig-measured-approximated-reectance-curvesof-intracavity-tunable-lter.webp)