11
Section i:
Allocation of expenditure
29
Section ii:
EU budget revenue in 2006
1.1. Allocation of expenditure by heading ... 11
1.2. Allocation of expenditure by Member State ... 19
introduction
7
33
Section iii:
Implementation of the budget
35
AnnexeS
Annex 1 Financial frameworks ...36Annex 2 Expenditure 1958–2006 by heading ...38
Annex 3 Revenue 1970–2006 by type of resource ...43
Annex 4 Revenue 1970–2006 and expenditure 1976–2006 by Member State ...48
Annex 5 Operating budgetary balances — Methodology and calculation ...62
Annex 6 Evaluation activities ...64
Annex 7 Borrowing and lending activities ...65
Annex 8 Glossary ...67
Foreword
Foreword
The year 2006 marked the end of a
programming cycle launched in 2000.
Since then, signiicant shifts in
expenditure have taken place to adapt to
the new challenges which Europe faces,
such as those posed by globalisation, the
new context of international relations
and mankind’s impact on the
environment. There has been an
impressive boost in funding for growth
and jobs, spending on research
increased by 43 % and spending on
education, vocational training and youth
shot up by almost 70 %. This shows that the budget is an adaptable
and important tool at the disposal of the EU.
This new edition of the Financial Report on the budget 2006 looks
back on a momentous political year for European budgetary
issues, with breakthroughs on the multiannual inancial framework
for 2007–13 and the agreement on the revision of the EU’s basic
inancial law, the Financial Regulation. These decisions were
crucial for the Commission and indeed the EU as a whole to
prepare the ground properly for the forthcoming seven-year
period, both in terms of setting priorities for EU expenditure and
for the manner in which they will be managed and implemented.
The Commission played its full part in reaching the best possible
outcome in these debates.
introduction
Better reporting thanks to a consolidated report
This report, ‘EU budget 2006 — Financial Report’, marks an important development in terms of reporting on the EU budget. For the irst time, a single report provides you with an overview of how the budget was spent and managed, based on what was previously disseminated in two publications, the ‘Financial Report’ and the ‘Report on the allocation of EU expenditure by Member State’.
The report offers two angles of analysis on the implementation of the budget: irst by main heading of the inancial perspectives 2000–06, then by heading and Member State. Information is given on the procedure leading to the adoption of the budget, as well as on the annual accounts and treasury management. Annexes provide you with detailed historical data both on the revenue and expenditure side of the budget, including Member State-speciic allocated expenditure records.
2006: Completing one generation of EU programmes
before starting new ones…
The EU budget 2006 amounted to EUR 120.6 billion in commitments and EUR 107.4 billion in payments (1), respective increases over 2005 of 4 % and 1.6 %. Around 99 % of these legally available amounts were spent, thanks to activity-based budgeting, active management of appropriations and cooperation with all stakeholders. Some 92 % of the committed amounts were allocated to activities within the European Union and the remaining 8 % went to third countries, mainly in the form of pre-accession aid to potential EU members and development aid to developing countries.
In its second year of ofice, the Barroso Commission vigorously pursued the refocusing of the EU budget on growth and jobs, to support the implementation of the Lisbon strategy (2). The share of the budget dedicated directly to these policies, through both competitiveness and
(1) See Glossary, Annex 8, for a description
of commitment appropriations and payment appropriations.
(2) In 2000, EU countries pledged to
programmes. Given the multiannual nature of some of the EU projects, a part of the amounts committed will in fact be paid out in 2007 and 2008.
Two key events in 2006: inancial framework 2007–13
and new inancial rules
Managing the EU’s inances goes beyond the adoption and execution of the annual budget. In particular, it is important to prepare the ground for the future. In this respect, 2006 was a very busy and ultimately fruitful year.
Financial framework 200–13: refocusing future budgets
to meet the real challenges
The irst months of 2006 saw the inal negotiations between the European Parliament, the Council and the Commission, on the inancial framework 2007–13. The new Interinstitutional Agreement on budgetary discipline and sound inancial management was formally signed by the three institutions on 17 May 2006. The expenditure ceiling for the seven-year period amounts to some EUR 975 billion in current prices (excluding the European Development Fund) and contributes to a signiicant rebalancing of expenditure towards policies directly aimed at sustainable growth (heading 1). Based on the deined ceilings, this heading will represent 46 % of the budget in 2013, compared to 40 % in 2006. The dificult negotiations were instrumental in convincing all parties involved of the need to carry out a thorough review of the budget, both in terms of expenditure and revenue, a task which was given to the Commission, who will report back to the Council and Parliament at the end of 2008 or beginning of 2009.
New inancial rules: easier access to funds, better controls,
enhanced transparency
The year 2006 also saw the adoption by the Council of new inancial rules to improve the management of EU expenditure, on 13 December. The new rules, described in the Financial Regulation (4) and its Implementing Rules, simplify access to EU funding and cut red tape, for small-scale beneiciaries in particular. They also include, for the irst time, the obligation to publish the lists of beneiciaries who receive EU money through Member States, third countries or international organisations. Sound inancial management will be reinforced thanks to the commitment from Member States to improve reporting on how EU funds which they manage are spent and to exchange information on proven fraud cases. All provisions of the new Financial Regulation and its Implementing Rules entered into force by 1 May 2007.
(4) Council Regulation (EC, Euratom)
Alloc
ation of e
xpenditur
e
Sec
tion
i
StrUctUrAl ActionS
Spreading prosperity and growth across EU regions
Commitments: EUR 44 555 million Commitments: EUR 44 555 million + 5.0 % from 2005
Around 37 % of EU expenditure in 2006, some EUR 44.6 billion (1), was available to generate and spread
prosperity across the Union through four Structural Funds and the Cohesion Fund.
Extra help for less prosperous regions and disadvantaged groups
Some EUR 38.5 billion was made available to all re-gions across the EU through the Structural Funds, which in turn distributed the aid in accordance with speciic objectives and initiatives.
Out of this total, EUR 28.5 billion was earmarked for the least prosperous (Objective 1 — with income per capita levels below 75 % of the EU average) regions in the EU. During 2000–06, some 50 regions across the EU were eligible to beneit from funds under this
ob-jective to support their investments in infrastructure, human resources and business potential.
About EUR 6.4 billion of the Objective 1 funds were put aside for the least prosperous regions in the EU-10, while the remaining EUR 22 billion was made availa-ble to those in the EU-15, including regions beneiting from transitional support.
Without any restrictions linked to regional income levels, all areas facing structural diiculties were eligi-ble to beneit from Objective 2 allocations, aimed at promoting their economic and social conversion. he total for 2006 amounted to EUR 3.4 billion.
Objective 3, entirely inanced by the European Social Fund (ESF), provided around EUR 4 billion in 2006 for education, training and employment activities across the Union.
Investing in transport and energy infrastructures
he Cohesion Fund earmarked EUR 6 billion in 2006 to complement infrastructure investments in trans-port and energy in those EU countries with an income per capita below 90 % of the EU average. It provides up to 85 % of public expenditure on major projects in these two domains, ater evaluating proposals put forward by EU countries.
StrUctUrAl ActionS 2000–06
(total commitments, million EUR)
European Regional Development Fund (ERDF)
Promoting economic and social cohesion through the reduction of imbalances between regions or social groups
Objective 1, Objective 2, Interreg
European Social Fund (ESF) Combating unemployment, developing human
resources and promoting integration into the labour market
Objective 1, Objective 2, Objective 3, EQUAL
European Agricultural Guidance and Guarantee Fund (EAGGF)
Rural development and the improvement of agricultural structures
Objective 1, outside Objective 1 regions,
StrUctUrAl FUndS
(1.1. Allocation of expenditure by heading)
0 5 000 10 000 15 000 20 000 25 000 30 000 35 000 40 000 45 000
Interreg Interregional cooperation in the EU Financed by ERDF
URBAN Sustainable development in the troubled urban
districts
Financed by ERDF
Leader+ Encouraging rural actors to tap on the development
potential of their local region
Financed by EAGGF
EQUAL A more inclusive work life through ighting
discrimination and exclusion
Financed by ESF
What next?
In the inancial programming period 2007–13, assist-ance to EU regions will be mainly distributed through ‘convergence’, ‘regional competitiveness and employ-ment’, and ‘territorial cooperation’ objectives.
coheSion For groWth And employment
(% of budget, commitment appropriations)
40
0
2006 2013 (*) 35
30
25
20
15
5 10
(*) Expenditure ceiling in the inancial framework.
Improving everyday life through research, environmental protection,
consumer protection, culture and building an area of freedom,
security and justice
internAl policieS
Commitments: EUR 44 555 millionCommitments: EUR 9 400 million + 2.7 % from 2005
‘Internal policies’ cover a large variety of EU policies, such as research, energy and transport, information society, media, education and culture, health and con-sumer protection, security and justice. he allocation of EU funds under this heading focused on three of the four key priorities identiied by the Lisbon strategy, namely prosperity, solidarity and security. In 2006, the European Union allocated EUR 9.4 billion to in-ternal policies.
Research and innovation
Some EUR 5.3 billion was earmarked for research ac-tivities, mainly through the sixth framework pro-gramme for research and technological development. Around EUR 1.2 billion of this total was put aside to develop the ‘information society’ related programmes.
Trans-European transport and energy networks
Around EUR 800 million was allocated to priority projects connecting and improving major infrastruc-tures in the areas of transport (e.g. roads, railways, in-land waterways, airports, ports, traic management systems) and energy (gas, electricity).
Environment
he EU’s environment policy aims at a high level of protection of the environment, with continued focus on climate change, nature and biodiversity, natural re-sources and waste, and solutions to global challenges. Around EUR 275 million was made available to this end, mainly through the LIFE programme with EUR 150 million.
Education and culture
Education and culture activities across the EU were allocated around EUR 950 million for new projects, with a particular focus on lifelong learning, developing European cultural diversity and active citizen partici-pation.
hese activities were carried out mainly through EU programmes such as Lingua (learning European languages), Erasmus (higher education), Leonardo da Vinci (vocational training), Youth, and Dialogue with citizens.
Alloc
ation of e
xpenditur
e
Sec
tion
i
Public health and consumer protection
he EU budget allocated more than EUR 140 million in 2006 to public health and consumer protection ac-tivities. In addition to improving consumer protection rules and consumers’ awareness of their rights, EU-funded projects in this ield aimed at managing risks and providing quick responses to public health threats such as SARS, avian inluenza and bioterrorism, oten in conjunction with other policies.
Freedom, security and justice
More than EUR 580 million was made available for de-veloping cooperation among EU countries in such ar-eas as immigration, the ight against crime, the ight against terrorism, drug and human traicking, as well as external border controls. In 2006, the EU’s external borders agency Frontex started conducting its irst op-erations on the ground with funds under this heading.
Other actions
he ‘Internal policies’ heading covers many diferent areas of activity, oten interacting with policies under
other headings and diicult to list extensively. For ex-ample, some actions support the internal market (EUR 240 million), the European social dimension and em-ployment (EUR 260 million), the promotion of the EU’s energy policy and energy safety (EUR 230 mil-lion), etc. All together these activities represented over EUR 1 billion.
What next?
he policies previously under ‘Internal policies’ are classiied under several diferent headings of the i-nancial framework 2007–13. For example, research, lifelong learning, energy and transport will be pre-sented under the new heading 1 ‘Sustainable growth’, and the environment under heading 2 ‘Natural re-sources’. Culture, media, freedom, security and justice will be inanced under heading 3 ‘Citizenship, free-dom, security and justice’. In the years to come, these policies will continue to increase their share of the EU budget.
citiZenShip, Freedom, SecUrity And jUStice
(in current prices, million EUR)
0 2 500
2 000
1 500
500 1 000
(*) Expenditure ceiling in the inancial framework.
AgricUltUre (inclUding rUrAl development)
Market-oriented production and diversiied rural economies
Commitments: EUR 44 555 million Commitments: EUR 50 191 million + 2.4 % from 2005
he EU’s common agricultural policy (CAP) has un-dergone major reforms since the 1990s. Recently brought into line with Lisbon targets, the post 2003–04 CAP focuses on matching production with consumers’ demand while ensuring stable incomes for farmers.
In 2006, the EU budget put aside around EUR 42.4 bil-lion as direct aid to farmers and market expenditures, at the same level as in 2005.
More than EUR 34.2 billion of this amount was allo-cated as direct aid, of which around half was delivered in accordance with recent reforms under the single payment scheme and therefore not linked to quantities produced. Such aid directly focuses on providing stability of income for producers while ensuring the enforcement of environmental rules. he remaining direct aids were linked to speciic products.
Market expenditure, corresponding to some EUR 8.2 billion in 2006, covers EU payments to market organi-sations for agricultural products such as cereals, rice, sugar, olive oil, fruit and vegetables, beef and veal, and milk and milk products.
To ensure stability and growth in primarily agricul-tural areas, the emphasis is now put on rural develop-ment, mainly through diversiication of local econo-mies. Some EUR 7.8 billion was made available in this area in 2006, to which EUR 3.9 billion funded under structural actions must be added.
Today, rural development programmes aim at boost-ing job creation outside of urban areas, thus contribut-ing signiicantly to the growth and jobs agenda. Com-pliance with strict environmental rules has also become a ‘must’ to beneit from EU aids.
What next?
Rural development expenditure will maintain its up-ward trend during the 2007–13 inancial program-ming period. At the same time, in accordance with the ongoing reforms in agricultural sectors, the share of direct aids and market-related expenditure in the EU budget will continue to decrease.
rUrAl development expenditUre
(total commitments, million EUR) (funded under the agricultural heading)
0 12 000
10 000
8 000
6 000
2 000 4 000
2000 2001 2002 2003 2004 2005 2006 0
2006 2013
5 10 15 20 25 30 35 40
AgricUltUre (inclUding rUrAl development) 2006–13
(% of total EU expenditure allowed by the inancial framework)
Market expenditure and direct payments Rural development, environment and isheries
Alloc
ation of e
xpenditur
e
Sec
tion
i
Under ‘External action’, the EU budget allocated more than EUR 5.7 billion to support a wide variety of ex-ternal policies, ranging from development, humani-tarian aid, democracy and human rights to coopera-tion programmes with speciic regions.
With some EUR 1.7 billion, the largest share was de-voted to enhancing cooperation with the Union’s neigh-bours in eastern Europe and around the Mediterranean basin. EU projects in this region focused on sustainable development, human rights and the rule of law.
An additional EUR 1.3 billion was allocated from the EU budget to help developing countries in Africa, the Caribbean and the Paciic regions (the ACP States). A part of this assistance went to sugar-producing ACP States, afected by the sugar reform in the EU.
More than EUR 530 million was made available through the CARDS programme (1) in 2006 to foster relations
with the western Balkans. he Union’s external policy towards these countries is tailored to help them prepare for prospective membership to the EU. he cooperation programme puts strong emphasis on institution build-ing and alignment with the EU acquis.
EU expenditure under this heading covered other re-gional programmes, such as cooperation with Asia (EUR 840 million) and Latin America (EUR 330 mil-lion), as well as thematic programmes, including de-mocracy and human rights (EUR 130 million), and
hu-Reserves
he inancial framework 2000–06 included a special heading, ‘Reserves’, comprising two reserve funds: the ‘Emergency aid reserve’ and the ‘Guarantee reserve’, which could be called on only if the need arose during a particular year. he use of these reserves requires approval by the European Parliament and the Council of the European Union.
In 2006, EUR 180 million was mobilised as emergency aid in response to humanitarian crises in the West Bank and Gaza, Lebanon and Darfur.
What next?
In the inancial programming period 2007–13, the EU’s external assistance, including pre-accession aid to candidate and potential candidates, will be brought together under one single heading, namely ‘he EU as a global player’.
externAl Action
Promoting peace and prosperity beyond the Union’s borders
Commitments: EUR 44 555 million Commitments: EUR 5 724 million + 5.2 % from 2005
(1.1. Allocation of expenditure by heading)
externAl Action expenditUre 2000–06
(total commitments, million EUR)
0 6 000 5 000 4 000 3 000 1 000 2 000
2000 2001 2002 2003 2004 2005 2006
In addition to development aid entered in the EU budget, EU countries collect their aid contribu-tions to ACP States under a single umbrella, name-ly the European Development Fund (EDF), which is also managed by the European Commission. This joint effort results in a better distribution and management of development aid coming from the EU countries.
In 2006, the EDF included some EUR 3.5 billion for 77 ACP States.
European Development Fund
the eU AS A globAl pAyer
(in current prices, EUR million)
10 000
8 000
6 000
pre-AcceSSion StrAtegy
Helping potential members get closer to the EU
Commitments: EUR 44 555 million Commitments: EUR 2 692 million + 29.4 % from 2005
he inancial framework 2000–06 was essential in bringing candidate countries closer to EU member-ship and actually integrating 10 new members into the Union in May 2004.
he 2006 budget provided the last pre-accession aid to the acceding countries Bulgaria and Romania, which joined the Union on 1 January 2007.
A total of EUR 1 700 million was available for Bulgaria and Romania to help with their eforts before their ac-cession. Some EUR 875 million of this total came from Phare (institution building, economic and social cohe-sion, transposition of the EU acquis), EUR 275 million from Sapard (rural and agricultural development) and another EUR 550 million from ISPA (environment and transport infrastructures).
Croatia has also beneited from these three pre-acces-sion instruments (Phare: EUR 80 million, ISPA: EUR 35 million, Sapard: EUR 25 million) and continued to be eligible for funds under the CARDS (1) regional
programme. In line with the new accession partner-ship agreed in February 2006, EU assistance to Croatia is not only geared to foster economic and social devel-opment but also to better prepare the country for the technical and administrative aspects of EU member-ship.
Pre-accession aid to Turkey amounted to EUR 460 million in 2006, including technical assistance aid TAIEX (technical assistance and information ex-change for institution building) and other aid from horizontal programmes. In addition to institution building and economic and social development, EU funds were used in developing civil society dialogue and in strengthening the rule of law in Turkey.
An ad hoc inancial instrument under this heading started channelling assistance to the Turkish commu-nity in Cyprus. In October 2006, the Council approved the irst part of the EU aid programme to the Turkish Cypriot community, amounting to some EUR 120 million, of which EUR 38.1 million was made available for six speciic projects, including projects on solid waste management, energy sector management and private sector development as well as a feasibility study for the rehabilitation of the Leke mining area.
he EU’s Solidarity Fund mobilised EUR 92 million to help Romania cope with severe looding.
What next?
Starting in 2007, EU aid to candidate countries Croatia, the former Yugoslav Republic of Macedonia and Tur-key, and potential candidate countries in the western Balkans will be granted through the Instrument for Pre-accession (IPA) under the new heading 4 ‘he EU as a global player’ (2), which will inance the Union’s
activities beyond its borders.
(1.1. Allocation of expenditure by heading)
Alloc
ation of e
xpenditur
e
Sec
tion
i
Running the Union
‘Administration’ covers the expenditure of all EU in-stitutions, such as salaries and pensions of the staf, buildings and infrastructure, information technology activities and security. In 2006, EUR 6.7 billion was available under this heading, representing less than 6 % of total spending. Despite recent enlargements and the related increases in human resources, the share of administrative expenditure has remained and will remain stable at around this level.
Helping new members with their irst payments to the EU budget
Following the conclusions of the Copenhagen Council in 2002, a new heading ‘Compensation’ was inserted into the inancial framework 2000–06. New EU coun-tries start paying into the EU budget as of the irst day of their membership. As a large of part of the budget is disbursed through multiannual programmes and projects, they do not receive substantial amounts from the EU budget until much later. To compensate for this time gap, new members beneit from ‘temporary budg-etary compensations’ and ‘special lump-sum cashlow facility’, in accordance with the duration and amounts agreed in accession treaties.
In 2006, nearly EUR 1.1 billion was given as compen-sation to 10 new EU countries, which joined the Union in 2004. his was the last compensation payment for these countries. he compensation payments amount-ed to EUR 1.4 billion in 2004 and EUR 1.3 billion in 2005.
As new members, Bulgaria and Romania will receive EUR 862 million between 2007 and 2009.
Parliament 1 322
Council 592
Commission 3 162
Court of Justice 250
Court of Auditors 113
European Economic
and Social Committee 108
Committee of the Regions 63
European Ombudsman 8
European Data Protection Supervisor 4
Pensions 908
European Schools 127
AdminiStrAtive expenditUre by eU inStitUtion
(commitment appropriations, million EUR)
AdminiStrAtion And compenSAtionS
Scope and limits of the allocation exercise
Allocating expenditure to Member States is merely an accounting exercise that gives a very limited view of the beneits that each Member State derives from the Union.
he Commission has stressed this point on many occasions (1).
his accounting allocation, among other drawbacks, is non-exhaustive and gives no indication of many of the other beneits gained from EU policies such as those relating to the internal market and economic integra-tion, not to mention political stability and security.
1.2.
Allocation of expenditure by member State
(1) A full statement on this policy and its rationale has been made in Chapter 2 of the 1998 Commission report, ‘Financing of the
European Union’ (as available on: http://ec.europa.eu/budget/documents/agenda_2000_reports_inancing_en.htm), and in ‘Budget contributions, EU expenditure, budgetary balances and relative prosperity of the Member States’, paper presented by President Santer to the Ecoin Council of 13 October 1997. The Presidency conclusions of the Berlin European Council of 24 and 25 March 1999 endorse this principle: ‘…it is recognised that the full beneits of Union membership cannot be measured solely in budgetary terms’. Point 68 of the Presidency conclusions).
(2) Payments made from EUR 111 218.7 million of payments appropriations (i.e. from the sum of EUR 107 378.5 million year’s
appropriations, EUR 1 425.3 million carry-overs and EUR 2 415.0 million assigned revenue).
Year of reference:executed and allocated expenditure are actual payments made during a financial year, pur-suant either to that year’s appropriations or to carry-overs of non-utilised appropriations from the previous year. Expenditure financed from earmarked revenue is presented separately, except for the payments made under EFTA appropriations, which cannot be isolated in the central accounting system of the Commission (ABAC).
Allocation of expenditure:based on the criteria used for the UK correction, i.e. all expenditure must possi-bly be allocated, except for external actions, pre- accession strategy (if paid to the EU-15), guarantees, reserves, and expenditure under earmarked revenue.
Allocation by Member State: expenditure is allocated to the country in which the principal recipient resides, on the basis of the information available in ABAC. Some expenditure is not (or is improperly) allocated in ABAC, due to conceptual difficulties. In this case, whenever obtained from the corresponding services, additional information is used (e.g. for Galileo, re-search and administration).
See notes in Annex 4 for further details on the meth-odology used for the allocation of expenditure.
Methodology
Allocation of expenditure
In 2006, total executed EU expenditure amounted to EUR 106 575.5 million (2), of which EUR 97 443.4
million (i.e. 91.4 %) was allocated to Member States and EUR 6 080.6 million to third countries. he corresponding 2005 igures were EUR 104 835.2 million, EUR 96 178.1 million (91.7 %) and EUR 5 631.0 million.
In 2006, EU expenditure allocated to third countries concerned: external actions (EUR 4 217.3 million), the pre-accession strategy (EUR 1 351.8 million), research expenditure (EUR 291.2 million) and other (EUR 220.3 million). he corresponding 2005 igures were EUR 4 036.3 million, EUR 1 139.5 million, EUR 224.5 million and EUR 230.7 million.
he 2006 EU expenditure which was not allocated falls into the following categories:
— expenditure inanced from earmarked revenue (which mainly beneits third countries): EUR 800.2 million;
— reserves (EUR 127.6 million) and part of external actions (EUR 819.9 million) and of the pre-acces-sion strategy (EUR 63.0 million);
Alloc
ation of e
xpenditur
e
Sec
tion
i
Allocation by Member State
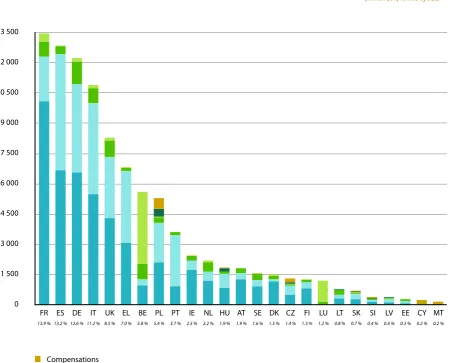
In absolute terms, in 2006 France is the largest recipi-ent of EU expenditure ahead of Spain (which was irst in 2003, 2004 and 2005, but is second in 2006 on ac-count of lower Structural Funds payments). As in 2004 and 2005, Germany is in third position, Italy in fourth and then follow the UK, Greece and Belgium (when including administrative expenditure).
Poland is in eighth position, as in 2005, yet with a much higher share of total allocated expenditure (5.4 % in 2006, as compared to 4.2 % in 2005). hen follow, as in 2004 and 2005, Portugal, Ireland and the Netherlands. Hungary is then in 12th position, up from 15th posi-tion in 2005.
[image:22.595.75.527.210.573.2]See Figure 1 and tables in annex for further details.
FigUre 1 — 2006 eU expenditUre by heAding And by member StAte
(million EUR, ranked by size)
13 500 12 000 10 500 9 000 7 500 6 000 4 500 3 000 1 500 0 FR 13.9 % ES 13.2 % DE 12.6 % IT 11.2 % UK 8.5 % EL 7.0 % BE 5.8 % PL 5.4 % PT 3.7 % IE 2.5 % NL 2.2 % HU 1.9 % AT 1.9 % SE 1.6 % DK 1.5 % CZ 1.4 % FI 1.3 % LU 1.2 % LT 0.8 % SK 0.7 % SI 0.4 % LV 0.4 % EE 0.3 % CY 0.2 % MT 0.2 % Compensations Pre-accession strategy Administration Internal policies Structural actions
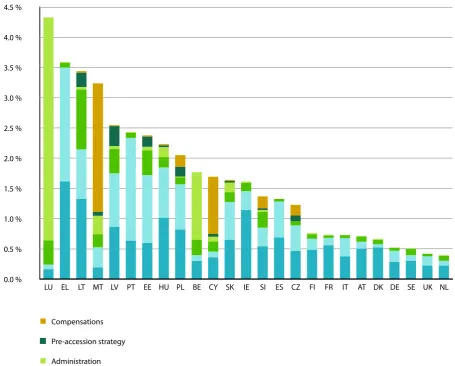
In 2006, the ratio of EU allocated expenditure on GNI:
— reached 3.59 % in Greece ahead of 3.45 % in Lithua-nia (in 2005, Greece was second and LithuaLithua-nia irst). hen follow, as in 2005, Malta (3.25 %), Latvia (2.56 %), Portugal (2.44 %) and Estonia (2.39%);
— was between 1.63 % and 2.22 % in Hungary, Poland, Cyprus, Slovakia and Ireland;
— reached 1.38 % for Slovenia, 1.34 % for Spain and 1.24 % for the Czech Republic;
— was between 0.40 % and 0.76 % for Finland, Italy, France, Austria, Denmark, Germany, Sweden, the United Kingdom and the Netherlands.
For Belgium and Luxembourg, the ratio was respec-tively 1.78 % and 4.34 % when including administra-tive expenditure, and 0.65 % when excluding adminis-trative expenditure.
[image:23.595.69.525.266.632.2]See Figure 2 for further details.
FigUre 2 — 2006 eU expenditUre by heAding And by member StAte
(% GNI, ranked by size)
4.5 %
4.0 %
3.5 %
3.0 %
2.5 %
2.0 %
1.5 %
1.0 %
0.5 %
0.0 %
LU EL LT MT LV PT EE HU PL BE CY SK IE SI ES CZ FI FR IT AT DK DE SE UK NL
Compensations
Pre-accession strategy
Administration
Internal policies
Structural actions
Alloc
ation of e
xpenditur
e
Sec
tion
i
As in 2003, 2004 and 2005, in 2006 France is the larg-est recipient of EU agricultural expenditure ahead of Spain and Germany (Germany was second and Spain third in 2003 and 2005).
hen follow Italy, the United Kingdom and Greece. Poland is in seventh position, up from the eighth posi-tion in 2005.
AgricUltUre (inclUding rUrAl development)
[image:24.595.74.528.309.723.2](1.2. Allocation of expenditure by member State)
FigUre 3 — 2006 eU AgricUltUre (inclUding rUrAl development) expenditUre by member StAte
(% EU, ranked by size)
FR 20.3 %
DE 13.2 %
IT 11 %
UK . %
EL 6.2 % PL 4.3 %
AT 2.6 %
OTHER 1 %
lv, Si 0.3 %
ee 0.2 %
lU, cy 0.1 %
mt <0.1 %
SK 0.6 %
LT 0.6 %
CZ 1 %
FI 1.6 %
HU 1. %
SE 1.9 %
PT 1.9 %
BE 1.9 %
DK 2.3 %
NL 2. %
IE 3. % Additional information on the evolution of the
alloca-tion of EU expenditure in each Member State for the period 2000–06 is included in tables available on the Internet (on the following link: http://ec.europa.eu/ budget/publications/in_reports_en.htm).
Spain is by far the largest recipient of EU structural actions expenditure in 2006, just as in 2001–05, but at a much lower level than in recent years. hen follow Italy, Germany (Germany was second and Italy third in 2004 and 2005), Greece, the United Kingdom, Portugal and France.
Poland remains in eighth position, as in 2004 and 2005 yet with a much higher share of total structural actions allocated expenditure (6.0 % in 2006, as compared to 2.4 % in 2005).
StrUctUrAl ActionS
[image:25.595.71.528.235.639.2](1.2. Allocation of expenditure by member State)
FigUre 4 — 2006 eU StrUctUrAl ActionS expenditUre by member StAte
(% EU, ranked by size)
ES 1. %
IT 14 %
DE 13.6 %
EL 11.1 %
UK 9.3 %
PT . % PL 6 %
HU 2.1 %
OTHER 0.2 %
lU, cy,mt 0.1 %
IE 1. %
NL 1.4 %
CZ 1.4 %
FI 1 %
BE 1 %
SE 1 %
AT 0.9 %
SK 0. %
LT 0.6 %
EE 0.4 %
LV 0.4 %
DK 0.4 %
SI 0.3 %
Alloc
ation of e
xpenditur
e
Sec
tion
i
As far as internal policies expenditure is concerned, Germany (15.2 % of the EU total) is the largest recipi-ent in 2006, just as in 2002–05.
hen come the United Kingdom, Belgium, Italy and France with a share between 10.0 % and 11.1 % of the EU total.
A third group comprises Spain and the Netherlands, above 5.0 % of the EU total, as in 2003–05.
Individual Member State’s share of internal policies may increase notably when substantial payments are made under the EU Solidarity Fund or for certain pol-icies (such as nuclear decommissioning). his was the case: in 2002 for Germany and Austria (looding), and to a lesser extent in 2003 for Portugal (drought and forest ires), in 2004 for Spain, France and Italy (forest ires and/or looding), in 2005 for Slovakia (storm), in 2004–05 for Slovakia and in 2004–06 for Lithuania (funds for the decommissioning of the Ignalina and Bohunice nuclear plants) and in 2006 for Austria (looding).
internAl policieS
[image:26.595.67.526.320.728.2](1.2. Allocation of expenditure by member State)
FigUre 5 — 2006 eU internAl policieS expenditUre by member StAte
(% EU, ranked by size)
IT 10.1 %
FR 10 %
ES % SE 4.3 % PL 3.6 % AT 3.1 %
LT 3.1 %
IE 2. %
DK 2.2 %
EL 2.0 %
HU 1. %
PT 1. %
FI 1.6 %
LU 1. %
SI 1.1 %
LV 0. %
SK 0. %
CZ 0. %
EE 0. %
CY 0.3 %
MT 0.1 %
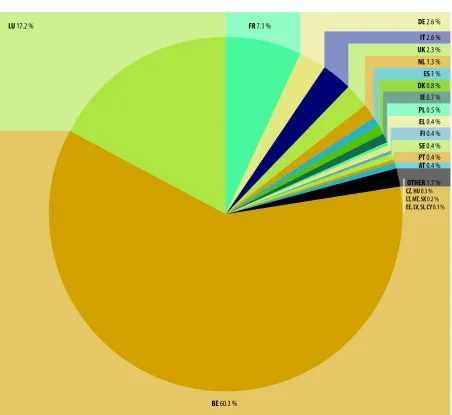
As in 2001–05, Belgium and Luxembourg were respec-tively allocated in 2006 around 60 % and 20 % of EU administrative expenditure.
France is in third position, with around 5 %, as in 2000 and 2003–05 (while it received around 10 % in 2001 and 2002 mainly on account of expenditure in respect of the European Parliament building in Strasbourg).
AdminiStrAtion
[image:27.595.73.526.202.617.2](1.2. Allocation of expenditure by member State)
FigUre 6 — 2006 eU AdminiStrAtive expenditUre by member StAte
(% EU, ranked by size)
BE 60.3 %
LU 1.2 % FR .1 % DE 2.6 %
OTHER 1. %
cZ,hU 0.3 %
lt,mt, SK 0.2 %
ee,lv, Si, cy 0.1 %
IT 2.6 %
UK 2.3 %
NL 1.3 %
ES 1 %
DK 0. %
IE 0. %
PL 0. %
EL 0.4 %
FI 0.4 %
SE 0.4 %
PT 0.4 %
Alloc
ation of e
xpenditur
e
Sec
tion
i
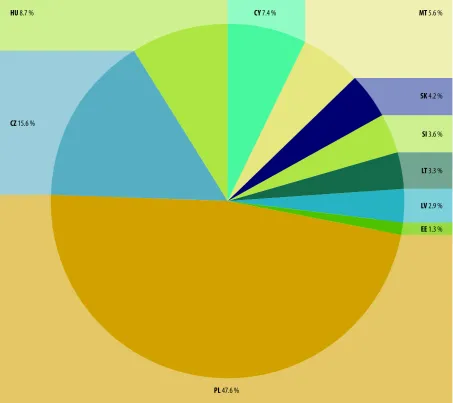
As in 2004 and 2005, the entirety of the budgetary compensations for the Czech Republic, Estonia, Cy-prus, Latvia, Lithuania, Hungary, Malta, Poland, Slov-enia and Slovakia (EU-10), agreed in the Copenhagen accession negotiations was executed in 2006 for a total of EUR 1 073.5 million, while EUR 7.2 million was paid under the pre-accession strategy for Malta and Cyprus, as well as EUR 828.1 million to the EU-10 Member States under the ISPA, Sapard and Phare pro-grammes.
A total of EUR 1 908.8 million of compensation and pre-accession strategy was thus paid in 2006 to the EU-10 Member States. As in 2004 and 2005, the largest recipient in 2006 was Poland followed by the Czech Republic and Hungary.
pre-AcceSSion StrAtegy And compenSAtionS
[image:28.595.71.525.286.689.2](1.2. Allocation of expenditure by member State)
FigUre 7 — 2006 eU pre-AcceSSion StrAtegy And compenSAtionS
(% EU, ranked by size)
PL 4.6 %
HU . % CY .4 % MT .6 %
SK 4.2 %
SI 3.6 %
LT 3.3 %
LV 2.9 %
EE 1.3 %
million EUR 1. A g ricultur e (including rur al de v elopmen t) 2. S truc tur al ac tions 3. In ternal policies 4. Ex ternal ac tion 5. A dministr a tion 6. R eser v es 7. P re -ac cession str a tegy 8. C ompensa tions Total e xpenditur e
BE 956.1 310.4 784.4 0.0 3 574.2 0.0 0.0 0.0 5 625.1 5.8 %
CZ 498.3 463.6 55.9 0.0 15.2 0.0 95.2 201.9 1 330.0 1.4 %
DK 1 164.8 124.9 163.8 0.0 48.3 0.0 0.0 0.0 1 501.9 1.5 %
DE 6 566.9 4 388.3 1 130.6 0.0 156.6 0.0 0.0 0.0 12 242.4 12.6 %
EE 75.6 142.5 50.5 0.0 7.3 0.0 20.8 3.3 300.0 0.3 %
EL 3 071.2 3 590.5 148.0 0.0 24.0 0.0 0.0 0.0 6 833.7 7.0 %
ES 6 681.4 5 767.0 375.3 0.0 59.4 0.0 0.0 0.0 12 883.0 13.2 %
FR 10 091.7 2 235.4 745.5 0.0 423.6 0.0 0.0 0.0 13 496.2 13.9 %
IE 1 736.4 475.5 209.4 0.0 40.5 0.0 0.0 0.0 2 461.8 2.5 %
IT 5 486.0 4 531.0 753.5 0.0 151.8 0.0 0.0 0.0 10 922.3 11.2 %
CY 51.4 14.7 22.3 3.9 10.7 0.0 2.4 134.1 239.6 0.2 %
LV 136.6 140.6 61.5 0.0 8.1 0.0 51.9 3.9 402.6 0.4 %
LT 308.8 191.8 227.5 0.0 9.3 0.0 55.2 7.2 799.8 0.8 %
LU 46.3 20.8 110.5 0.0 1 017.2 0.0 0.0 0.0 1 194.8 1.2 %
HU 840.9 691.2 128.1 0.0 16.4 0.0 133.5 31.9 1 842.2 1.9 %
MT 9.4 16.3 10.4 3.3 14.8 0.0 0.0 102.9 157.0 0.2 %
NL 1 220.1 463.9 429.4 0.0 77.0 0.0 0.0 0.0 2 190.4 2.2 %
AT 1 274.9 304.5 229.0 0.0 21.7 0.0 0.0 0.0 1 830.1 1.9 %
PL 2 141.6 1 950.8 275.0 0.0 29.8 0.0 394.0 514.3 5 305.6 5.4 %
PT 951.3 2 533.9 127.2 0.0 22.3 0.0 0.0 0.0 3 634.8 3.7 %
SI 159.9 91.0 78.5 0.0 7.8 0.0 7.9 61.0 406.0 0.4 %
SK 277.5 268.0 60.5 0.0 10.0 0.0 67.3 13.0 696.2 0.7 %
FI 818.2 316.7 121.9 0.0 23.6 0.0 0.0 0.0 1 280.4 1.3 %
SE 924.6 308.3 317.9 0.0 22.7 0.0 0.0 0.0 1 573.4 1.6 %
UK 4 307.8 3 021.4 829.3 0.0 135.6 0.0 0.0 0.0 8 294.2 8.5 %
EU-25 49 797.7 32 363.0 7 445.8 7.2 5 928.0 0.0 828.1 1 073.5 97 443.4 100 %
Non-EU 0.9 1.6 371.3 4 217.3 137.7 0.0 1 351.8 0.0 6 080.6
Other 0.1 15.8 719.3 819.9 505.6 127.6 63.0 0.0 2 251.3
Earmarked 0.0 18.9 477.3 141.8 128.5 0.0 33.8 0.0 800.2
Total 49 798.8 32 399.3 9 013.7 5 186.2 6 699.7 127.6 2 276.7 1 073.5 106 575.5
>>>
Alloc
ation of e
xpenditur
e
Sec
tion
i
% by Member State % of Gross National Income (GNI)
1. A g ricultur e (including rur al de v elopmen t) 2. S truc tur al ac tions 3. In ternal policies 5. A dministr a tion 7 ., 8 . P re -a cc e ss io n & C o m p e n sa ti o n s Total e xpenditur e 1. A g ricultur e (including rur al de v elopmen t) 2. S truc tur al ac tions 3. In ternal policies 5. A dministr a tion 7 ., 8 . P re -a cc e ss io n & C o m p e n sa ti o n s Total e xpenditur e
BE 17.0 % 5.5 % 13.9 % 63.5 % 0.0 % 100 % 0.30 % 0.10 % 0.25 % 1.13 % 0.00 % 1.78 %
CZ 37.5 % 34.9 % 4.2 % 1.1 % 22.3 % 100 % 0.46 % 0.43 % 0.05 % 0.01 % 0.28 % 1.24 %
DK 77.6 % 8.3 % 10.9 % 3.2 % 0.0 % 100 % 0.52 % 0.06 % 0.07 % 0.02 % 0.00 % 0.67 %
DE 53.6 % 35.8 % 9.2 % 1.3 % 0.0 % 100 % 0.28 % 0.19 % 0.05 % 0.01 % 0.00 % 0.53 %
EE 25.2 % 47.5 % 16.8 % 2.4 % 8.0 % 100 % 0.60 % 1.13 % 0.40 % 0.06 % 0.19 % 2.39 %
EL 44.9 % 52.5 % 2.2 % 0.4 % 0.0 % 100 % 1.62 % 1.89 % 0.08 % 0.01 % 0.00 % 3.59 %
ES 51.9 % 44.8 % 2.9 % 0.5 % 0.0 % 100 % 0.70 % 0.60 % 0.04 % 0.01 % 0.00 % 1.34 %
FR 74.8 % 16.6 % 5.5 % 3.1 % 0.0 % 100 % 0.56 % 0.12 % 0.04 % 0.02 % 0.00 % 0.75 %
IE 70.5 % 19.3 % 8.5 % 1.6 % 0.0 % 100 % 1.15 % 0.31 % 0.14 % 0.03 % 0.00 % 1.63 %
IT 50.2 % 41.5 % 6.9 % 1.4 % 0.0 % 100 % 0.37 % 0.31 % 0.05 % 0.01 % 0.00 % 0.74 %
CY 21.5 % 6.1 % 9.3 % 4.5 % 58.6 % 100 % 0.37 % 0.10 % 0.16 % 0.08 % 1.00 % 1.71 %
LV 33.9 % 34.9 % 15.3 % 2.0 % 13.8 % 100 % 0.87 % 0.89 % 0.39 % 0.05 % 0.35 % 2.56 %
LT 38.6 % 24.0 % 28.4 % 1.2 % 7.8 % 100 % 1.33 % 0.83 % 0.98 % 0.04 % 0.27 % 3.45 %
LU 3.9 % 1.7 % 9.2 % 85.1 % 0.0 % 100 % 0.17 % 0.08 % 0.40 % 3.70 % 0.00 % 4.34 %
HU 45.6 % 37.5 % 7.0 % 0.9 % 9.0 % 100 % 1.02 % 0.83 % 0.15 % 0.02 % 0.20 % 2.22 %
MT 6.0 % 10.4 % 6.6 % 9.4 % 67.7 % 100 % 0.19 % 0.34 % 0.22 % 0.31 % 2.20 % 3.25 %
NL 55.7 % 21.2 % 19.6 % 3.5 % 0.0 % 100 % 0.22 % 0.08 % 0.08 % 0.01 % 0.00 % 0.40 %
AT 69.7 % 16.6 % 12.5 % 1.2 % 0.0 % 100 % 0.50 % 0.12 % 0.09 % 0.01 % 0.00 % 0.72 %
PL 40.4 % 36.8 % 5.2 % 0.6 % 17.1 % 100 % 0.83 % 0.75 % 0.11 % 0.01 % 0.35 % 2.05 %
PT 26.2 % 69.7 % 3.5 % 0.6 % 0.0 % 100 % 0.64 % 1.70 % 0.09 % 0.01 % 0.00 % 2.44 %
SI 39.4 % 22.4 % 19.3 % 1.9 % 17.0 % 100 % 0.54 % 0.31 % 0.27 % 0.03 % 0.23 % 1.38 %
SK 39.9 % 38.5 % 8.7 % 1.4 % 11.5 % 100 % 0.65 % 0.63 % 0.14 % 0.02 % 0.19 % 1.63 %
FI 63.9 % 24.7 % 9.5 % 1.8 % 0.0 % 100 % 0.49 % 0.19 % 0.07 % 0.01 % 0.00 % 0.76 %
SE 58.8 % 19.6 % 20.2 % 1.4 % 0.0 % 100 % 0.30 % 0.10 % 0.10 % 0.01 % 0.00 % 0.51 %
UK 51.9 % 36.4 % 10.0 % 1.6 % 0.0 % 100 % 0.22 % 0.16 % 0.04 % 0.01 % 0.00 % 0.43 %
EU-25 51.1 % 33.2 % 7.6 % 6.1 % 2.0 % 100 % 0.44 % 0.28 % 0.07 % 0.05 % 0.02 % 0.85 %
Non-EU 0.00 % 0.00 % 0.00 % 0.00 % 0.05 % 0.05 %
Other 0.00 % 0.00 % 0.01 % 0.00 % 0.01 % 0.02 %
Earmarked 0.00 % 0.00 % 0.00 % 0.00 % 0.00 % 0.01 %
Total 0.44 % 0.28 % 0.08 % 0.06 % 0.07 % 0.93 %
eU budget r
ev
enue in 2006
Sec
tion
ii
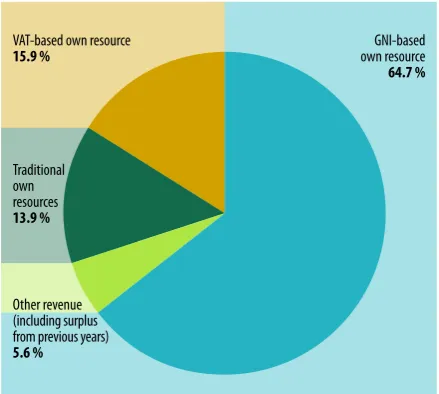
he total amount of the VAT-based resource (includ-ing balances for previous years) levied in 2006 reached EUR 17.2 billion or 15.9 % of total own resources.
he own resource based on gross national income (GNI)
he GNI-based own resource (‘additional fourth re-source’) was introduced in 1988 to balance budget rev-enue and expenditure, i.e. to inance the part of the budget not covered by other revenue. he same per-centage rate is levied on each Member States’ GNI, which is established in accordance with Community rules.
he rate is ixed during the budgetary procedure. he amount of the GNI resource needed depends on the diference between total expenditure and the sum of all other revenue. he 2006 rate of call of GNI amount-ed to 0.6195 % (roundamount-ed igure).
he total amount of the GNI-based resource (includ-ing reserves and balances for previous years) levied in 2006 reached EUR 70.1 billion or 64.7 % of total own resources.
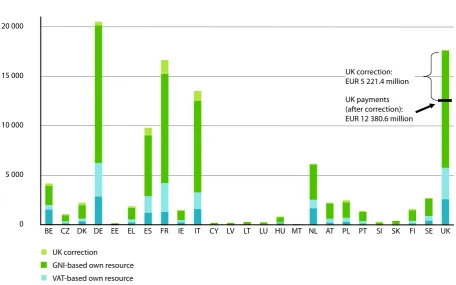
he correction of budgetary imbalances in favour of the United Kingdom (UK correction)
he current UK correction mechanism was introduced in 1985 to correct the imbalance between the United Kingdom’s share in payments to the Community budget and its share in Community expenditure. his mechanism has been modiied on several occasions to compensate for changes in the system of EU budget inancing, but the basic principles remain the same.
he imbalance is calculated as the diference between the UK share in EU expenditure allocated to the Mem-ber States and in total VAT-based and GNI-based own resources payments. he diference in percentage points is multiplied by the total amount of EU expend-iture allocated to the Member States. he UK is reim-bursed by 66 % of this budgetary imbalance.
he cost of the correction is borne by the other 24 Member States. he distribution of the inancing is irst calculated on the basis of each country’s share in total EU GNI. he inancing share of Germany, the Netherlands, Austria and Sweden is, however, restricted to one quarter of its normal value. his cost is redistributed across the remaining 20 Member States.
he total amount of the UK correction paid in 2006 amounted to EUR 5.2 billion.
other revenue
Revenue other than own resources includes: tax and other deductions from EU staf remunerations, bank interest, contributions from non-member countries to certain EU programmes (e.g. in the research area), re-payments of unused EU inancial assistance, interest on late payments as well as the balance from the previ-ous exercise. his balance is mainly derived from the diference between the outturn of own resources pay-ments and expenditure in the previous year.
[image:32.595.185.405.563.760.2]In 2006, other revenue amounted to EUR 6.1 billion, of which EUR 2.4 billion corresponded to the surplus carried over from the year 2005.
FigUre 1 — eU revenUe 2006
Traditional own resources
13.9 %
GNI-based own resource
64.7 %
VAT-based own resource
nAtionAl contribUtion by member StAte And trAditionAl oWn reSoUrceS collected on behAlF oF the eU in 2006 (million EUR)
VAT-based
own resource
GNI-based
own resource
(*)
UK correction
(**)
Total national contribution
Traditional own resources (TOR), net (75 %)
Total own resources
(1) (2) (3) (4) =
(1) + (2) + (3)
% % GNI (5) (6) =
(4) + (5)
% % GNI
BE 453.4 1 932.7 249.2 2 635.2 3.0 % 0.83 % 1 520.9 4 156.1 4.1 % 1.32 %
CZ 173.7 632.5 80.1 886.3 1.0 % 0.82 % 149.0 1 035.3 1.0 % 0.96 %
DK 301.6 1 399.3 168.7 1 869.7 2.1 % 0.84 % 323.3 2 193.0 2.1 % 0.99 %
DE 3 296.4 13 896.4 380.5 17 573.3 20.1 % 0.76 % 2 927.9 20 501.2 20.0 % 0.88 %
EE 21.5 80.3 9.2 111.0 0.1 % 0.88 % 19.3 130.3 0.1 % 1.04 %
EL 317.9 1 162.8 149.0 1 629.7 1.9 % 0.86 % 204.4 1 834.1 1.8 % 0.96 %
ES 1 668.7 6 127.8 805.3 8 601.9 9.9 % 0.90 % 1 197.9 9 799.7 9.6 % 1.02 %
FR 2 906.8 11 026.4 1 420.1 15 353.2 17.6 % 0.85 % 1 282.6 16 635.9 16.3 % 0.92 %
IE 245.1 914.0 120.7 1 279.7 1.5 % 0.85 % 202.3 1 482.0 1.4 % 0.98 %
IT 1 679.8 9 247.3 1 006.3 11 933.5 13.7 % 0.81 % 1 573.3 13 506.8 13.2 % 0.92 %
CY 23.6 86.5 10.7 120.7 0.1 % 0.86 % 32.6 153.3 0.1 % 1.09 %
LV 25.3 95.7 11.6 132.7 0.2 % 0.84 % 22.5 155.1 0.2 % 0.99 %
LT 29.3 145.1 21.4 195.8 0.2 % 0.84 % 38.0 233.8 0.2 % 1.01 %
LU 36.9 142.5 18.9 198.3 0.2 % 0.72 % 18.9 217.2 0.2 % 0.79 %
HU 115.7 501.3 61.3 678.3 0.8 % 0.82 % 104.2 782.5 0.8 % 0.95 %
MT 7.7 28.3 3.4 39.4 0.0 % 0.82 % 10.8 50.2 0.0 % 1.04 %
NL 887.1 3 497.1 102.8 4 487.1 5.1 % 0.82 % 1 644.4 6 131.5 6.0 % 1.12 %
AT 385.4 1 557.2 71.4 2 013.9 2.3 % 0.79 % 195.3 2 209.2 2.2 % 0.87 %
PL 414.9 1 563.4 196.2 2 174.6 2.5 % 0.84 % 272.0 2 446.6 2.4 % 0.94 %
PT 226.4 909.4 124.8 1 260.7 1.4 % 0.85 % 117.8 1 378.4 1.3 % 0.92 %
SI 47.8 174.6 21.4 243.8 0.3 % 0.83 % 35.3 279.1 0.3 % 0.95 %
SK 58.6 254.8 33.1 346.5 0.4 % 0.81 % 55.0 401.6 0.4 % 0.94 %
FI 246.8 1 071.2 111.7 1 429.6 1.6 % 0.85 % 130.3 1 559.9 1.5 % 0.93 %
SE 456.9 1 812.7 28.1 2 297.7 2.6 % 0.75 % 399.9 2 697.7 2.6 % 0.88 %
UK 3 178.8 11 872.7 –5 221.4 9 830.2 11.3 % 0.51 % 2 550.5 12 380.6 12.1 % 0.64 %
EU-25 17 206.2 70 132.0 -15.3 87 322.9 100 % 0.77 % 15 028.3 102 351.2 100 % 0.90 %
% 16.8 % 68.5 % 0.0 % 85.3 % 14.7 % 100 %
(*) For simplicity of the presentation, the GNI-based own resource includes the JHA adjustment.
eU budget r
ev
enue in 2006
Sec
tion
ii FigUre 2 — eU revenUe 1997-2006
(million EUR)
110 000
1997
Other revenue (including surplus from the previous years) GNP/GNI-based own resource
VAT-based own resource Traditional own resources 100 000
90 000
80 000
70 000
60 000
50 000
40 000
30 000
20 000
10 000
0
[image:34.595.73.529.83.457.2]1998 1999 2000 2001 2002 2003 2004 2005 2006
FigUre 3 — nAtionAl contribUtion by member StAte And tor collected on behAlF oF the eU, in 2006
(million EUR)
20 000
15 000
10 000
5 000
UK correction: EUR 5 221.4 million
[image:34.595.70.527.509.794.2]implemen
ta
tion of the budget
Sec
tion
iii
Accrual-based accounting
(the AbAc project)
In 2006, the Commission produced the irst set of accrual-based accounts, covering the year 2005, and submitted them to the Court of Auditors, who examined them and concluded that they represented a true and fair picture of the inancial situation of the Commission, subject to some observations.
Work continued within the Commission to continue to improve various aspects of accounting systems. Ac-counting controls were reinforced and all directorates-general and services deployed considerable eforts to estimate the accrued revenue and expenditure at the end of the inancial year on a coherent and consistent basis. In order to improve the accounting environment in each DG over the medium term, an ‘accounting quality’ project was developed during 2006. he objec-tive of this project is to explain to the authorising serv-ices how best to use the tools made available to them, and the controls which enable them to guarantee the quality of the accounts of the operations managed by them.
During 2006, the Commission carried out in-depth checks of the accounting systems of nine DGs. his brings the number of services subjected to these checks to 22 over the period 2005/06 and covers the bulk of expenditure incurred by the Commission.
As from 2007, the Commission delegations’ transac-tions have been incorporated into ABAC and the sys-tems have been adapted in order to be fully web-based and to enable delegations to manage local payments as well as manage and book their ixed assets in the cen-tral system. Training has been given to key inancial staf from each delegation. With these achievements, one of the main remaining issues has been addressed, namely that the large number of small services outside the Commission’s headquarters (delegations and rep-resentation oices), to which inancial responsibilities had been decentralised, are now integrated into the central system and may thus fully comply with the ac-counting rules and methods.
AnnexeS
Annex 1 Financial frameworks ...36
Annex 2 Expenditure 1958–2006 by heading ...38
Annex 3 Revenue 1970–2006 by type of resource ...43
Annex 4 Revenue 1970-2006 and expenditure 1976–2006 by Member State ...48
Annex 5 Operating budgetary balances — Methodology and calculation ...62
Annex 6 Evaluation activities ...64
Annex 7 Borrowing and lending activities ...65
3
Commitment appropriations 2000 2001 2002 2003 2004 2005 2006 Total
2000–06
1. Agriculture 41 738 44 530 46 587 47 378 49 305 51 439 52 618 333 595
1(a) Common agricultural policy
37 352 40 035 41 992 42 680 42 769 44 598 45 502 294 928 1(b) Rural development 4 386 4 495 4 595 4 698 6 536 6 841 7 116 38 667
2. Structural actions 32 678 32 720 33 638 33 968 41 035 42 441 44 617 261 097
Structural Funds 30 019 30 005 30 849 31 129 35 353 37 247 38 523 233 125 Cohesion Fund 2 659 2 715 2 789 2 839 5 682 5 194 6 094 27 972
3. Internal policies 6 031 6 272 6 558 6 796 8 722 9 012 9 385 52 776
4. External action 4 627 4 735 4 873 4 972 5 082 5 119 5 269 34 677
5. Administration (1) 4 638 4 776 5 012 5 211 5 983 6 185 6 528 38 333
6. Reserves 906 916 676 434 442 446 458 4 278
Monetary reserve 500 500 250 0 0 0 0 1 250 Emergency aid reserve 203 208 213 217 221 223 229 1 514 Guarantee reserve 203 208 213 217 221 223 229 1 514
7. Pre-accession strategy 3 174 3 240 3 328 3 386 3 455 3 472 3 566 23 621
8. Compensations 1 410 1 305 1 074 3 789
Total commitment appropriations 93 792 97 189 100 672 102 145 115 434 119 419 123 515 752 166
Total payment appropriations 91 322 94 730 100 078 102 767 111 380 114 060 119 112 733 449
as % of GNI 1.07 % 1.07 % 1.09 % 1.11 % 1.09 % 1.08 % 1.08 % 1.08 %
Margin 0.17 % 0.17 % 0.15 % 0.13 % 0.15 % 0.16 % 0.16 % 0.16 %
Own resources ceiling 1.24 % 1.24 % 1.24 % 1.24 % 1.24 % 1.24 % 1.24 % 1.24 %
(1) The expenditure on pensions included under the ceiling for this heading is calculated net of staf contributions to the
[image:39.842.397.801.106.351.2]pension scheme, up to a maximum of EUR 1 100 million at 1999 prices for the period 2000–06.
tAble 1: FinAnciAl FrAmeWorK (2000–06) AdjUSted For 2006
(million EUR – current prices)
Commitment appropriations 2007 2008 2009 2010 2011 2012 2013 Total
2007–13
1. Sustainable growth 54 405 56 736 59 197 61 144 63 601 66 640 69 678 431 401
1(a) Competitiveness for growth and employment
8 918 9 847 10 769 11 750 12 974 14 239 15 490 83 987 1(b) Cohesion for growth
and employment
45 487 46 889 48 428 49 394 50 627 52 401 54 188 347 414
2. Preservation and management of natural resources
58 351 58 800 59 252 59 726 60 191 60 663 61 142 418 125
of which: market-related expenditure and direct payments
45 759 46 217 46 679 47 146 47 617 48 093 48 574 330 085
3. Citizenship, freedom, security and justice
1 273 1 362 1 523 1 693 1 889 2 105 2 376 12 221
3(a) Freedom, security and justice
637 747 872 1 025 1 206 1 406 1 661 7 554 3(b) Citizenship 636 615 651 668 683 699 715 4 667
4. EU as a global player 6 578 7 002 7 440 7 893 8 430 8 997 9 595 55 935
5. Administration (1) 7 039 7 380 7 699 8 008 8 334 8 670 9 095 56 225
6. Compensations 445 207 210 862
Total commitment appropriations 128 091 131 487 135 321 138 464 142 445 147 075 151 886 974 769
as % of GNI 1.07 % 1.06 % 1.04 % 1.02 % 1.01 % 1.00 % 1.00 % 1.03 %
Total payment appropriations 123 790 129 481 123 646 133 202 133 087 139 908 142 180 925 294
as % of GNI 1.04 % 1.04 % 0.95 % 0.98 % 0.94 % 0.95 % 0.93 % 0.98 % Margin 0.20 % 0.20 % 0.29 % 0.26 % 0.30 % 0.29 % 0.31 % 0.26 % Own resources ceiling 1.24 % 1.24 % 1.24 % 1.24 % 1.24 % 1.24 % 1.24 % 1.24 %
(1) The expenditure on pensions included under the ceiling for this heading is calculated net of the staf contributions to the relevant
scheme, within the limit of EUR 500 million at 2004 prices for the period 2007–13.
tAble 2: FinAnciAl FrAmeWorK (2007–13) AdjUSted For 2008
[image:39.842.42.447.108.374.2]39
commUnity expenditUre 1958–2006 (continued)
(Outturn in payments)
Heading
EU-6 EU-9
1966 1967 1968 1969 1970 1971 1972 1973 1974 1975
million
A.U. %
million
A.U. %
million
A.U. %
million
A.U. %
million
A.U. %
million
A.U. %
million
A.U. %
million
A.U. %
million
A.U. %
million
A.U. %
General budget
EAGGF Guarantee Section 50.7 12.9 % 340.0 45.5 % 1 259.7 77.4 % 1 668.6 80.8 % 3 108.1 86.9 % 1 755.6 72.8 % 2 485.6 75.2 % 3 614.4 76.8 % 3 459.8 68.4 % 4 327.7 70.9 %
Structural Funds, of which: 22.1 5.6 % 81.1 10.8 % 58.5 3.6 % 70.8 3.4 % 95.4 2.7 % 118.0 4.9 % 136.9 4.1 % 259.1 5.5 % 281.8 5.6 % 375.3 6.2 %
— EAGGF Guidance Section 34.0 2.1 % 51.3 2.5 % 58.4 1.6 % 61.5 2.6 % 53.2 1.6 % 10.8 0.2 % 37.8 0.7 % 76.7 1.3 %
— ERDF 150.0 2.5 %
— ESF 24.5 1.5 % 19.5 0.9 % 37.0 1.0 % 56.5 2.3 % 83.7 2.5 % 248.3 5.3 % 244.0 4.8 % 148.6 2.4 %
Research 73.4 4.5 % 59.2 2.9 % 63.4 1.8 % 64.9 2.7 % 76.3 2.3 % 70.1 1.5 % 110.3 2.2 % 115.9 1.9 %
External action 0.9 0.2 % 0.8 0.1 % 1.0 0.1 % 1.0 0.0 % 1.4 0.0 % 0.4 0.0 % 71.8 2.2 % 63.3 1.3 % 358.5 7.1 % 250.9 4.1 %
Administration 50.9 12.9 % 53.7 7.2 % 94.7 5.8 % 104.3 5.0 % 115.3 3.2 % 137.8 5.7 % 173.6 5.3 % 245.3 5.2 % 306.2 6.1 % 364.0 6.0 %
Other 0.6 0.5 0.1 % 0.6 0.0 % 0.9 0.0 % 1.6 0.0 % 130.4 5.4 % 178.1 5.4 % 253.0 5.4 % 309.8 6.1 % 383.1 6.3 %
Total payments 125.2 31.8 % 476.1 63.7 % 1 487.9 91.5 % 1 904.8 92.2 % 3 385.2 94.7 % 2 207.1 91.5 % 3 122.3 94.5 % 4 505.2 95.8 % 4 826.4 95.5 % 5 816.9 95.3 %
In % of MS general government expenditure
0.3 % 0.6 % 1.1 % 1.3 % 2.0 % 1.2 % 1.4 % 1.3 % 1.2 % 1.2 %
In % Community GNI 0.1 % 0.2 % 0.4 % 0.5 % 0.7 % 0.4 % 0.5 % 0.5 % 0.5 % 0.5 %
EDF 108.3 27.5 % 104.6 14.0 % 106.5 6.5 % 115.0 5.6 % 145.6 4.1 % 154.4 6.4 % 131.5 4.0 % 157.8 3.4 % 172.0 3.4 % 208.5 3.4 %
ECSC 31.0 7.9 % 37.7 5.0 % 32.4 2.0 % 45.7 2.2 % 45.6 1.3 % 49.8 2.1 % 51.0 1.5 % 40.5 0.9 % 58.0 1.1 % 76.0 1.2 %
Euratom (*) 129.2 32.8 % 129.5 17.3 %
Grand total 393.7 100 % 747.9 100 % 1 626.8 100 % 2 065.0 100 % 3 516.4 100 % 2 411.3 100 % 3 304.8 100 % 4 703.5 100 % 5 056.4 100 % 6 101.4 100 %
(*) The Euratom budget was incorporated in the general budget in 1968.
40
Annex 2
expenditure 1958–2006 by heading
commUnity expenditUre 1958–2006 (continued)
(Outturn in payments)
Heading
EU-9 EU-10 EU-12
1976 1977 1978 1979 1980 1981 1982 1983 1984 1985 1986
million
A.U. %
million
A.U. %
million
ECU %
million
ECU %
million
ECU %
million
ECU %
million
ECU %
million
ECU %
million
ECU %
million
ECU %
million
ECU %
General budget
EAGGF Guarantee Section 5 636.7 71.4 % 6 587.1 72.6 % 8 679.3 69.4 % 10 387.1 70.3 % 11 291.9 68.6 % 11 063.7 59.7 % 12 259.8 57.6 % 15 785.8 62.1 % 18 330.4 65.4 % 19 727.8 68.4 % 22 118.1 61.7 %
Structural Funds, of which: 623.8 7.9 % 685.5 7.6 % 1 388.7 11.1 % 1 515.5 10.3 % 1 808.5 11.0 % 3 566.8 19.2 % 4 570.1 21.5 % 4 081.3 16.0 % 3 220.0 11.5 % 3 702.9 12.8 % 5 664.7 15.8 %
— EAGGF Guidance Section 112.1 1.4 % 113.0 1.2 % 325.6 2.6 % 286.5 1.9 % 314.6 1.9 % 539.9 2.9 % 650.8 3.1 % 575.3 2.3 % 595.6 2.1 % 685.5 2.4 % 771.2 2.2 %
— ERDF 300.0 3.8 % 400.0 4.4 % 525.0 4.2 % 699.0 4.7 % 793.4 4.8 % 2 406.5 13.0 % 2 905.4 13.6 % 2 306.6 9.1 % 1 412.5 5.0 % 1 610.0 5.6 % 2 456.7 6.9 %
— ESF 211.7 2.7 % 172.5 1.9 % 538.1 4.3 % 530.0 3.6 % 700.5 4.3 % 620.4 3.3 % 1 013.9 4.8 % 1 199.4 4.7 % 1 211.9 4.3 % 1 407.4 4.9 % 2 436.8 6.8 %
Research 127.2 1.6 % 180.8 2.0 % 266.9 2.1 % 267.6 1.8 % 364.2 2.2 % 311.6 1.7 % 437.3 2.1 % 1 345.5 5.3 % 1 660.0 5.9 % 677.9 2.4 % 775.4 2.2 %
External action 202.8 2.6 % 194.1 2.1 % 313.2 2.5 % 443.7 3.0 % 603.9 3.7 % 738.4 4.0 % 891.2 4.2 % 901.3 3.5 % 996.5 3.6 % 963.8 3.3 % 1 057.3 3.0 %
Administration 430.7 5.5 % 501.6 5.5 % 686.6 5.5 % 775.6 5.2 % 829.9 5.0 % 941.8 5.1 % 1 048.2 4.9 % 1 108.2 4.4 % 1 212.9 4.3 % 1 304.8 4.5 % 1 533.9 4.3 %
Other 541.6 6.9 % 586.8 6.5 % 707.1 5.7 % 831.2 5.6 % 958.9 5.8 % 1 103.7 6.0 % 1 263.0 5.9 % 1 283.9 5.0 % 1 681.6 5.9 % 1 490.1 5.2 % 3 526.0 9.8 %
Total payments 7 562.8 95.8 % 8 735.9 96.3 % 12 041.8 96.3 % 14 220.7 96.3 % 15 857.3 96.4 % 17 726.0 95.7 % 20 469.6 96.1 % 24 506.0 96.4 % 27 081.4 96.6 % 27 867.3 96.7 % 34 675.4 96.8 %
In % of MS general government expenditure
1.3 % 1.4 % 1.7 % 1.8 % 1.7 % 1.6 % 1.7 % 1.9 % 1.9 % 1.8 % 2.0 %
In % Community GNI 0.6 % 0.6 % 0.8 % 0.8 % 0.8 % 0.8 % 0.9 % 0.9 % 1.0 % 0.9 % 1.0 %
EDF 248.6 3.1 % 244.7 2.7 % 401.0 3.2 % 465.3 3.1 % 481.9 2.9 % 663.7 3.6 % 647.2 3.0 % 718.8 2.8 % 703.0 2.5 % 698.0 2.4 % 846.7 2.4 %