Int. J. Electrochem. Sci., 12 (2017) 11150 – 11162, doi: 10.20964/2017.12.05
International Journal of
ELECTROCHEMICAL
SCIENCE
www.electrochemsci.org
Short Communication
Effect of Ag Content on Phase Evolution during the De-Alloying
of Ag-Al Alloy: Combining the Electrochemical Noise with the
Wavelet and Analysis
Y. Zhao1. 2, X. Wang1, 3,*, F. Li1, R. W. Zhang1, J. C. Huang3, M. Wu1**
1
School of Mechanical Engineering, Liaoning Shihua University, Fushun 113001, P. R. China
2
Corrosion and protection Laboratory, Key Laboratory of Superlight Materials and Surface Technology (Harbin Engineering University), Ministry of Education, Nantong ST 145, Harbin, 150001, China
3
Department of Materials and Optoelectronic Science, National Sun Yat-Sen University, Kaohsiung 804, Taiwan, R. O. China
*
E-mail: [email protected]
**
E-mail: [email protected]
Received: 4 August 2017 / Accepted: 17 September 2017 / Published: 12 November 2017
De-alloying mechanism of Ag-Al alloys in 5 wt% hydrochloric acid (HCl) was investigated by both microstructure examination and electrochemical noise (EN). The wavelet transform has been used to analyze the EN data. Two phases formed in the Ag-Al alloys: the α-Al as matrix and the γ-Ag2Al
intermetallic phase. The volume fraction of γ-Ag2Al became higher with the increasing of Ag content.
Both α-Al and γ-Ag2Al phases dissolved during the de-alloying process. Based on the energy
distribution plot (EDP) obtained from the EN data, it is demonstrated that the de-alloying ofAg30Al70
was mainly controlled by Al dissolution, which leaded to non-uniform nanoporous structures. For Ag40Al60, it was mainly γ-Ag2Al dissolution, which leaded to coarser nanoporous structures. For the
Ag35Al65near the eutectic point, the de-alloying mechanism was the concurrent uniform dissolution of
α-Al and γ-Ag2Al, which had good effect on the homogeneous diffusion formation of ligament and
nanopore in nanoporous Ag.
Keywords: Nanoporous Ag; De-alloying; Electrochemical Noise; Wavelet;
1. INTRODUCTION
A template method is commonly used to manufacture various nanoporous materials with ordered porous structures. The template method is technically difficult and time-consuming. Instead, deploying, as a simple and effective strategy, is widely used to produce well defined 3D bi-continuous nanoporous structures. The so-called de-alloying is a corrosion process, during which the more negative potential components are dissolved first, remaining the more stable elements simultaneously. Compared with other methods, deploying can provide the maximum flexibility in modulating the microstructure and make the lengthy scale of the porous shrunken from micro to nanometer by composition optimization [4-10].
Recently, Ag and Al have received attention as a substitution of Au due to their cheap cost, high electrical and thermal conductivity, and relatively higher strength [11]. Some de-alloying methods for the fabrication of nanoporous Ag from Ag-Al have been reported [12-15]. Two phases involved in this binary system, namely, the α-Al as matrix and γ-Ag2Al intermetallic phase, with the composition
range of 40-100 at% Al in the Ag-Al phase diagram [16]. Compared with Ag, α-Al and γ-Ag2Al have
lower potential. So the Ag element in α-Al phase may induce the dissolution of Al or γ-Ag2Al forming
in the nanoporous Ag. But the evolution process of Ag nanoporous structure, the formation time of nanoporous structure and the relative energy in formation of nanoporous structure are still not sufficiently clarified.
The electrochemical noise (EN) measurement is a useful technology for monitoring the series of corrosion process [17-21]. During the corrosion process, both electric potential and current fluctuation can supply much information about the corrosion, e.g. the form of the corrosion, the needed energy, and the formation time of different corrosion. So EN has been widely used in monitoring the corrosion processes in stainless steel, magnesium alloy and aluminum alloy. Klapper [22] have considered the influence of the cathodic process on the interpretation of EN signals arising from pitting corrosion of stainless steel. However, using EN signals to analyze the de-alloying and corrosion process of Ag-Al alloys has never been reported.
De-alloying occurs when the alloy loses the active component of the metal and retains more corrosion resistant component in a porous “sponge” on the metal surface. It can also occur by re-deposition of the more corrosion resistant component on the metal surface. In this paper, we will report the evolution process of nanoporous Ag from the Ag-Al alloys with the trace of its EN signals. Ag-Al alloys with different atomic fractions of Ag are used in order to examine the composition effect on the formation mechanism of nanoporous structures.
2. EXPERIMENTAL
Three Ag-Al alloys, Ag30Al70, Ag35Al65, and Ag40Al60 in at%, are prepared by melt spinning.
Alloys of other compositions have also been cast, but the optimum porous foam characters are found to locate within the alloy compositions from Ag30Al70 to Ag40Al60. The cooling rate during melt spinning
that Ag30Al70 is just on the right side of the eutectic point, Ag35Al65 is in the vicinity of eutectic point
almost coincides with it, and Ag40Al60 is further on the left side of the eutectic composition.
From the melt spun ribbons, the specimens with the size of 6 × 20 mm2 were cut. De-alloying of the Ag-Al alloy was carried out in a 5 wt% HCl solution. The test solution remained at the temperature of 60 oC for different periods of time. The as-dealloyed samples were cleaned by distilled water. The de-alloyed nanoporous foams needed to avoid the fragile problem and remain intact due to the open cell high porosity.
X-ray diffraction (XRD) patterns of the starting and de-alloyed Ag-Al alloys were collected in the range of 20-80° with a scanning rate of 4 o/min. The microstructures of the samples and the dissolution of Al and γ-Ag2Al were observed by scanning electron microscopy (SEM). The thin foil
samples for cross-sectional transmission electron microscopy (TEM, Tecnai G2 F20) characterization were fabricated using dual-beam focused-ion-beam (FIB) system (Seiko, SMI3050).
Electrochemical noise measurements were performed with an Auto-lab electrochemical workstation equipped with electrochemical noise module. Two identical specimens were used as the working electrode and a saturated calomel electrode (SCE) as the reference electrode, respectively. The electrochemical current noise was measured as the galvanic. Coupling current between two identical working electrodes (WE) kept at the same potential, and EN data was simultaneously recorded as a function of time for 2500 s. Each set of EN records, containing 400 datum points, was recorded with a datum-sampling interval of 0.25 s. Twenty-five time records were analyzed for each Ag-Al alloy.
Noise data were transformed into the Fast Wavelet Transform algorithm (FWT). To characterize the Fast Wavelet Transform results in more details, the relative energy of each crystal to the overall signal can be estimated by the energy distribution plot (EDP), which is the plot of the relative energy accumulated by each crystal versus the crystal name. The energy of the whole signal is calculated as follows:
N 1 n 2 nX
E
, n=1,…,N .The relative energy associated with each crystal to the overall signal can be calculated as follows:
j 2 / n 1 k 2 k , j d jd
E
1
E
,j=1,2,…,J ,
j 2 / n 1 k 2 k , j s js
E
1
E
.In our study, we can use EDP (Edj and Esj versus crystal) to characterize the de-alloying
3. RESULTS
3.1 Phases transition during the de-alloying process
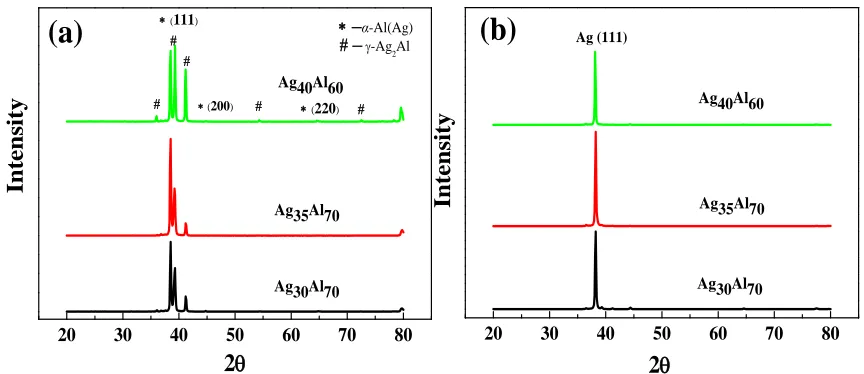
Figure 1. XRD patterns of AgxAl1-x samples under the (a) as melt-spun and (b) de-alloyed in the 5
wt% HCl solution for 30 min.
The XRD patterns of the melt-spun Ag-Al ribbons under the as-spun and de-alloyed conditions are compared in Figure1. According to the XRD results in Figure 1(a), it is clear that the precursor Ag-Al alloys consists of two distinct phases: face centered cubic (FCC) α-Ag-Al (Ag) phase and hexagonal closed packing (HCP) γ-Ag2Al phase, and the volume fraction of the γ-Ag2Al phase appears to be
higher with increasing Ag content. Upon rapid solidification of these alloys, the Al-rich phase is enveloped by the camber-like Ag-rich phase, and the grain size of the two phases is very fine in the range of 90 μm [12]. The XRD patterns of the de-alloyed foams are shown in Figure 1(b). The diffraction peaks show that the α-Al (Ag) and γ-Ag2Al phases gradually disappear, which result in the
final single FCC Ag phase in the fully de-alloyed samples.
3.2 Microstructure evolution during the de-alloying process
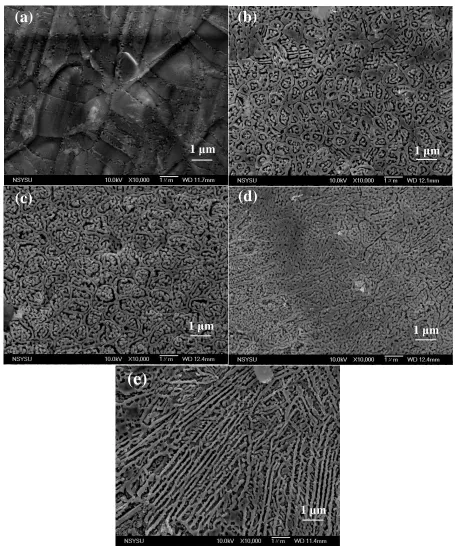
Figure 2 shows the typical SEM images of the Ag30Al70 alloy ribbons de-alloyed in the 5 wt%
HCl solution for 0, 5, 10, 20 and 30 mins. The SEM micrograph of the 5 min samples shown in Figure 2(b) reveals the preferential etching of Al at the grain boundary. With the increasing of de-alloying time, Ag bands with nanoporous structure formed at the surface, which indicated that the samples de-alloyed for a relatively longer time had more defects and cracks than those de-de-alloyed for a short time (Figure 2(c) and (d)). By increasing the de-alloying time, the surface of the Ag30Al70 ribbon sample
starts to exhibit a porous structure with a bi-continuous interpenetrating pore/ligament structure. Upon de-alloying for 30 min shown in Figure 2(e), its microstructure can be characterized by a 3D
bi-20 30 40 50 60 70 80
Ag (111)
2
Int
ensity
Ag30Al70 Ag35Al70 Ag40Al60
(b)
20 30 40 50 60 70 80
(220)
(200)
──α-Al(Ag)-Ag
2Al
Int
ensity
2
Ag30Al70 Ag35Al70 Ag40Al60
[image:4.596.77.509.153.340.2]
continuous network morphology with dramatically larger ligament sizes of 150-300nm as compared with that of pore dimensions 200-400nm.
Figure 2. SEM micrographs of the Ag30Al70 samples under the as-spun and the de-alloyed in the 5
wt% HCl solution for different periods of time: (a) as-melt-spun, (b) 5 min, (c) 10 min, (d) 20 min, (e) 30 min.
(a)
1 μm
(e)
1 μm
(c)
1 μm
(d)
1 μm
(b)
)
)
[image:5.596.70.525.137.683.2]
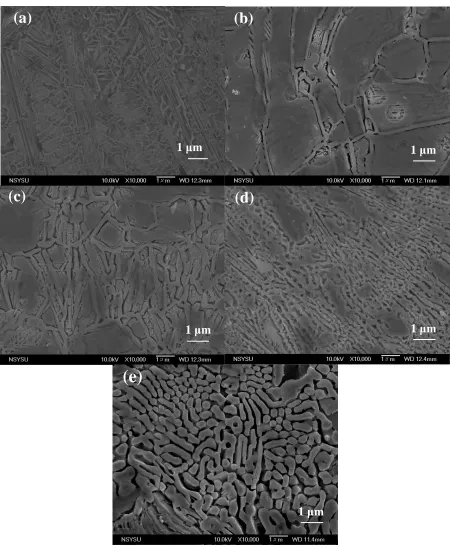
Figure 3. SEM micrographs of the Ag35Al65 samples under the as-spun and the de-alloyed in the 5
wt% HCl solution for different periods of time: (a) as-melt-spun, (b) 5 min, (c) 10 min, (d) 20 min, (e) 30 min.
Figure 3 shows the typical SEM micrographs of the Ag35Al65 ribbons de-alloyed in the 5 wt%
HCl solution for 0, 5, 10, 20 and 30 min. The nanoporous results of Ag35Al65 show larger ligament
sizes of 200-250nm, as compared with that of nanoporous dimensions 200-250nm.
(d)
(c)
(a)
1 μm
1 μm 1 μm
(e)
1 μm
(b)
[image:6.596.86.536.67.614.2]
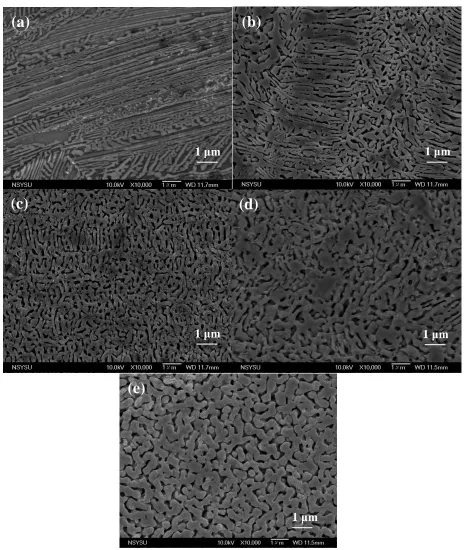
Figure 4. SEM micrographs of the Ag40Al60 samples under the as-spun and the de-alloyed in the 5
wt% HCl solution for different periods of time: (a) as-melt-spun, (b) 5 min, (c) 10 min, (d) 20 min, (e) 30 min.
For the samples de-alloyed for 5min, the band at the surface divided into two kinds of regions: loose regions with more cracks and uniform regions with less cracks (Figure 3 (b)). For the samples de-alloyed for 10 mins, the amount of loose regions significantly increased, and the Ag bands at the surface were cut apart by large cracks (Figure 3 (c)). With the further increase of de-alloying time, the porous structure became bi-continuous, which is good for the property (Figure 3 (d)).
(e)
1 μm
(a)
1 μm
(c)
1 μm
(d)
1 μm
(b)
[image:7.596.66.533.64.614.2]
Figure 4 shows the typical SEM micrographs of the Ag40Al60 ribbons de-alloyed in the 5 wt%
HCl solution for 0, 5, 10, 20 and 30 min. The nanoporous results of Ag40Al60 show larger ligament
[image:8.596.65.527.254.502.2]sizes of 250-500nm, as compared with that of nanoporous dimensions 150-250nm.With the increasing of de-alloying time, the band with continuous corrosion formed, instead of micro crack region or loose region.
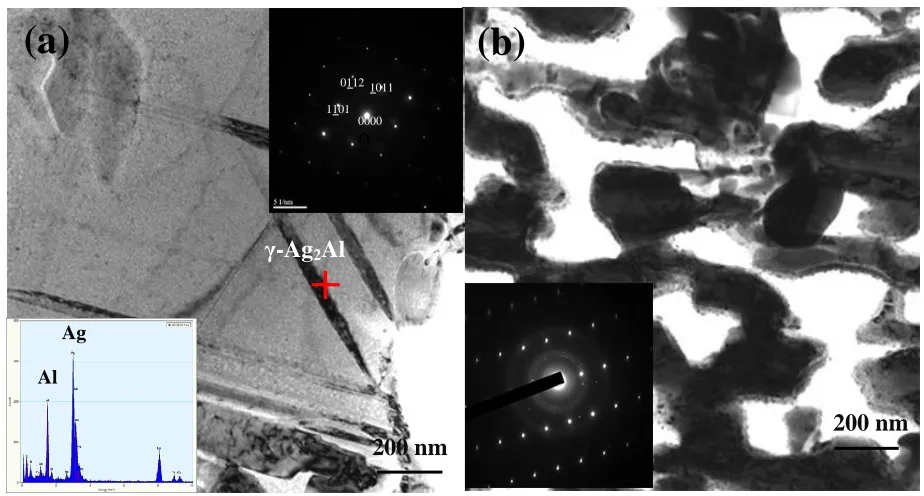
Figure 5 shows the typical TEM images of the Ag35Al65 alloy ribbons de-alloyed in the 5 wt%
HCl solution for 0 and 30 min. The TEM results in Figure 5(a) also reveal that the as-melt-spun sample consists of only two phases. It is consistent with the XRD results in Figure 1(b). De-alloyed for 30 mins, single nanoporous Ag phase is seen in Figure 5(b), with high specific areas. On the surface of ligament, the nano silver particle structure forms.
Figure 5. TEM micrographs of the Ag35Al65 samples under the (a) as melt-spun with the insets of
corresponding SEAD pattern and EDX spectrum; (b) de-alloyed in the 5 wt% HCl solution for 30 min with inset of corresponding SEAD pattern.
3.3 EN characteristics evolution during the de-alloying process
For the Ag30Al70 alloys, when the immersion period was shorter than 1500 s in Figure 6(a), fast
current signal transients were seen, and the potential was gradually increasing. This phenomenon indicated the balance for anodic and cathode reactions on the Ag30Al70 surface. After 1500 s
immersion Figure 6(a), the relationship between potential noise and current noise could be described as: a positive or negative potential noise responded to a negative or positive current noise shift, respectively. It implied the occurrence of pitting corrosion in Ag30Al70. The number of fast transients
was small, reflecting the competition process of meta stable pitting and re-passivation of Ag30Al70
alloys was not actively.
For the Ag35Al65 alloys, during the whole immersion period from 0 to 2500 s, there was no
apparent competition process of meta stable pitting and re-passivation in Figure 6(b). From both the
(b)
200 nm
+
γ-Ag2Al
Ag
Al
0000
0
1101 0112 1011
current signal transients as well as the gradual increase of potential over the entire time period, it is revealed that the main corrosion type and mechanism was uniform and steady corrosion.
For the Ag40Al60 alloys, when the immersion period was shorter than 650 s in Figure 6(c), the
fast current signal transients and the gradually increasing potential were seen. After 650 s immersion, the current noise perturbed positively or negatively in a larger amplitude and higher frequency, while the potential noise shifted negatively or positively respectively. The number of fast transients was huge, implying that meta stable pitting and repassivation of Ag40Al60 proceeded.
Figure 6. Electrochemical noise patterns of the Ag-Al samples as a function of de-alloying time: (a)
Ag30Al70, (b) Ag35Al65, (c) Ag40Al60.
4. DISCUSSION
4.1 Effect of Ag content on the microstructure and phase during de-alloying process
Ag-Al alloys consist of α-Al and γ-Ag2Al phases, and the amount of γ-Ag2Al phases enlarges
with silver content enlarging. Moreover, α-Al is the fastest continuously dissolved phases and γ-Ag2Al
phases dissolve secondly and leaving Ag atoms are at the passive surface, exhibiting smaller nanopores. This fact that the amount of α-Al decreases, but that of γ-Ag2Al increases with increasing Ag content
in the melt-spun alloys has been reported earlier [3].
Furthermore, according to the surface-diffusion controlled coarsening mechanism, the D(s)
should be estimated by the equation:
0 500 1000 1500 2000 2500
-0.012 -0.010 -0.008 -0.006 -0.004 -0.002 0.000 0.002 0.004 0.006 0.008 0.010 Potential noise time (s) E (V) (a) Current noise -0.003 -0.002 -0.001 0.000 0.001 0.002 0.003 i ( A .c m 2 )
0 500 1000 1500 2000 2500
-0.012 -0.010 -0.008 -0.006 -0.004 -0.002 0.000 0.002 0.004 0.006 0.008 0.010 time (s) E (V) Current noise Potential noise (b) -0.0010 -0.0005 0.0000 0.0005 0.0010 0.0015 i ( A .c m 2 )
0 500 1000 1500 2000 2500
[image:9.596.90.522.206.486.2]
4 4
32 )) ( (
ta kT t d DS
Where d(t) is the ligament and pore size at etching time t, k is Boltzmann constant, T is the de-alloying temperature, γ is the surface energy and a is the lattice parameter. In terms of this equation, the diffusivity (D(s)) can be calculated depended on the given dealloying temperature and time. This
equation has been adopted for the explanation of coarsening behavior of Au nanoporous structure during the dealloying [23].
According to the equation, ligament/nanoporous size was affected by many different factors. However, under the same conditions including corrosion medium, temperature and time, the experiment results showed that the ligament/nanoporous size was only affected by surface energy. And the surface energy of Al atom was lower than Ag atom. Thus, the average surface energy decreased with the enlarged amount of Ag content, and lower surface energy would promote the diffusion of the leaving Ag atom and also can provide a facile route to control over the dealloying process and the formation of NPS [24]. Thus, the Ag35Al65 alloys exhibited good effect on the homogeneous diffusion
ligament and nanopores size finer than that of Ag30Al70 and Ag40Al60 alloys, and the results were
consistent with the SEM results. Ag-Al alloy can form the porous structure, because the alloy elements with high activity can be corroded and dissolved into the solution, then the inert elements with high surface diffusion rate can release, diffuse and recombine in long free path range. The Ag nanoporous structure was obviously coarsened with the increasing of Ag content, from 150-300 nm for Ag30Al70 to
250-500 nm for Ag30Al70. The values show much higher than nanoporous Ag under the similar
dealloying conditions [13]. The result also exhibits good agreement with the difference of the ligament/nanoporous size when one or more factors change.
4.2 Effect of Ag content on the energy distribution plot during de-alloying process
There are high-low processes corresponding to smaller and larger time-scales respectively. The time-scale of crystal d can be ranked as an increasing series: d1< d2< …. d7 < d8. The relative energy
distributions for crystals d4–d6, d6–d7 and d8 generally reflect the information about meta stable pitting,
pitting and corrosion diffusion [25-26]. Moreover, the similar researches can be obtained such as Z. Zhang using the electrochemical noise study with EDP analysis to study the 2024-T3 Aluminum alloy corrosion in simulated acid rain under cyclic wet–dry condition [27] and analysis of pitting corrosion behavior of pure Al in sodium chloride solution with the wavelet technique [28]. He found that the corrosion types of the Al alloys could be separated and corrosion mechanism could be clarified.
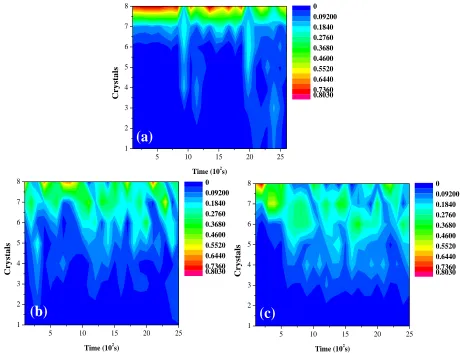
Moreover, the EDP results using the fast wavelet transform are shown in Figure 7. For the Ag30Al70 alloys, it is shown in Figure 7(a) that the main relative energy feature was mainly
accumulated among crystals d7–d8for the immersion period shorter than 1500s. It corresponded that the
electrode surface was mainly undertaking the balance of anodic and cathode reactions. And after 1500s, the relative energy was mainly accumulated among crystals d6–d7; the electrode surface might
corrosion form should be the dissolution of Al mainly. As shown in Figure 3. Al dissolved after de-alloying 1500s, leaving the Ag2Al phases dissolution, resulting in non-uniform nanoporous structures.
For the Ag35Al65 alloys, it is shown that the main relative energy feature was mainly
accumulated among the crystals d7–d8 for the entire immersion period. So the electrode surface was
mainly undertaking the uniform corrosion of γ-Ag2Al and Al phases. As shown in Figure 3, the
nanoporous structures are uniform for different periods of de-alloying time.
For the Ag40Al60 alloys, it can be seen that the main feature was mainly accumulated among the
crystals d7–d8 when the immersion period was shorter than 650s. And after 650s, the relative energy
was mainly accumulated among the crystals d6–d7. So after 650s of immersion, the electrode surface
might undertake meta stable pitting corrosion and the susceptibility of pitting was higher. As shown in Figure4, larger Ag2Al phases mainly dissolved at different de-alloying time periods, leaving the Al
phases dissolution. So the nanoporous structures are coarser.
Figure 7. The EDP results of the Ag-Al samples in the 5 wt% HCl solution as a function of
de-alloying time: (a) Ag30Al70, (b) Ag35Al65, (c) Ag40Al60.
4. CONCLUSIONS
The effect of Al content on the nanoporous during the de-alloying of Ag-Al alloy was successfully investigated. It was observed that for Ag-Al alloys with different Ag contents, all Al and
5 10 15 20 25
1 2 3 4 5 6 7 8
(a)
Time (102s)
Crystals 0 0.09200 0.1840 0.2760 0.3680 0.4600 0.5520 0.6440 0.7360 0.8030
5 10 15 20 25
1 2 3 4 5 6 7 8
(b)
(b)
Time (102s)
C r y st a ls 0 0.09200 0.1840 0.2760 0.3680 0.4600 0.5520 0.6440 0.7360 0.8030
5 10 15 20 25
1 2 3 4 5 6 7 8
(c)
Time (102s)
[image:11.596.63.530.291.644.2]
part of Ag2Al were de-alloyed. When the Ag content is lower, for Ag30Al70 alloys, the mechanism of
forming nanoporous is controlled by Al dissolution, showing the bi-continuous nanoporous structure. When the Ag content is higher, for Ag40Al60 alloys, the forming mechanism of nanoporous structure
were controlled by Ag2Al dissolution, existing less nanopores. So when the Al content is up to 65 at%,
at the eutectic point, Al and Ag2Al phase coexist uniformly, the typical 3D bi-continuous uniform
nanoporous structure is successfully developed. ACKNOWLEDGEMENTS
The authors gratefully acknowledge the sponsorship from National Natural Science Foundation of China, Ministry of Science and Technology of Taiwan, under the project No. 51574147 and MOST 102-2221-E-110-025-MY3 and acknowledge the support from Natural Science Foundation of Liaoning province, under the project No.201602474.
References
1. W. B. Liu, S. C. Zhang, N. Li, J. W. Zheng and Y. L. Xing, J. Electrochem. Soc., 157 (2010) 666. 2. R. Zeis, T. Lei, K. Sieradzki, J. Snyder and J. Erlebacher, J. Catal., 253 (2008) 132.
3. Z. H. Zhang, Y. Wang, Z. Qi, W. H. Zhang, J. Y. Qin and J. Frenzel, J. Phys. Chem. C., 113 (2009) 12629.
4. J. Erlebacher, M. J. Aziz, A. Karma, N. Dimitrov and K. Sieradzki, Nature, 410 (2001) 450. 5. R. Xia. C. Xu, W. Wu, X. Li, X. Feng and Y. Ding, J. Mater. Sci., 44 (2009) 4728.
6. W. B. Liu, S. C. Zhang, N. Li, J. W. Zheng, S. S. An and Y. L. Xing, Int. J. Electrochem. Sci., 6 (2011) 5445.
7. Y. Zhao, X. Wang, J. C. Huang, X. Chen, L. Cao and M. Mu, Mater. Lett., 183 (2016) 165. 8. M. S. Kim and H. Nishikaw, Script. Mater., 92 (2014) 43.
9. F. Kertis, J. Snyder, L. Govada, S. Khurshid, N. Chayenand and J. Erlebacher, JOM., 62 (2010) 50.
10. C. Nahm, C. Kim, Y. Park and B. Park, Met. Mater. Int., 15 (2009) 989. 11. R. Morrish, K. Dorame and A. J. Muscat, Script. Mater., 64 (2011) 856.
12. T. T. Song, Y. L. Gao, Z. H. Zhang and Q. J. Zhai, Cryst. Eng. Comm., 13 (2011) 7058. 13. X. G. Wang, Z. Qi, C. C. Zhao, W. M. Wang and Z. H. Zhang, J. Phys. Chem. C., 113 (2009)
13139.
14. T. T. Song, Y. L. Gao, Z. H. Zhang and Q. J. Zhai, Corros. Sci., 68 (2013) 256. 15. H. J. Qiu, L. Peng, X. Li, H. T. Xu and Y. Wang, Corros. Sci., 92 (2015) 16. 16. Z. Q. Li, X. M. Wang and X. Lu, ECS Electrochem. Lett., 3 (2014) 13.
17. A. M. Homborg, E. P. M. van Westing, T. Tinga, G. M. Ferrari and J. M. C. Mol, Electrochim. Acta, 116 (2014) 355.
18. C.A. Loto, Int. J. Electrochem. Sci., 7 (2012) 9248.
19. S. Ritter, F. Huet and R. A. Cottis, Mater. Corros., 63 (2012) 297. 20. J. G. Yu, J. L. Luo and P. R. Norton, Langmuir, 18 (2002) 6637.
21. A. M. Homborg, E. P. M. van Westing, T. Tinga, X. Zhang, P. J. Oonincx, G. M. Ferrari, J. H. W. de Wit and J. M. C. Mol, Corros. Sci., 66 (2013) 97.
22. H. S. Klapper, J. Goellner and A. Heyn, Corros. Sci., 52 (2010) 1362. 23. L. H. Qian and M. W. Chen, Appl. Phys. Lett., 91(2007) 597.
24. H. Ji, X. G. Wang, C. C Zhao, C. Zhang, J. L. Xu and Z. H. Zhang, Cryst. Eng. Comm., 13 (2011) 2617.
25. A. Aballe, M. Bethencourt, F.J. Botana, M. Marcos and R.M. Osuna, Electrochim. Acta, 47 (2002) 1415.
27. Y. Y. Shi, Z. Zhang, J. X. Su, F. H. Cao and J. Q. Zhang, Electrochim. Acta, 51 (2006) 4977
28. C. Cai, Z. Zhang, F. H. Cao, Z. M. Gao, J. Q. Zhang and C. N. Cao, J. Electroanal. Chem., 578 (2005) 143.