I N
T H E M I D D L E H I L L S O F N E P A L
( I n t wo v o l u m e s )
By
TEJ BAHADUR SINGH MAHAT
D i s s e r t a t i o n s u b m i t t e d f o r t h e d e g r e e o f D o c t o r o f P h i l o s o p h y
a t t h e A u s t r a l i a n N a t i o n a l U n i v e r s i t y , C a n b e r r a .
VOLUME I
STATEMENT OF ORIGINALITY
ACKNOWLEDGEMENTS
I wish to express my sincere gratitude to my supervisor, Professor D.M. Griffin, for his keen interest in this study and for his guidance and advice throughout its course.
I am also very grateful to my advisor, Dr K.R. Shepherd, for his keen interest in the work and for the valuable advice and criticism he provided throughout.
The A.N.U. Forestry Department provided a very friendly environment for my work and I received valuable help and encouragement from many other of its members. In this regard I would particularly like to thank Dr L.T. Carron for advice received during development of the thesis topic, Dr M.T. Tanton and Mr T. Raath for assistance with the photographic appendix, Mrs J. Fenton for preparation of maps, Ms Paula
Reid for guidance in using the library facilities and Mr J.A. Curtis, of the Nepal-Australia Forestry Project, who helped me and my family in many ways during our stay in Canberra.
I thank all those interviewed in Nepal, particularly in the Chautara Division, for their time and patience. My thanks are also
due to Dr D.A. Gilmour and Mr D.P. Parajuli and the staffs of the Nepal-Australia Forestry Project and the Chautara Forest Division
for assistance during the field work in Nepal.
For help in finalising my thesis, I am grateful to
Mr N.M. Semple, who proof-read it and provided much useful advice, and to Mrs Elizabeth Campbell, Miss Heather Minns and Mrs Elizabeth Robinson, who typed it.
I am grateful to the Nepal-Australia Forestry Project for much assistance, in both Australia and Nepal, in connection with my
study. The experience I shared with this Project in the Chautara
Division prior to undertaking the formal study provided motivation
and much material for the study. For this I am grateful.
I should like to record my gratitude to the Australian Development Assistance Bureau for the financial assistance provided through the Nepal-Australia Forestry Project for this study.
I also thank His Majesty's Government of Nepal for allowing me to undertake this study.
During our stay in Canberra my family enjoyed the companion ship of many friends who helped greatly to ease the burden of my studies. In this regard I would particularly like to mention Susan Salthouse,
Dao Midgley, Noel Semple, Don and Eleanor Stodart, Dorothy Brown and their families.
I am deeply indebted to my family in Nepal - particularly my father and mother - who motivated me to undertake the study and have constantly encouraged me throughout its course.
Finally I extend my very special thanks to my wife Meena and our children Anu, Sony and Kumar (Baboo) who shared with me the pleasure
and pains of a long graduate study at Canberra. I could not have gone
ABSTRACT
This dissertation seeks to set in a historical context m a n ’s influence on the forests of the Nepalese Pahad (the Middle Hills and
montane areas). This is a complex task because the forests have never
stood apart as a separate sector in Nepal but have always been inter woven with other land uses and with political, social, demographic and economic change.
There are three depths of consideration, associated with
three sources of information. In the first, sources of information
are almost entirely secondary but they enable a general picture of Nepal as a least developed country to be given, with emphasis on those
aspects that have any bearing on forests. In the second, the attention
is focussed on Sindhu Palchok and Kabhre Districts, for which the author
was the Divisional Forest Officer from 1973 to 1980. Here, much
material is derived from the author's personal knowledge. Finally,
ten panchayats in the two Districts, centred on the village of Thokarpa, are examined in detail largely using data gained from the author's own field work undertaken during the course of his Ph.D. studies.
The study leads to a number of conclusions. First, that the
deforestation of the Pahad is not a recent phenomenon but has a long history, being well established by the late 18th century at least. Within the two districts there is now no forest land suitable for conversion to arable land, with the possible exception of some areas
on the southern slopes of the Mahabharat Lekh. It appears that the
situation has been the same for many decades and probably for more than
and certainly in Sindhu Palchok and Kabhre, was caused mainly by the joint attack of government land use policy and subsistence agriculture. Government policy promoted the conversion of forest to agriculture in
order to maximize agricultural surpluses and land taxes. Further,
the forest was used extensively for many purposes that extended beyond simple subsistence living, e.g. fuel for many manufacturing processes and timber for the construction of the towns of the Kathmandu Valley. Subsistence living involved a multi-faceted use of the forest mainly for timber, fuelwood and fodder, the latter closely linking the forest
to agriculture. Thus the productivity of the agricultural land depended
significantly on the manure of animals fed on tree leaves. In many
areas the combined effects of lopping, browsing and fire have caused the degeneration of the surviving forest.
These studies also show that the condition, distribution and extent of forests in a district can only be understood in the light of a comprehensive historical survey of all the factors that have had
effects. The factors have different effects in different areas so that
extrapolation from one area to another is fraught with danger. Thus
deforestation is likely to have occurred earliest and most intensively in areas where government pressure was most easily and continuously
applied, such as in the heartland of Sindhu Palchok and Kabhre including the Thokarpa area.
The dissertation also records factors which led to the emergence of community forestry in the Chautara Forest Division, a
development that has since spread through much of Nepal. In the light
TABLE OF CONTENTS
Volume I Page No.
TITLE PAGE
STATEMENT OF ORIGINALITY ii
ACKNOWLEDGEMENTS iii
ABSTRACT v
TABLE OF CONTENTS viii
LIST OF ABBREVIATIONS xii
LIST OF FIGURES xiv
LIST OF TABLES xv
CHAPTER 1 GENERAL INTRODUCTION 1
CHAPTER 2 INTRODUCTION TO NEPAL 8
2.1 GEOGRAPHY 8
2.1.1 General 8
2.1.2 Geology and soils 11
2.1.3 Climate 11
2.1.4 Forest and other land use areas 13
2.2 POPULATION CHARACTERISTICS 29
2.2.1 Demographic data 29
2.2.2 Ethnic composition and religious
allegiance 31
2.2.3 Population of Sindhu Palchok and
Kabhre 32
2.3 POLITICAL HISTORY AND GOVERNMENT SYSTEMS 42
2.3.1 Early history of Kathmandu Valley
and surrounding areas 42
2.3.2 The rise of the House of Gorkha and the process of political
unification of Nepal (1744-1846) 44
2.3.3 The Rana period (1846-1950) 50
2.3.4 Interim period of party politics
(1951-60) 58
2.3.5 The Panchayat Polity (1962 onwards) 62
2.4 AGRICULTURE 67
2.4.1 An overview 67
2.4.2 Crop husbandry and its significance
in Sindhu Palchok and Kabhre 72
Livestock 82
CHAPTER 3 TRADITIONAL RESOURCES AND THEIR
ADMINISTRATION 101
3.1 LAND 101
3.1.1 Introduction 101
3.1.2 Land tenure and the expansion of
Gorkhali rule 105
3.1.3 Land and the post-war period
(1816-1846) 109
3.1.4 Land under the Ranas (1846-1950) 112
3.2 TRADE 114
3.3 LABOUR 117
3.4 ADMINISTRATIVE SYSTEMS 123
3.4.1 Past structures 123
3.4.2 Current structures 126
3.4.3 Recent spatial distribution of
administrative resources 128
3.4.4 Forest legislation and administration 128
3.5 SUMMARY 141
CHAPTER 4 THE FORESTS OF SINDHU PALCHOK AND KABHRE
DISTRICTS 144
4.1 THE FORESTS - GENERAL 144
4.1.1 Forest types 144
4.1.2 Forest and landuse in Sindhu Palchok
and Kabhre districts 158
4.1.3 Forests and the law 164
4.2 HUMAN IMPACT - INITIAL SETTLEMENT 166
4.3 HUMAN IMPACT - BEYOND SUBSISTENCE NEEDS 168
4.3.1 The land as the state’s main resource 168
4.3.2 Urbanisation 170
4.3.3 Mines, metals and munitions 172
4.3.4 Industries and manufacturing 179
4.3.5 Guthi land endowments 190
4.3.6 Jagir 192
4.3.7 Birta, kharka and banbatika 194
4.4 HUMAN IMPACT - SUBSISTENCE ACTIVITIES 204
4.4.1 Fuel 204
4.4.2 Fodder, grazing and browsing 208
4.4.3 Fire 211
4.5 THE ROLE OF EUPATORIUM ADENOPHORUM 218
4.6 SUMMARY 221
CHAPTER 5 THE THOKARPA FORESTS 223
5.1 INTRODUCTION 223
5.1.1 The Thokarpa region 223
5.1.2 Field work 227
5.2 THE THOKARPA FORESTS AS SEEN BY INFORMANTS 228
5.3 FUEL SUPPLY AND CONSUMPTION 233
5.4 FODDER AND LITTER 241
5.5 OTHER USES OF FOREST PRODUCTS 254
5.6 THE FORESTS 265
5.6.1 The Colonel's Forest and adjoining
areas 265
5.6.2 Gogane Pakho and adjacent areas 295 5.6.3 Sun Kosi Lower Slopes forests 312 5.7 INITIATION OF COMMUNITY FORESTRY AND
THE NEW FORESTS 321
5.8 SUMMARY 324
CHAPTER 6 GENERAL DISCUSSION 326
6.1 DISCUSSION 326
6.2 CONCLUSION 343
GLOSSARY: Nepalese Words and Terms 347
REFERENCES 353
Volume II TITLE PAGE
TABLE OF CONTENTS ii
APPENDIX I A Translation of: Orders issued by Prime Minister Jung Bahadur Rana, in June 1874, regarding forests of Anaikot in Kabhre
Palanchok 376
Appendix Il-a A Summary in Translation of: The Royal Orders of January, 1837, regarding the iron industry in the eastern Hills
region 385
The Document 387
Appendix Il-b A Summary in Translation of: Iron mining obligations (falam khani rakam) of kipat land holders in the Chautara revenue sub
division 390
The Document 391
Appendix II-c A Summary in Translation of: Commutation of iron mining obligations into cash
payments 401
The Document 402
Appendix Il-d A Summary in Translation of: Application for the retention of the kipat land tenure system, dated December 1948 404
The Document 405
Appendix Il-e A Summary in Translation of: Application to the Bada Hakim Office (Goswara) from the talukdar functionaries: retention of kipat land holdings and system of cash
payments for iron obligations, dated
January, 1961 406
The Document 407
APPENDIX III Interview Sheet 412
APPENDIX IV List of Interviewees 419
APPENDIX V Forest Characteristics 425
APPENDIX VI Species in the Thokarpa Region 426
ADB Asian Development Bank
APROSC Agricultural Projects Services Centre B. S. Bikrara Sarabat, the Hindu calendar c . ca., circa, about
C.B.S. Central Bureau of Statistics C.D.O. Chief District Officer
CEDA Centre for Economic Development and Administration D.F.O. Divisional Forest Officer
dbh diameter at breast height
Dept. Department
Div. Division
D y . C . C . F . Deputy Chief Conservator of Forests EAPD Economic Analysis and Planning Division ERTS Earth Resources Technology Satellite F. Forest, block studied by the author
FAMSD Food and Agriculture Marketing Services Department FAO Food and Agriculture Organisation
FRS Forest Resources Survey Office
Govt. Government
HMGN His Majesty's Government of Nepal HMG Nepal His Majesty's Government of Nepal
I. Interviewee number
IDA International Development Agency IHDP Integrated Hill Development Project
K. Khola
Kabhre Kabhre Palanchok LSU Live Stock Unit
MFA Ministry of Food and Agriculture NAFP Nepal-Australia Forestry Project
P.M. Prime Minister
pers.comm. Personal communication
S A T A Swiss A s s o c i a t i o n for T e c h n i c a l A s s i s t a n c e Sarabat Bikrara Sarabat, the H i n d u c a l e n d a r
TU T r i b h u w a n U n i v e r s i t y UN U n ited Nat i o n s
LIST OF FIGURES
Page N o .
Fig. 2.1: Map of Nepal showing geographic regions
and watersheds 7
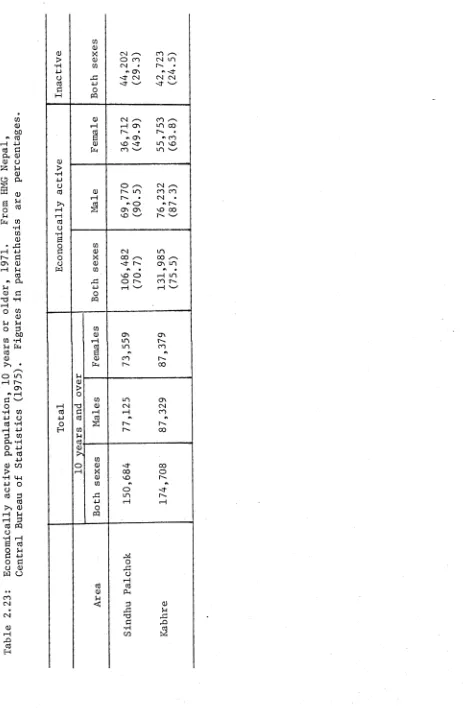
Fig. 2.2: Tectonic block diagram of East-Central
Nepal including Chautara 12
Fig. 2.3: Map: Rainfall, Sindhu Palchok & Kabhre Districts
Fig. 2.4: Livestock production and main uses 85
Fig. 3.1: Map: Trade routes before the 1959
Tibetan revolution 115
Fig. 3.2: Organisation chart of Ministry of
Forest and Soil Conservation 139
Fig. 4.1: Map: Sindhu Palchok and Kabhre Districts 146
Fig. 5.1: Map: The Thokarpa region 224
[image:14.529.29.513.110.798.2]L I S T O F T A B L E S
P a g e N o T a b l e 2 . 1 : V a r i o u s e s t i m a t e s o f l a n d u s e i n N e p a l 16 T a b l e 2 . 2 : F o r e s t a r e a a n d g r o w i n g s t o c k i n 1 9 6 4 18 T a b l e 2 . 3 : L a n d u s e b y r e g i o n s i n 1 9 7 5 2 0 T a b l e 2 . 4 : L a n d u s e a r e a s d e t e r m i n e d f r o m a e r i a l
p h o t o g r a p h s a n d L a n d s a t i m a g e r y 21 T a b l e 2 . 5 : P e r c e n t a g e l a n d u s e a r e a s f r o m a e r i a l
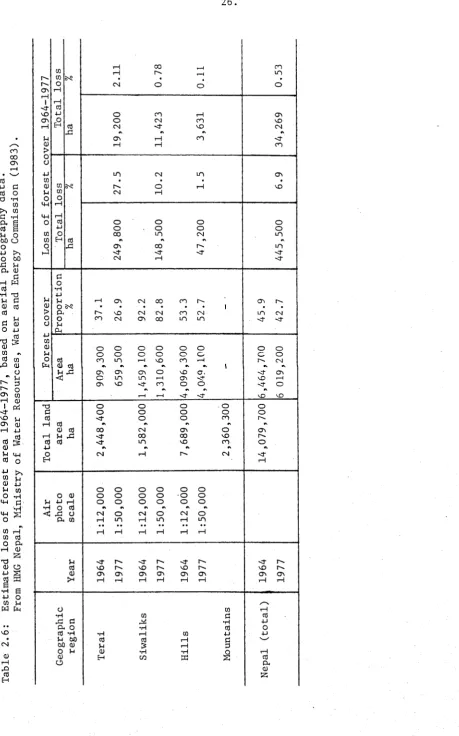
p h o t o g r a p h s a n d L a n d s a t i m a g e r y 2 2 T a b l e 2 . 6 : E s t i m a t e d l o s s o f f o r e s t a r e a 1 9 6 4 - 1 9 7 9 ,
b a s e d o n a e r i a l p h o t o g r a p h y d a t a 26 T a b l e 2 . 7 : E s t i m a t e d l o s s o f f o r e s t a r e a 1 9 7 2 - 1 9 7 9 ,
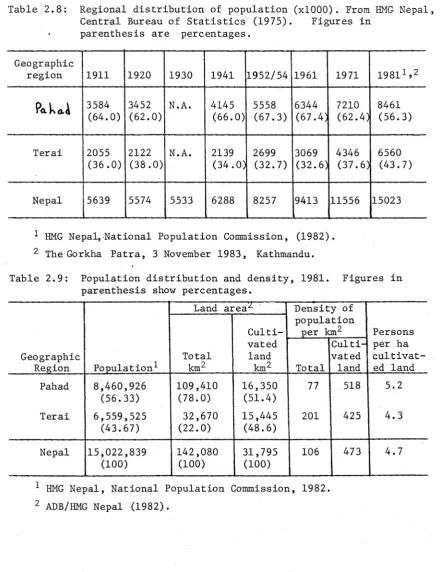
b a s e d o n L a n d s a t i m a g e r y 28 T a b l e 2 . 8 : R e g i o n a l d i s t r i b u t i o n o f p o p u l a t i o n 29 T a b l e 2 . 9 : P o p u l a t i o n d i s t r i b u t i o n a n d d e n s i t y , 1 9 8 1 29 T a b l e 2 . 1 0 : P e r c e n t a g e a n n u a l g r o w t h r a t e o f
p o p u l a t i o n 30
T a b l e 2 . 1 1 : L i f e e x p e c t a n c y ( i n y e a r s ) 3 0 T a b l e 2 . 1 2 : R u r a l a n d u r b a n p o p u l a t i o n 31 T a b l e 2 . 1 3 : P o p u l a t i o n b y m a i n l a n g u a g e g r o u p s 3 2 T a b l e 2 . 1 4 : P o p u l a t i o n b y r e l i g i o n 3 2 T a b l e 2 . 1 5 : P o p u l a t i o n o f S i n d h u P a l c h o k a n d K a b h r e
D i s t r i c t s 33
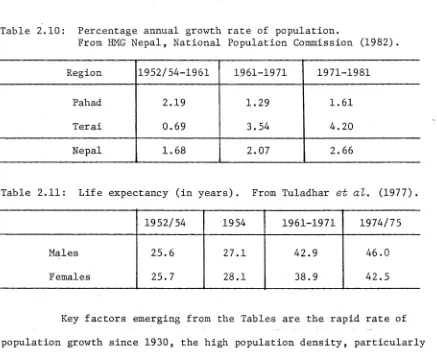
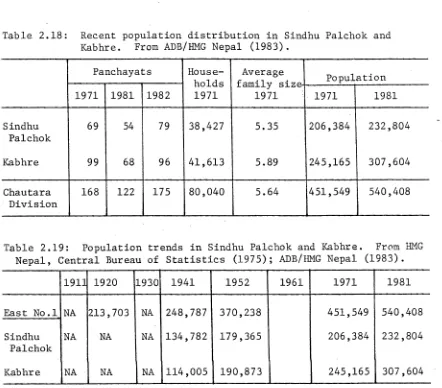
T a b l e 2 . 1 6 : P o p u l a t i o n o f T h o k a r p a r e g i o n , 1 9 7 1 3 4 T a b l e 2 . 1 7 : C o m p o s i t i o n o f E a s t N o . l . D i s t r i c t s , 1 9 5 2 35 T a b l e 2 . 1 8 : R e c e n t p o p u l a t i o n d i s t r i b u t i o n i n S i n d h u
P a l c h o k a n d K a b h r e 36 T a b l e 2 . 1 9 : P o p u l a t i o n t r e n d s i n S i n d h u P a l c h o k a n d
K a b h r e 3 6
T a b l e 2 . 2 0 : R e l i g i o u s a l l e g i a n c e ( S i n d h u P a l c h o k a n d
K a b h r e ) , 1 9 7 1 37
T a b l e 2 . 2 1 : M o t h e r t o n g u e ( S i n d h u P a l c h o k a n d K a b h r e ) ,
Table 2.22;
Table 2.23:
Table 2.24:
Table 2.25:
Table 2.26:
Table 2.27:
Table 2.28:
Table 2.29:
Table 2.30:
Table 2.31:
Table 2.32:
Table 2.33:
Table 2.34:
Table 2.35:
Table 2.36: Table 2.37:
Education of economically active population, 10 years or older (Sindhu Palchok and Kabhre), 1971
Economically active population, 10 years or older (Sindhu Palchok and Kabhre), 1971 Sources of employment for persons 10 years
or older (Sindhu Palchok and Kabhre), 1971 Local (village, town and district) panchayat
elections, 1982
Agricultural land in Nepal by geographic regions, 1981
Area, production and yield of cereal grains, and total cropped area
Projected demand and net production of cereal in edible form in Nepal, in units of 1000 tonnes, 1980-2000
Population, 10 years or older, by major occupation and industry group (Sindhu Palchok and Kabhre), 1971
Arable land, food grain production and population (Sindhu Palchok and Kabhre) Major crop statistics (Sindhu Palchok and
Kabhre), 1976/77
Daily average per capita food intake in Sindhu Palchok and Kabhre, 1974/75 Food balance situation in Sindhu Palchok
and Kabhre Districts between 1975 and 1980 Distribution of livestock population by
ecological regions, 1981
Percentages of male, female and young in livestock population, 1981
Government revenue in Nepal
Land tax as a percentage of revenue and total tax revenue
Declining share of forest revenue in the total revenue
Page N o .
39 40 41 66 67 69 71 72 73 76 80 82 83 84 91 92 Table 2.38:
Page N o . Table 3.1: Distribution pattern and cost of admini
strative services, 1973/74 129
Table 4.1: Major forest types within or near Sindhu
Palchok and Kabhre districts 147
Table 4.2: Land use area in Chauri Range, 1977 160 Table 4.3: Data for the Marming-Kalinchok forest lying
within Sindhu Palchok, 1980 161
Table 4.4: Areas of various forest categories in
Sindhu Palchok and Kabhre districts 162 Table 4.5: Prosecutions before the Forest Preservation
Special Court in the Chautara Forest
Division (1973/74 - 1979/80) 165
Table 4.6: Fuel use per person in Sindhu Palchok and
Kabhre districts 205
Table 5.1: Land use data of the Thokarpa region 225 Table 5.2: Characteristics of the forests in the
special study area 226
Table 5.3: Main attributes of persons interviewed 229 Table 5.4: Response by those interviewed to questions
of land use and changes to forest 230 Table 5.5: Order of priority of development activities
as seen by informants 234
Table 5.6: Fuel origin and consumption in the Thokarpa
region 237
Table 5.7: Fuel supply calendar for the Thokarpa region 239 Table 5.8: Fuels: Average weight (air-dry) per bhari
(head-load) during November-February 240 Table 5.9: Origin of fuel in the Thokarpa and Pangma
areas 242
Table 5.10: Fodder consumption by 46 households in the
Thokarpa region 246
Table 5.11: Fodder weight per bhari (head-load) weighed
Page No. Table 5.12: Fodder supply calendar for the Thokarpa
region 248
Table 5.13: Forest tree and shrub species used as
fodder in the Thokarpa region 249
Table 5.14: Livestock population: grazing and stall
feeding patterns in the Thokarpa region 251 Table 5.15: Annual use of litter and manure and
chemical fertilizers 253
Table 5.16: Gharsangha (house construction and
maintenance) timber and poles requirements
in the Thokarpa region 258
Table 5.17: Roof components 259
Table 5.18: Use of timber species in house construction
in the Thokarpa region 260
Table 5.19: Harsangha (farm implements and tools) 262 Table 5.20: Species used for agricultural tools and
implements in the Thokarpa region 263 Table 5.21: Forest and shrubland areas in the ten
panchayats of the Thokarpa region 266 Table 5.22: Use of the Colonel’s Forest and adjoining
forest and shrubland areas 270
CHAPTER 1
GENERAL INTRODUCTION
Deforestation has in recent decades become a topic of wide spread concern to a great diversity of people, amongst whom are forest conservationists, biologists, watershed managers, commercial timber traders and, above all, those in lesser developed countries whose lives depend directly or indirectly on forest products such as fuelwood. Numerous articles in newspapers are evidence that this topic is also seen to be of general interest to many not immediately affected.
Despite the holding of many conferences and workshops and development of a large literature, there has been great confusion on such fundamental issues as the amount, rate and causation of deforest
ation. Earlier estimates of tropical forest resource made by FAO
varied greatly because of inadequacies in the methods used to gather data and only in 1982 did the report of Landy present data that have
been generally accepted. Some of Landy's words about the nature of
the problem are worth quoting:
"In an era where speed is of the essence, people who use information are in a hurry and they either do not take, or else they have not got, the time needed to collect and interpret the mass of information avail
able. In their defense it should be said that this
work of organization and interpretation of existing information is long, boring and in any case, much less stimulating than the work involved in juggling with models and other intellectual games... that, - unfortunately, very often involve the use of doubtful
data. We can also say in their defense that for some
Are we talking of tropical countries or developing
countries? Of closed tropical forests or of all
tropical tree and/or shrub formations? Are we talk
ing only of moist tropical forests or of all tropical
forests? When we speak of the depletion in the tropical
forests, are we talking about a reduction of forest areas or only of a reduction in the growing stock through
logging, which, (is it necessary to repeat?) is an inte
gral part of forest management and development. There
has been a lot of debate in recent years on the problems of tropical forest resources without, however, there being any attempt to organize the existing information nor to introduce some clarity in the concepts being utilized."
If such problems exist in establishing the extent of the current resource they are even greater in determining causation in
relation to the rate of deforestation. Who, or what, are the
villains and how serious and rapid are their depradations? To begin
to provide answers to such questions requires the development of some historical depth of knowledge but all too often this is least available
where it is most needed. Forest history is relatively well-known, and
sometimes surprisingly detailed over a period of centuries, for individ ual forest areas, for much of North America and Europe but these are not the continents in which the crisis of deforestation is occurring. In Asia, Africa and Latin America much change occurred before the regular keeping of written records and even during colonial time the
record is often scanty. Yet the crisis is located in these continents
and it is here that increasing efforts are being made to reverse what
is often reported as a rapidly deteriorating situation. However, the
real rates of change (particularly within specific forest types) are seldom known accurately and the current rates cannot be set in an
historical context. Causation, both current and historiCjis often
impossible to establish a well-based forest policy for a country or even to produce an adequate appraisal of a proposed assistance project. Neisslein (1984) has asked the question 'Can historical research be of help in forest policy decisions?'and not surprisingly concludes that it can be of considerable assistance.
A major aim of this dissertation is to support this contention by attempting to establish the place of forestry in the developing con
text of Nepalese history. This is a complex task because the forests
have never stood apart as a separate sector in Nepal but have always been inextricably interwoven with other land uses and with political,
social, demographic and economic change. Special attention is given
to the Pahad because of the subsequent development of the dissertation. (The Pahad lies between the high Himalaya to the north and the low
elevation, flat Terai zone bordering India to the south. It comprises
the heavily-populated Middle Hills and the higher montane zone to the north, at the altitudinal limit of human activity.)
The main body of this dissertation divides into three parts reflecting three depths of consideration and three sources of infor
mation. In the first (Chapters 2 and 3), a general picture of Nepal
is given, with emphasis on those aspects that have any bearing in the
widest sense on forest. Here, the sources of information are almost
the territorial structure within the Ministry of Forests and Soil
Conservation in 1983. (In general usage, the name of the second
district is usually abbreviated to Kabhre and this practice will be
adopted throughout this dissertation.) The author was Chautara
Divisional Forest Officer from early 1973 to early 1980 and much of the material is derived from his personal knowledge and observations^
although secondary sources are also utilized. In the third part
(Chapter 5) the field of vision is further reduced to encompass a study in detail of an area centred on the village of Thokarpa lying on the eastern slopes of the Sun Kosi river and within the former
Chautara Forest Division. The content of this part is based on
information gathered by the author in the field between November 1982
and February 1983 during the course of his Ph.D. studies. This
information includes specific field observations and the results of an extensive series of personal interviews with local residents con ducted by the author.
It is anticipated that the rationale for this dissertation will be better understood by the reader if the major theses that arise from it and the evidence to support them are set out in this Introduction.
There are two. First, that the deforestation of the Pahad is not a
recent phenomenon but has a long history, being well established by
the late 18th century at latest. Second, that deforestation in much
of the Pahad, and certainly in Sindhu Palchok and Kabhre was caused by the joint attack of government land use policy and subsistence agri
culture. Government policy promoted the conversion of forest to
agriculture and the use of the forest for many purposes that extended
a multi-faceted use of the forest mainly for timber fuelwood and fodder, the latter closely linking the forest to agriculture.
A number of corollaries arise from these two main theses. The first is that the condition, distribution and extent of forests in a district can only be understood in the light of a comprehensive his
torical survey of all the factors that have had effects. A second is
that these factors will have different effects in different areas.
Extrapolation from one area to another is therefore fraught with danger. Thus deforestation is likely to have occurred earliest and most inten sively in areas where government pressure was most easily and continuously applied, such as in the heartland of Sindhu Palchok and Kabhre including the Thokarpa area.
The dissertation is concerned with these two main themes, the long-standing nature of the deforestation and the joint causes of
this deforestation. In addition, and towards the end, this disser
tation records factors which led to the emergence of community forestry in the Chautara Forest Division, a development that has since spread
through much of Nepal. In the light of much evidence of the neglect
Two conventions adopted are best noted at this early stage. Dates are given according to the Christian calendar for wider intelli
gibility although the Hindu calendar might be seen as more appropriate
in a Nepalese setting. The conversion is easily made: the year B.S.
(Bikram Sambat) is obtained by adding 57 to the year A.D. Second,
the author carried out many personal interviews, the details of which
are given in Appendix III. In the text information obtained is
attributed to a person or persons interviewed by giving each person a
number, e.g. (1.24). Appendix IV gives a list of interviewees.
A photographic appendix (VII) is included and it is recom mended that readers look through this before reading the text in order
to gain some visual appreciation of the field study area which forms
the subject of Chapter 5. Because of the general nature of many
photographs they are not always referred to individually in the text.
CHAPTER 2
INTRODUCTION TO NEPAL
2.1 GEOGRAPHY
2.1.1 General
Nepal is a landlocked country of 144,181 km2 lying between the Himalaya to the north and the Indo-Gangetic plain to the south.
It lies between 80° 4' and 88° 10’ east and 26° 20'and 30° 27' north,
with maximum length and breadth of 900 and 240 km respectively: the
nearest coastline is 1,127 km distant in the Bay of Bengal. The ele
vation varies from 60 to 8,848m above sea level.
From south to north, the country may be divided into three geographic regions (the Terai, Pahad and High Himalaya), with further subdivisions (Fig. 2.1).
The Terai. The southernmost region (23% of Nepal by area) is the Terai,
with four major sub components. The most southerly is the Terai proper,
a part of the Indo-Gangetic Plain, generally at 100-300m above sea
level. The soils are alluvial clay and silt deposits and are now
extensively used for agriculture, although they carried extensive
forest until 30 years ago. Bordering the Terai proper is the Bhabar
zone, slightly more elevated, and consisting of deep deposits of gravel
and boulders. Only major rivers cross the Bhabar zone on the surface;
most drainage is underground. This 13 km wide belt was heavily fores
ted until recently but many areas now support marginal agriculture.
The Churia range (also called the Siwalik (Siva-Lekh) hills) rises abruptly from the plains and forms the northern boundary of much
is composed of coarse-grained sediments. The soils are relatively poor and easily subject to severe erosion so the area remains mainly covered by forest. In certain areas, dun valleys (running approxi mately WNW-ESE) lie between the Churia range and the next range, the Mahabharat Lekh. These dun valleys were densely forested until recently, protected by both government policy and virulent malaria. Since the eradication of malaria in the mid-1950s, they have been progressively cleared for agriculture.
The Pahad. The Pahad (43% of Nepal by area) lies to the north of
the Terai, and its southernmost component is the Mahabharat Lekh with an elevation of 1,500 to 3,000m. This range, broken only by a few major rivers, forms a formidable barrier between India to the south and the Nepalese heartland to the north. Although the northern slopes are somewhat gentler than the southern the relief is generally very steep. Colonization by man generally occurred from the north and now the northern slopes have a population density comparable to that of the source districts. Southern slopes, however, at least in Kabhre District, (interviews conducted by D.M. Griffin, (l983a^ pers. comm.) were settled in the last 100 years and population density remains lower. Much forest remains on the Mahabharat Lekh, although it is under considerable pressure.
North of the Mahabharat Lekh lie the Middle Hills, the heartland of Nepal. This area forms 30% of Nepal, is 60 to 100 km in breadth, extends the length of the country and, somewhat arbitrarily, lies below 2,300m. Two-thirds of Nepal’s population lives here,
and valleys, continuous hill slopes from 600 to 3,500m being not uncommon. Agriculture is largely undertaken on terraces and most land suitable for agriculture has for long been reclaimed from forest. Highest productivity occurs in a few tectonic basins, e.g. Kathmandu Valley and Pokhara Valley, and on tars, old river bench terraces.
In the Middle Hills, arable agriculture is largely limited to elevations below 2,000m. Between 2,300 m and the tree-line at
about 4,000 m lies the montane zone (about 18% of Nepal) largely covered in coniferous forest and grass and herb fields and populated by trans-humant pastoralists.
The High Himalaya. Within this zone are to be found the main Himalayan
range, the Tibetan Marginal Mountains (only in western Nepal) and the trans-Himalayan valleys. Although grazing may occur up to 5,000m (the permanent snowline in central Nepal) in summer and some of the dry
inner valleys are inhabited, the zone is of little economic significance except in terms of mountaineering and tourism.
The main Asian watershed lies not along the crest of the
Himalaya but rather on the Tibetan Marginal Mountains. North of these, drainage is into the Tsangpo system, south into the Indo-Gangetic
2.1.2 Geology and soils
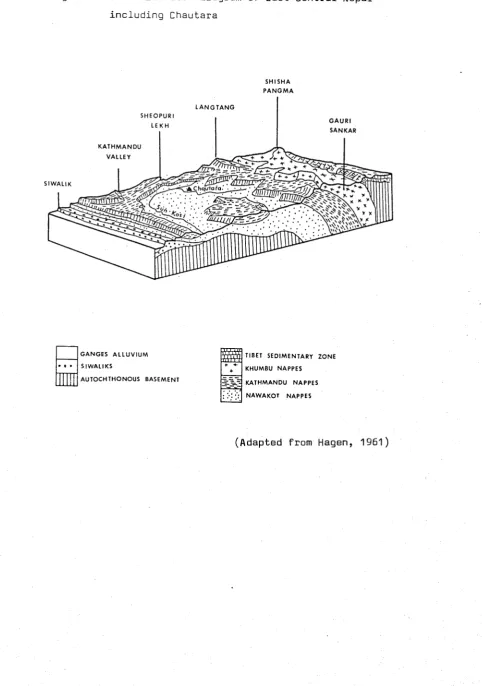
According to the current theories of plate tectonics the southern continent of Gondwanaland broke up about 100 million years ago and one part, now India, moved to collide with the Eurasian plate about 53 million years ago. Many sedimentary strata were laid down in the sea then lying between India and Eurasia and these strata were subsequently compressed, folded and thrown up as the Indian plate underwent progressive subduction under Tibet. The upthrust strata form the Himalaya and much of Nepal (Hagen, 1961). Geologically, therefore, the rocks of Nepal consist of not only sedimentary
strata, e.g. sandstone, limestone, dolomite, but also many metamorphic rocks, e.g. slates, schists and gneisses, and plutonic rocks, e.g. granites. Erosion and subsequent deposition have led to the creation of many alluvial areas, both in valleys and, more importantly, in the
Bhabar and Terai. (A tectonic block diagram of eastern Nepal includ ing the Chautara region is shown in Fig. 2.2^
Hills soils are generally of coarse to medium texture with very high permeability. They are generally acid and are often pod- solized at higher elevations. Fertility is usually low to moderate. Boron deficiency is widespread. Alluvial soils in the Terai and else where vary greatly in texture and productivity. Some clays in hotter drier areas are moderately alkaline (Sharma, 1974; Shrestha and Sharma, 1980).
2.1.3 Climate u
Fig. 2.2 Tectonic block-diagram of East-Central Nepal including Chautara
SHISHA PANGMA
LANGTANG SHEOPURI
LEKH GAURI
SANKAR
KATHMANDU VALLEY
SIWALIK
GANGES ALLUVIUM
SlWALIKS
AUTOCHTHONOUS BASEMENT
TIBET SEDIMENTARY ZONE
KHUMBU NAPPES
KATHMANDU NAPPES
NAWAKOT NAPPES
[image:30.529.33.516.117.804.2]The southeast monsoons bring heavy rainfall in summer, between June and September. The average annual rainfall of Nepal is about 1,600 mm, 75-80% of which occurs during this monsoon period. The mean annual rainfall ranges from 300 mm or less in the west in the region of the Tibetan Marginal Mountains to over 3,500 mm along the southern slopes of the Annapurna range near Pokhara. Although most of Nepal receives rainfall varying between 1,000 and 2,000 mm per annum,
(2,000 mm at Chautara, in the special study area (see Fig. 2.3)) the rainfall distribution pattern varies both in north-south and east-west directions. Generally, the eastern part of the country receives
earlier and more rainfall from the summer monsoons than the west whereas the winter rainfall declines from west to east but there are several local exceptions to these general patterns.
The summer maximum temperatures range from 40°C in the Terai to about 28°C in the Pahad. During the winter the maximum and minimum temperatures are about 23°C and 7°C for the Terai, and 15°C and 4°C for Chautara at an elevation of about 1,500m in the Pahad.
2.1.4 Forest and other land use areas
Table 2.1 presents estimates of areas under various land uses prepared by the Forest Resources Survey Office (1964), Economic Planning Division of Ministry of Food and Agriculture (1971/72),
International Development Agency Settlement Mission (1972) and the National Planning Commission (1975 and 1980). The accuracy of the estimates
Fig. 2.3 Rainfall, Sindhu Palchok & Kabhre Districts (see also Fig. 4.1)
g r a d e i n t o r o u g h g r a z i n g l a n d ( p a k h o ) . F u r t h e r , t h e v a r i o u s a g e n c i e s
i n v o l v e d h a v e p u t f o r w a r d d i f f e r e n t t y p e s o f l a n d u s e d a t a an d l a r g e
d i s c r e p e n c i e s o c c u r b e t w e e n t h e s e . T h e r e f o r e , a n a s s e s s m e n t o f t h e
p a s t e x t e n t o f f o r e s t and d e f o r e s t a t i o n on t h e b a s i s o f h i s t o r i c a l
s t a t i s t i c a l d a t a i s n o t p o s s i b l e . Ho wever , a v a i l a b l e i n f o r m a t i o n
f r o m t h e p a s t few d e c a d e s c l e a r l y i n d i c a t e s t h a t l a n d u s e p a t t e r n s a r e
c h a n g i n g f a s t i n some o f N e p a l . T h i s h a s b e e n e s p e c i a l l y t r u e i n t h e
c a s e o f t h e d i m i n i s h i n g f o r e s t a r e a , w h i c h i s d i r e c t l y p r o p o r t i o n a l t o
i n c r e a s i n g a g r i c u l t u r a l l a n d a r e a . N a t i o n a l l y , i n a p p r o p r i a t e l a n d u s e
p r a c t i c e s h a v e t e n d e d t o i n t e n s i f y e r o s i o n and h e n c e r e d u c e a g r i c u l t u r a l
p r o d u c t i v i t y , f o r c i n g f u r t h e r e n c r o a c h m e n t o n t o l a n d n o t p r e v i o u s l y u s e d
f o r a g r i c u l t u r e . The c y c l e , i n t u r n , i s r e p e a t e d , f u r t h e r r e d u c i n g
b o t h t h e a g r i c u l t u r a l p r o d u c t i v i t y and t h e f o r e s t a r e a a n d y i e l d .
T h i s h a s p e r p e t u a t e d a c o n t i n u i n g d e t e r i o r a t i o n o f t h e p o p u l a t i o n ’ s
l i v i n g s t a n d a r d s .
Land u s e c h a n g e s a n d , p a r t i c u l a r l y , t h e l o s s o f f o r e s t a r e a s
a nd c o n s e q u e n t g a i n i n a g r i c u l t u r e l a n d h a v e b e e n p a r t i c u l a r l y s i g n i f i
c a n t i n t h e T e r a i b u t much l e s s so i n t h e M i d d l e H i l l s . The f a c t
t h a t e v e n t r a i n e d f o r e s t e r s l i k e C o l l i e r ( 1928) and o t h e r s d e f i n e d
N e p a l ’ s T e r a i f o r e s t r e s o u r c e a s a n ' i n e x h a u s t i b l e ' s o u r c e o f t i m b e r
f o r e x p o r t a s r a i l w a y s l e e p e r s a nd o t h e r g o o d s , i n d i c a t e s t h a t t h e
a b u n d a n c e o f f o r e s t r e s o u r c e i n Ne p al was t a k e n f o r g r a n t e d . H a r d l y
a n y a t t e m p t was made t o a s s e s s i t u n t i l r e c e n t l y . T h i s m i s l e a d i n g
c o n c l u s i o n l a r g e l y c o n t r i b u t e d t o t h e a t f i r s t g r a d u a l and t h e n more
a c c e l e r a t e d p r o c e s s o f d e f o r e s t a t i o n o f t h e T e r a i i n t h e l a s t 5 0 - 6 0
• O CN
^ m .
• O CN
■> m •
rn C N vo ON * o . a z 2 A v£> On g « ■U g * c 3 £ 3 W « e 5 co a u Ü co <y Dd •u CO qj h tu I CO Q£ u< c CO > a U ) eo co d ON d rH «
a . CL
<D "d IS o d CO § co^ c £ c • 3 <D s O a * o o w > , g 2 W) 3 4J rH g § . CO < > v-3 Q • g 1 « d *o •H U u d CO •H rH
•u d *H ON S rH
►H 1
1 *
*~s Cfl a a ,
Cu <U
a 2
c
%
to 2 v_/ o
< s <
£ 5 Q
eg co
/-—s CO *H £ LO r>* d aj
- coa
CL
Z *Hg
o § d co d d o 2 d CO CO S *H 1 o o CO d M d •H d § 1 53 d « CO <U d * 3 •H rH -3-d in X5 a) ■g § * 3 d CO CT3 U d <U CO rH *H > • g d TJ d
CO \
•u -a
C rH
d 4J
-U
H (1)
CO CO
<■£>
CO CO 2 o CD -a rH
<u > s
u ' d
3 C
u -H
to i3
nj S3
a . °
l
t
-u
In the last 3 or 4 decades different agencies and authors were involved in making assessments of the country’s forest resource.
Tables 2.2 to 2.5 and the accompanying brief description provide regional breakdowns of the relevant data generated by these investi
gators. The data indicate that much of the loss in forest area of
the past few decades has taken place in the Terai and the Siwalik
regions. It was this apparent loss of Terai and Siwalik forest
resource in recent times that has been generalised by many writers and reporters for the whole of Nepal including the Middle Hills region.
Regional breakdown of forest resources.
The Forest Resources Survey office made the first attempt at comprehensive assessment of forest resources in Nepal in 1963-1964
(Forest Resources Survey, 1967, 1973). It presented the data on Nepal’s
total forest area of 6.4 Mha, at that time, in terms of two very broad
ecological regions: the Terai and Hills, with 1.8 Mha and 4.6 Mha
of forest cover respectively (Table 2.2). An entire area in the
highest northern mountainous belt, however, was left out and this,
according to later estimates (FAO/UNDP, 1980; Table 2.3), contained
0.1 Mha of high altitude (montane) forest.
The data for the Terai included the Bhabar, dun valleys
and even the Churias besides the Terai proper. Thus the first
T a b l e 2 . 2 F o r e s t ar ea a n d g r o w i ng st o c k i n 1 9 6 4 . Da ta f r o m Fo res t R e s o u r c e s S u rv ey ( H M G Nepal, 1 9 6 7 , 1 9 7 3 ) . F i g u r e s i n pa r e n t h e s i s are per centages.
1— 1
cOX) 1-1 CN
3 1— 1 cn cn
3 a) • •
3 •H rH CN
< Ph
rH 3 • o rH cO xl 30 4M cn LO
3 tH MM • •
3 3 • UT 00 X) 3 ■H 3 d Hf
1-1 <! PH a u 0)
>-i
cn CN
• rH rH
rH \-1 XJ 4-1 • •
cO cOrH MM o cn
4-1 3 3 • rH <r O 3 •H 3 CM rH
o H 3 PH U
o 3
4J cn
t>0
3 3 cn i--. O
•H 3 • • • •
£ 3 4M i-'. cn
o 3 4M MM o 00 co
3 a) 3 • cn M0
o PM h e c u _____
CN cn CN
3 6 3 rH
o • <n LO
> iH 4M • • •
3 Mm m CT\ LO
4M CN o
O 3 O rH CN
H 3 tH vO
rH rH
✓—N
4M cn to cn o CM LO
3 CM O •
3 LO CN co cn NT LO
3 • cn • tH •nr
O <r ^ rH vO Pm
4M CO ^ O ^ 00 /-\ 1 3 CN lO LO o I-". LO 3 3 rH • LO . 4O •
tj O 3 • cn • 1—1 •hT
.3 IS O m o -<r rH rH LO
MM V_'
3 3 -H U r—1
rH
•H 1-1 cn O
s 3 TO o o r- o 00 /^\
'w' 4M C . cn • o o O 3 . vD • <r •o
E-M tH o r- cn cn NT rH iH rH '— z
3 •H
-3 3 3 •H rH
PX o t-1 3 3
3 *H 1-1 3. PX
3 bß •H 3 3
bO 3 O 3 3
no EH S3
The World B a n k ’s 'Agriculture Sector Survey of Nepal (1974)' based its estimates on data from the 1972 earth resources technology
satellite (ERTS). The following areas of forest (in Mha) were said to be present in 1972: Terai and Bhabar (1.2), Siwalik and lower
Mahabharat (0.5), upper Mahabharat (2.5) and southern Himalayan valleys (probably equivalent to the Middle Hills) (1.0), a total of 5.2 Mha. These data were further compared with those obtained by aerial photo graphy in 1964 for the Forest Resources Survey and it was concluded that there had been a total loss of c. 340,000 ha of forest land (equivalent to 3% since 1964) in the Terai. Loss of 180,000 ha of this forest was attributed to official settlement of hill people, and another
estimated 50,000 ha to illegal migration.
The IDA Settlement Mission, based on the 1972 ERTS imagery analysis, also indicated a loss of 57% merchantable stock since 1964
in the Terai.
In 1980 FAO/UNDP published a study based on the interpre tation of 1975 ERTS imagery at 1:50,000 scale and provided a regional breakdown (Table 2.3).
Table 2.3 Land use by regions in 1975. Areas expressed in units
of 1 Mha. Data from FAO/UNDP (1980). Figures in
parenthesis are percentages.
Geographic
Region Area
Cover type1
Forest Agriculture Brush
High Himalaya 3.3611 0.1008 0.0336 3.2267
(100) (3.0) (1.0) (96.0)
Transition 2.5134 1.2064 0.4524 0.8546
(100) (48.0) (18.0) (34.0)
Middle Mountain 4.2067 1.1779 1.3461 1.6827
(100) (28.0) (32.0) (40.0)
Siwaliks 1.8187 1.2003 0.3819 0.2364
(100) (66.0) (21.0) (13.0)
Terai 2.1799 0.4142 1.6567 0.1090
(100) (19.0) (76.0) (5.0)
Total 14.0798 4.0996 3.8707 6.1094
(Nepal) (100) (29.1) (27.5) (43.3)
1 Cover types are defined a s :
Agriculture: cultivated land.
Forest lands with at least 50% tree canopy.
Brush: grass or shrublands in most of the country.
In the High Himalaya, areas of ice, snow and rock masses and alpine meadows are included.
This study presents data according to three major watersheds
and three geographic regions, i.e. in nine zones in all. The data
presented for the three major watersheds of Karnali, Sapta Gandaki and Sapta Kosi include also, for reasons of simplicity, the minor
river basins in their vicinities. The three geographic regions are
the Hills, Siwaliks and Terai. The high Himalaya region is not
included as it is either barren rock or under perennial snow and
supports no forest. The Hills region includes the middle and the
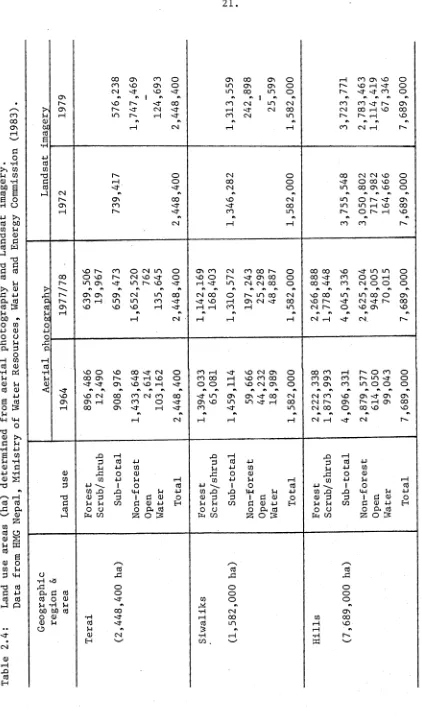
T a b le 2 .4 : L a n d u s e a r e a s (h a ) d e te r m in e d fr o m a e r i a l p h o to g ra p h y a n d L a n d s a t im a g e ry . D a ta fr o m H M G N e p a l, M in is tr y o f W a te r R e s o u r c e s , W a te r a n d E n e rg y C o m m is s io n (1 9 8 3 ).
O
f'-O CN 00 00
CN1 00
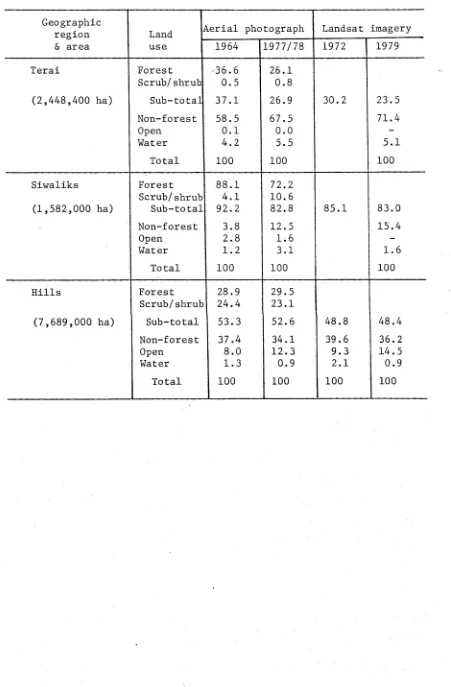
[image:39.529.56.478.63.780.2]Table 2.5: Percentage land use areas determined from aerial
photography and Landsat imagery. From HMG Nepal (1983) .
Geographic
region Land \erial photograph Landsat imagery
& area use 1964 1977/78 1972 1979
Terai Forest 36.6 26.1
Scrub/shrub 0.5 0.8
(2,448,400 ha) Sub-total 37.1 26.9 30.2 23.5
Non-forest 58.5 67.5 71.4
Open 0.1 0.0
-Water 4.2 5.5 5.1
Total 100 100 100
Siwaliks Forest 88.1 72.2
Scrub/shrub 4.1 10.6
(1,582,000 ha) Sub-total 92.2 82.8 85.1 83.0
Non-forest 3.8 12.5 15.4
Open 2.8 1.6
-Water 1.2 3.1 1.6
Total 100 100 100
Hills Forest 28.9 29.5
Scrub/shrub 24.4 23.1
(7,689,000 ha) Sub-total 53.3 52.6 48.8 48.4
Non-forest 37.4 34.1 39.6 36.2
Open 8.0 12.3 9.3 14.5
Water 1.3 0.9 2.1 0.9
[image:40.529.53.504.118.805.2]between the Hills and the Siwaliks region. From the foothills of the Siwaliks to the south is the Terai region.
For the purpose of land use classification this study further attempted to divide what is generally classed as forest land into
forest and shrub/scrub areas. Other land use categories considered
were non-forest areas, open areas and water. According to this
study, categories can be defined as follows:
Forest - areas covered by commonly recognised tree species of any size and with a crown closure of at least 10%.
Shrub/scrub - areas currently stocked with shrubs
and unmerchantable tree species of up to 6m height. A
light overstorey of trees with commercial content may
exist. If the crown closure of this overstorey is less
than 10% the shrub/scrub classification is applied.
Non-forest - all agricultural land, grassland and high mountain meadow areas which are considered to be
agricultural. Remnants of forest growth may be found
in pasture areas: if the crown closure on such areas is
less than 10%, the non-forest classification applies. Open area - land devoid of any vegetation and includes landslides, rock and permanent snow covered areas.
F o r d e t e r m i n i n g f o r e s t and s h r u b / s c r u b a r e a s , t b i s s t u d y u s e d
a e r i a l p h o t o g r a p h s o f 1964 C l : 1 2 , 0 0 0 s c a l e ) and 1 9 7 7 / 7 8 ( 1 : 5 0 , 0 0 0 s c a l e )
and L a n d s a t i m a g e s o f 1 9 7 2 , 1976 and 1979 ( 1 : 2 5 0 , 0 0 0 s c a l e ) . S am pl in g
t e c h n i q u e s w e r e u s e d t o e s t i m a t e f o r e s t a r e a s f r om 1964 an d 1 9 7 7 / 7 8
a e r i a l p h o t o g r a p h s . The s t a n d a r d e r r o r s o f t h e e s t i m a t e s w e r e
c a l c u l a t e d and!, c omp ar ed t o d e t e r m i n e w h e t h e r t h e d i f f e r e n c e i n f o r e s t
a r e a s e s t i m a t e s f o r t h e p e r i o d ( 1 9 6 4 - 1 9 7 7 / 7 8 ) was s t a t i s t i c a l l y s i g
n i f i c a n t . W i t h t h e L a n d s a t i m a g e r y , 100% d o t c o u n t f o r t h e T e r a i
and S i w a l i k r e g i o n s and 50% d o t c o u n t f o r t h e H i l l s r e g i o n was c o n
d u c t e d . F o r e s t a r e a e s t i m a t e s f o r 1964 and 1 9 7 7 / 7 8 , f r o m a e r i a l
p h o t o g r a p h s , d i f f e r e n t i a t e b e t w e e n f o r e s t an d s h r u b / s c r u b , b u t t h e a r e a s
c a l c u l a t e d f o r 1972 an d 1979 f r om L a n d s a t i ma g es p r e s e n t c ombi ned a r e a s
o f s h r u b / s c r u b an d f o r e s t .
A s s o c i a t e d w i t h i t s s o u r c e s o f i n f o r m a t i o n , t h i s s t u d y a l s o
had i t s l i m i t a t i o n s . Thus 1964 a e r i a l p h o t o g r a p h y p r o v i d e d f u l l
c o v e r a g e o f t h e T e r a i and S i w a l i k s r e g i o n s b u t t h e H i l l s r e g i o n was
o n l y p a r t i a l l y c o v e r e d by e a s t - w e s t f l i g h t l i n e s a p p r o x i m a t e l y 16 km
a p a r t . The 1 9 7 7 / 7 8 a e r i a l p h o t o g r a p h y , h o w e v e r , p r o v i d e d c o m p l e t e
c o v e r a g e f o r a l l r e g i o n s . A l s o , c l o u d c o v e r and a v a i l a b i l i t y o f
i ma g e s l i m i t e d t h e u s e f u l n e s s o f L a n d s a t i m a g e r y . M o r e o v e r , an
a c c u r a t e d i s t i n c t i o n b e t w e e n f o r e s t and s h r u b / s c r u b c o u l d n o t b e made
u s i n g L a n d s a t .
F o r t h e p u r p o s e o f e s t i m a t i n g f o r e s t d e p l e t i o n r a t e s , t h i s
s t u d y u s e s t h e a n n u a l p e r c a p i t a f u e l w o o d c o n s u m p t i o n f i g u r e s e s t i m a t e s
by t h e T r i b h u w a n U n i v e r s i t y i n 1 9 7 6 . T h e s e e s t i m a t e s a r e o f t h e
o r d e r o f 30 { «? ( 0 . 8 5 m 3) i n t h e h i l l s and 20 f t ( 0 . 5 7 m 3) i n
These estimates, moreover, make the rather speculative prediction that to meet the fuelwood needs alone of the local population at the
current rate of consumption, all the accessible forests of the Hills would disappear in less than 15 years time or by the year 1990 and
those of the Terai in about 25-30 years or by about the turn of the current century (Tribhuwan University, 1976).
Despite these limitations the Water and Energy Commission (Robinson, Merritt and de Vries, 1983) study presents by far the most comprehensive picture, so far, of the extent of forest area and the loss in forest cover since 1964 in various geographic regions of Nepal.
The comparison of aerial photographs of 1964 and 1977 sug gests that:
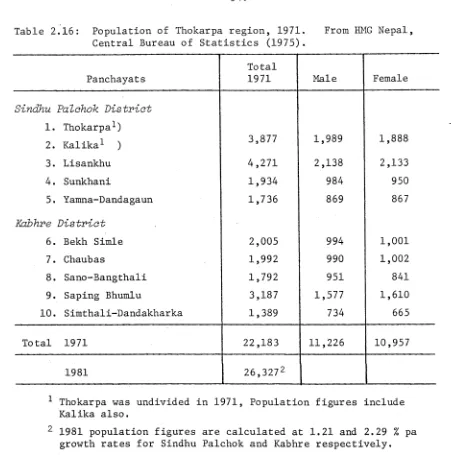
For the Hills region losses of 47,200 ha or 1.5% over a period of 13 years occurred, or an average annual loss of 0.11% This value for loss of forest areas is not statistically significant for any of the hill regions of the three watersheds.
For the Terai and the Siwaliks regions losses of 249,800 ha
and 148,500 ha occurred or 27.5% and 10.2% respectively. The average
annual loss of forest cover in the Terai was 2.1% and in the Siwaliks 0.8% (Table 2.6).
The study, therefore, concludes that in the Hills region little or no reduction in forest area had occurred during the period
1964-1977/78. Crown closure was reduced, however, particularly in
T a b l e 2 . 6 : E s t i m a t e d l o s s o f f o r e s t a r e a 1 9 6 4 -1 9 7 7 , b a s e d o n a e r i a l p h o t o g r a p h y d a t a . F r o m H M G N e p a l , M i n i s t r y o f W a t e r R e s o u r c e s , W a t e r a n d E n e r g y C o m m i s s i o n ( 1 9 8 3 ) .
rH 00 CO
CO rH r-^ n
co 5^5 • • •
i"- o CN o o o
c n 1—1
1—1 1 i—!
cd
MO P O CO t— 1 cn
CT\ o o CN CO ^p
1-1 £-4 P CN MO CM
■P e*
5-1 ON rH CO
P rH rH CO
> O u
4-1 up CM in cn
P • • • •
P p O rH M0
5-i CO CN rH
O o 4-4 i— 1
4-1 rH
O cd o o o O
4-1 o o o o
cn o 00 in CM n
P H P * •V * e\
o p; cn co n
H-l <r
CN rH
p
o
• r l P
5-i 5-i 1-1 ON CM 00 CO n- c n
r^-05 O 6^8 • • • • • • i • •
> P o CM CM CO CM n CM
O O co CM ON CO m m U S-i
Ph 4—i
P
05 o c o o o o o o
J-(j o o o o o o c. o
O cd CO LO r-H lP CO » H CN
0) P rv e rv i »V
5-1 -P c n cn cn O \p c. cn
< c LT| m r-H c n vC r-H
c n vP <r CO o o c
*
t■ 4 t—H IP IP
Od o o o o o
P o o o o o
0) o o CO
rH cd * *
05 P 00 CN cn o CT\
i— 1 5-1-P <1- oo oo MO
cd cd 'Cf m MO CO o
4-1 •N ** * r\
o CN rH n- CM
H rH
O O o o O O
o P O o o o ■o o
5-i 4-1 rH O o o o o o
•H o p ** * *
< -p u CN o CN o CM o P. p rH up rH m rH m rH rH rH rH rH i—1
5-1 n- -p-
c-P M0 VP MO ip
05 O' cn Cn Cn Cn On 00
>4 rH rH rH rH rH rH rH rH
o P rH
•H p P p
-p P Pi •H 4J
p. O •H P o
p •H •H rH p P p
5-i 00 P P rH P
ÖC P 5-i rH P
O 5-1 P •H •H O rH
05 H CO K S P
O C4
[image:44.529.54.514.65.802.2]deterioration within the forest itself.
The apparent high forest loss between 1964 and 1977/78,
largely limited to the Terai region, was mostly the result of extensive clearing for agriculture and commercial timber operations aided by an increased fuelwood demand by the much larger population.
In the Siwaliks region there was a loss of 10.2% during this period, with the heaviest rate of depletion in the Sapta Kosi watershed.
In general the results of Landsat imagery analysis are similar to those obtained from analysis of aerial photographs.
Again, loss of forest area in the Hills region was shown to be insig
nificant, but average annual percentage losses in forest area
in the Terai region were somewhat higher (Table 2.7).
A quite different and fallacious view of the rate of recent deforestation can be obtained by comparing data which are not really comparable, in that they are based on different definitions of land use categories and are derived from different survey techniques. An example involving both errors is the statement of Metz-Fox (1983)
that a rough estimate of the decline in forest area in the Middle Hills between 1964 and 1975 can be gained from HMG Nepal (1973) and FAO/UNDP
(1980); the data being 4.6 Mha (by aerial photography) and 3.1 Mha
(by Landsat imagery) respectively. A loss of c. 33% in a decade
1 9 7 9 lo s s X nO c o rH rH l
1 1 i i
< T NT CO • H : 1 : 2 5 0 , 0 0 0 . ; 1 o n ( 1 9 8 3 ) . 1 O ' rH u >
o An
n u a l h a — -r 2 5 . 5 vO
l 1 1 i i
3
0
.
5 NT
CM
r H <J)
03 T * U 5
o f fo r e s t
o O o O
H cS
> t M
lo
s
s
X
0 0 < r
1
1 i i
m rH
a a 6 0 c e W " c H ro 03 tfl H T 3 a
CO CO 9
o o o O
o T o ta l h a rH
nO s
l 1 1 1
m c o
m o
03 03
c c
-o v) a
o
•u o —« cni VO CO CO < r UO CO
CNI r ( O ON CM ^
, b a s e d le s o u rc u > O
O ^ C -o a
-s ^ m O o o o o
vO — 4 < r l o s
m o o
CO On
m c o
c o ON
8
5
,
8
2 cm
m ^
ON u ON d) r H i J
4J to QJ
o o o o r ~ \ C
c o o o (Nl 0 0
CM o o o o m < r
m O o o ON u o vO < r
o o o o O M3
o o o o
CO O o O O NO NO CN| ^ 5
On u-4 £ d> c t <
i s
c o cni
< r m vO r*N LO t/N
vC o o o < r u o r »
t o CNI
£ < r
CN|
CNI NO O — « 0 0 ON CM o o o o CM CM
—4 NO m N r
03 >n
Ü 4J 03 <0 ^ C r —I
la n d a re a h a o o O m O o o o o O CNI o NT O m o rH
8 ^ °
i - l 2 c o o o vO CNI vO o O ON CO CO o o CO ON £ CNI o CM CO 0 0 o S O CM
t u C .
CO CNJ CM
w O o r rH "Zl
-V B
d) o
•H (T3
u u
w n
US Q u
. o c
Q . O r j *h
u OO
oo <y
o >- o o
a > o n
r H rH CM ON ON On
r H rH
CM ON CM ON CNI On
On On On O ' ON O ' r H r H r H r H r H r H
C -C •u H o o 1/3 CO a; S u w 3 cn "c M U £ •o a *H W d> U U> U, 3 T 3
d> . V) d)
CTj rH
a . n U nj
U rH
C -h
**H CÖ cO
u u
O "3 C V) TJ W C CT3 cd O -J 03 cni C ON *»H rH
VM U
UH U
*H O Q Ou