Enterprise and Industry
Union
Scoreboard
More information on the European Union is available on the Internet (http://europa.eu) Cataloguing data can be found at the end of this publication.
Cover picture: Fotolia_4679488 © nfrPictures_L © European Union, 2013
Reproduction is authorised provided the source is acknowledged. Printed in Belgium
PRINTED ON CHLORINE FREE PAPER
This report was prepared by: Hugo Hollanders and Nordine Es-Sadki from the
Maastricht Economic and Social Research Institute on Innovation and Technology (UNU-MERIT). With inputs from:
Stefano Tarantola, DG JRC G3 - Econometrics and applied statistics, European Commission
Coordinated and guided by:
Bonifacio Garcia Porras, Head of Unit, and Tomasz Jerzyniak Unit B3 – Innovation Policy for Growth
Directorate B – Sustainable Growth and EU 2020 Directorate-General for Enterprise and Industry,
European Commission Freephone number (*):
00 800 6 7 8 9 10 11
The Innovation Union Scoreboard report and annexes and the indicators’ database are available at
8
1 INTRODUCTION10
2 INNOVATION UNION SCOREBOARD: FINDINGS FOR MEMBER STATES10 2.1 Innovation performance 11 2.2 Growth performance 2008-2012
14 2.3 Performance changes since the launch of the Europe 2020 strategy 16 2.4 Innovation dimensions
19
3 COMPARISON OF EU27 INNOVATION PERFORMANCE WITH KEY BENCHMARK COUNTRIES19 3.1 A comparison with other European countries 20 3.2 A comparison with global competitors
28
4 COUNTRY PROFILES62
5 INNOVATION AT THE REGIONAL LEVEL62 5.1 Regional Innovation Scoreboard
64 5.2 Regional innovation and socio-economic performance 64 5.3 Regional research cooperation patterns of SMEs
65
6 TECHNICAL ANNEX65 6.1 Calculating composite scores 66 6.2 Calculating growth rates 66 6.3 International benchmarking
67 ANNEX A Defi nitions of indicators
70 ANNEX B Current performance
72 ANNEX C Growth performance
74 ANNEX D Country abbreviations
74 ANNEX E Summary Innovation Index (SII) time series
75 ANNEX F Performance scores per dimension
Innovation Union Scoreboard 2013: the
first edition reflecting the impact of the
economic crisis
This year's edition offers a unique opportunity to measure the first effects of the economic crisis on the research and innovation landscape in Europe. It uses the most recent available data from Eurostat and other internationally recognised sources with data referring to 2011 for 12 indicators and 2010 for 9 indicators and to less recent years for only 3 indicators. Six indicators are derived from the recently published Community Innovation Survey 2010, which investigated the innovation activity of the European enterprises during the crisis years 2008-2010.
The Innovation Union Scoreboard 2013 gives a comparative assessment of the innovation performance of the EU27 Member States and the relative strengths and weaknesses of their research and innovation systems. It monitors innovation trends across the EU27 Member States, as well as
Croatia, Iceland, the Former Yugoslav Republic of Macedonia, Norway, Serbia, Switzerland and Turkey. It also includes comparisons between the EU27 and 10 global competitors. The overall ambition of the Innovation Union Scoreboard is to inform policy discussions at national and EU level, by tracking progress in innovation performance within and outside the EU over time. The Innovation Union Scoreboard is accompanied by the Regional Innovation Scoreboard 2012, the pilot European Public Sector Innovation Scoreboard and analytical reports on among others regional research cooperation patterns of European SMEs and the link between regional innovation and socio-economic performance.
Member States analysed by eight
inno-vation dimensions and 25 indicators…
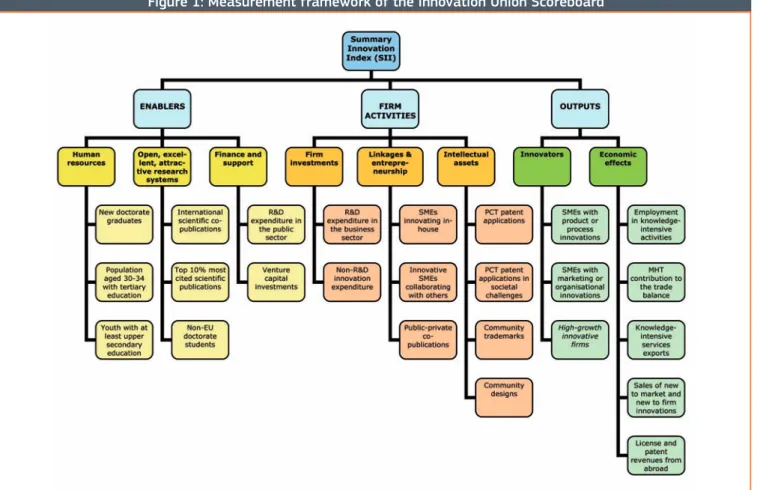
The measurement framework used in the Innovation Union Scoreboard distinguishes between 3 main types of indicators and 8 innovation dimensions, capturing in total 25 different indicators (Figure 1).
The Enablers capture the main drivers of innovation performance external to the firm and cover 3 innovation dimensions: Human resources, Open, excellent and attractive research systems as well as Finance and support. Firm activities
capture the innovation efforts at the level of the firm, grouped in 3 innovation dimensions: Firm investments, Linkages & entrepreneurship and
Intellectual assets. Outputs cover the effects
of firms’ innovation activities in 2 innovation dimensions: Innovators and Economic effects.
…and based on their average
inno-vation performance are put into four
performance groups.
•
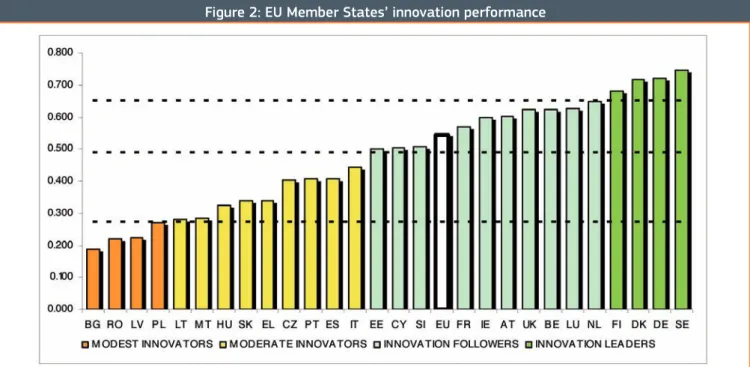
The performance of Denmark, Finland, Germany and Sweden is well above that of the EU27 average. These countries are the ‘Innovation leaders’.•
Austria, Belgium, Cyprus, Estonia, France, Ireland, Luxembourg, Netherlands, Slovenia and the UK allshow a performance above or close to that of the EU27 average. These countries are the ‘Innova-tion followers’.
•
The performance of Czech Republic, Greece, Hungary, Italy, Lithuania, Malta, Portugal, Slovakia and Spain is below that of the EU27 average. These countries are ‘Moderate innovators’.•
The performance of Bulgaria, Latvia, Poland and Romania is well below that of the EU27 average. These countries are ‘Modest innovators’.The overall ranking remains relatively
stable with Sweden confirming its
inno-vation leadership…
Overall innovation performance ranking remains relatively stable compared to previous IUS editions with Sweden confirming its EU innovation leadership for the third time in a row. It is followed by Germany that switched ranks with Denmark. Finland closes the group of the most innovative Member States.
Figure 2: EU Member States’ innovation performance
Note: Average performance is measured using a composite indicator building on data for 24 indicators going from a lowest possible performance of 0 to a maximum possible performance of 1. Average performance reflects performance in 2010/2011 due to a lag in data availability.
… but several changes inside the
perfor-mance groups take place.
Though, there are several upward and downward movements inside each of the performance groups. The Netherlands becomes the top innovation follower and Italy remains the top innovator in the moderate performance group. The bottom end of the ranking is closed by Romania and Bulgaria both being outpaced by Latvia that occupied the last position a year ago.
Two Member States changed the performance group: Lithuania advanced to the moderate innovators and Poland moved down becoming a modest innovator. It should be however noted, that in both cases the change in performance group was due to marginal changes of the innovation performance.
The EU is increasing its innovation
per-formance with Estonia being the
unques-tionable innovation growth leader…
Overall, the EU annual average growth rate of innovation performance reached 1.6% over the analysed five-year period 2008-2012.While almost all Member States improved their innovation performance, Estonia is by far the European innovation growth leader that grew with an average annual rate of 7.1%. It is followed by Lithuania and Latvia that improved at average annual rates of 5.0% and 4.4% respectively. The lowest positive innovation growth rates were recorded in Poland (0.4%), Bulgaria (0.6%) and Sweden (0.6%). In two Member States, Greece and Cyprus, innovation performance has declined at an average annual rate of 1.7% and 0.7% respectively.
… but the innovation divide between the
Member States is widening.
The results for this year show the process of convergence in innovation performance within the EU has come to a halt: Less innovative countries as a group are no longer catching-up with the most innovative countries. This means that differences in innovation performance in the European Union have started to increase signalling a possible start of a process of divergence in Member States’ innovation performance.
While SMEs and commercialisation of
innovation drive the innovation growth…
When looking at individual indicators, the EU innovation performance was driven most by
Innovating SMEs collaborating with others with
an annual average growth rate of 7.9% on that indicator. Other key drivers of innovation performance in Europe were License and patent
revenues from abroad as well as Community
trademarks with growth rates of 6.1% and 5.2%
respectively. Open, excellent and attractive research systems was another driver where the indicators for Non-EU doctorate students and International scientific publications grew at annual average rates of 4.1% and 4.0% respectively.
… business and venture capital
invest-ments are dropping the most.
The economic impact has its harshest impact on
Non R&D innovation expenditures which dropped by 5.2% annually, followed by Venture capital investments that were declining at an average rate of 3.1% annually. The finance and support to innovation was cushioned by R&D expenditures in the public sector which increased at an annual average rate of 3.2%. In general, a performance decline or lack of progress was observed on indicators that are affected by short-term decisions, while performance continued to improve on indicators that reflect decisions taken a longer period ago.
The progress since the launch of the
Europe2020 strategy is insufficient…
… as mostly strong innovators increase
their innovation growth rates.
Altogether the innovation leaders and followers managed to increase their innovation growth rates over the crisis period 2008-2012 while in the groups of moderate and modest innovators growth rates plummeted. A trend of divergence emerges where the leading innovators are getting even stronger while moderate and modest innovators fail to catch up.
Key strengths of innovation leaders are
busi-ness activity and higher education sector…
The most innovative countries in the EU share a number of strengths in their national research and innovation systems with a key role of business activity and the higher education sector. The business sectors of all innovation leaders perform very well as measured by Business R&D expenditures and PCT patent applications. They also share a well-developed higher education sector as shown by very high scores on New doctorates graduates, International scientific
co-publications and Public-private co-publications
with the latter also signalling strong linkages between industry and science.
… as well as balanced national research
and innovation systems.
The overall good performance of the innovation leaders reflects a balanced national research and innovation system. It means that the innovation leaders have the smallest variance in their performance across all the 8 innovation dimensions. While each country has its own specificities, policy responses should attempt not only to address relative weaknesses in national research and innovation systems, but also to have more balanced performances across all categories of indicators.
Switzerland repeatedly outperforms all
EU Member States…
Taking into account European countries outside the EU, Switzerland confirms its position as the overall Innovation leader continuously outperforming all EU27 countries. Iceland is one of the Innovation followers, Croatia, Norway and Serbia are Moderate innovators and the Former Yugoslav Republic of Macedonia and Turkey are Modest innovators.
… and South Korea and the US lead in a
global international comparison.
Comparing the EU27 with a selected group of major global competitors, this year's Innovation Union Scoreboard edition again confirms that the US, Japan and South Korea have a performance lead over the EU27 with South Korea joining the US as most innovative country. Although this lead has been increasing for South Korea, the EU27 has been able to close almost half of the gap with the US and Japan since 2008. The global innovation leaders US, Japan and South Korea are particularly dominating the EU27 in indicators capturing business activity as measured by R&D expenditures in the business sector, Public-private co-publications and PCT patents but also in educational attainment as measured by the Share of population having completed tertiary education.
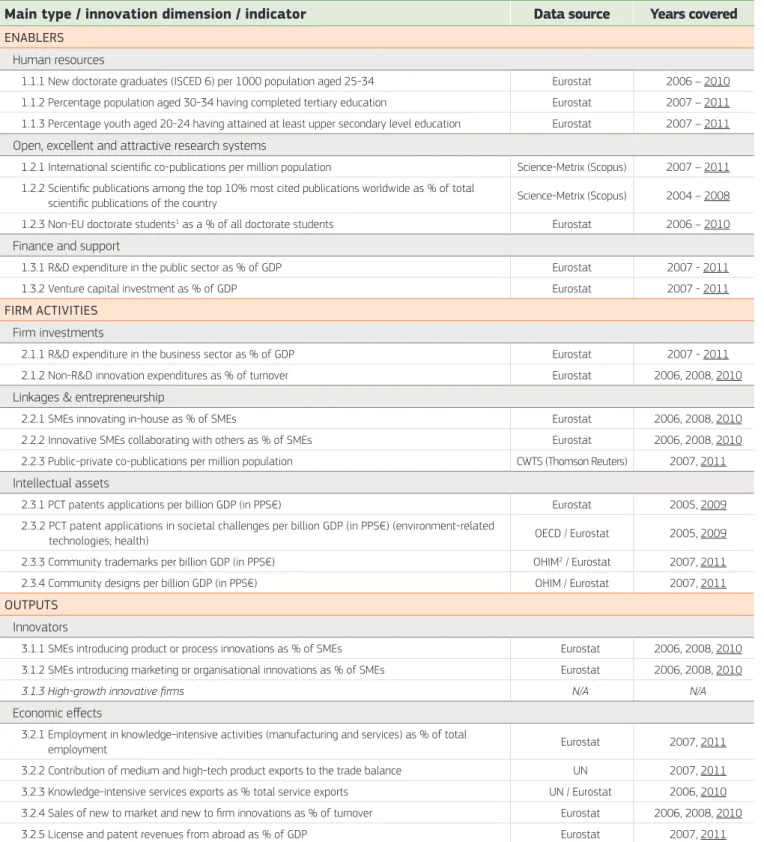
The Innovation Union Scoreboard 2013 follows the methodology of previous editions in distinguishing between 3 main types of indicators – Enablers, Firm activities and Outputs – and 8 innovation dimensions, capturing in total 24 indicators. The IUS indicators are listed in Table 1 and full definitions are presented in Annex C.
The Enablers capture the main drivers of innovation performance external to the firm and differentiates between 3 innovation dimensions. ‘Human resources’ includes 3 indicators and measures the availability of a high-skilled and educated workforce. The indicators capture new doctorate graduates, those aged 30-34 with completed tertiary education and those aged 20-24 having completed at least upper secondary education. ‘Open, excellent and attractive research systems’ includes 3 indicators and measures the international competitiveness of the science base by focusing on the international scientific co-publications, most cited publications and non-EU doctorate students. ‘Finance and support’ includes 2 indicators and measures the availability of finance for innovation projects by venture capital investments and the support of governments for research and innovation activities by R&D expenditures by universities and government research organisations.
Firm activities capture the innovation efforts at the level of the firm and it differentiates between 3 innovation dimensions. ‘Firm investments’ includes 2 indicators of both R&D and non-R&D investments that firms make in order to generate innovations. ‘Linkages & entrepreneurship’ includes 3 indicators measuring innovation capabilities by looking at SMEs with that innovate in-house and collaboration efforts between innovating firms and research collaboration between the private and public sector. ‘Intellectual assets’ captures different forms of Intellectual Property Rights (IPR) generated as a throughput in the innovation process including PCT patent applications, Community trademarks and Community designs.
Outputs capture the effects of firms’ innovation
activities and it differentiates between 2 innovation dimensions. ‘Innovators’ includes 3 indicators measuring the share of firms that have introduced innovations onto the market or within their organisations, covering both technological and non-technological innovations and the presence of high-growth firms. The indicator
on innovative high-growth firms corresponds to the new EU2020 headline indicator which is under development. ‘Economic effects’ includes 5 indicators and captures the economic success of innovation in employment in knowledge-intensive activities, the contribution of medium and high-tech product exports to the trade balance, exports of knowledge-intensive services, sales due to innovation activities and license and patent revenues from selling technologies abroad.
The Innovation Union Scoreboard uses the most recent statistics from Eurostat and other internationally recognised sources as available at the time of analysis. International sources have been used wherever possible in order to improve comparability between countries. It is important to note that the data relates to actual performance in 2008 (1 indicator), 2009 (2 indicators), 2010 (9 indicators) and 2011 (12 indicators) (these are the most recent years for which data are available as highlighted by the underlined years in Table 1). As a consequence the Innovation Union Scoreboard 2013 does not capture the most recent changes in innovation performance or the impact of policies introduced in recent years which may take some time to impact on innovation performance.
Table 1: Innovation Union Scoreboard indicators
Main type / innovation dimension / indicator
Data source
Years covered
ENABLERS
Human resources
1.1.1 New doctorate graduates (ISCED 6) per 1000 population aged 25-34 Eurostat 2006 – 2010 1.1.2 Percentage population aged 30-34 having completed tertiary education Eurostat 2007 – 2011 1.1.3 Percentage youth aged 20-24 having attained at least upper secondary level education Eurostat 2007 – 2011 Open, excellent and attractive research systems
1.2.1 International scientific co-publications per million population Science-Metrix (Scopus) 2007 – 2011 1.2.2 Scientific publications among the top 10% most cited publications worldwide as % of total
scientific publications of the country Science-Metrix (Scopus) 2004 – 2008
1.2.3 Non-EU doctorate students1 as a % of all doctorate students Eurostat 2006 – 2010
Finance and support
1.3.1 R&D expenditure in the public sector as % of GDP Eurostat 2007 - 2011
1.3.2 Venture capital investment as % of GDP Eurostat 2007 - 2011
FIRM ACTIVITIES
Firm investments
2.1.1 R&D expenditure in the business sector as % of GDP Eurostat 2007 - 2011
2.1.2 Non-R&D innovation expenditures as % of turnover Eurostat 2006, 2008, 2010 Linkages & entrepreneurship
2.2.1 SMEs innovating in-house as % of SMEs Eurostat 2006, 2008, 2010
2.2.2 Innovative SMEs collaborating with others as % of SMEs Eurostat 2006, 2008, 2010 2.2.3 Public-private co-publications per million population CWTS (Thomson Reuters) 2007, 2011 Intellectual assets
2.3.1 PCT patents applications per billion GDP (in PPS€) Eurostat 2005, 2009
2.3.2 PCT patent applications in societal challenges per billion GDP (in PPS€) (environment-related
technologies; health) OECD / Eurostat 2005, 2009
2.3.3 Community trademarks per billion GDP (in PPS€) OHIM2 / Eurostat 2007, 2011
2.3.4 Community designs per billion GDP (in PPS€) OHIM / Eurostat 2007, 2011
OUTPUTS
Innovators
3.1.1 SMEs introducing product or process innovations as % of SMEs Eurostat 2006, 2008, 2010 3.1.2 SMEs introducing marketing or organisational innovations as % of SMEs Eurostat 2006, 2008, 2010
3.1.3 High-growth innovative firms N/A N/A
Economic effects
3.2.1 Employment in knowledge-intensive activities (manufacturing and services) as % of total
employment Eurostat 2007, 2011
3.2.2 Contribution of medium and high-tech product exports to the trade balance UN 2007, 2011 3.2.3 Knowledge-intensive services exports as % total service exports UN / Eurostat 2006, 2010 3.2.4 Sales of new to market and new to firm innovations as % of turnover Eurostat 2006, 2008, 2010
3.2.5 License and patent revenues from abroad as % of GDP Eurostat 2007, 2011
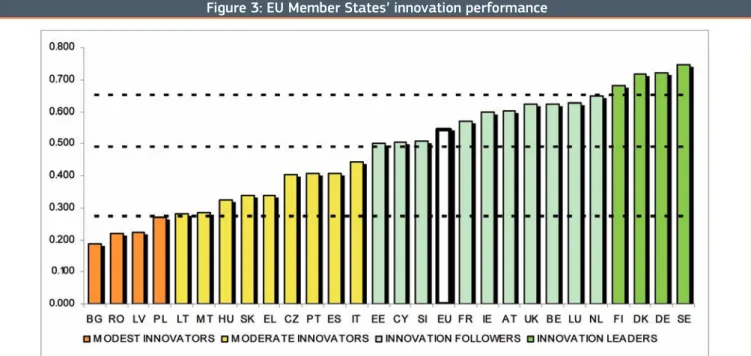
Figure 3: EU Member States’ innovation performance
Note: Average performance is measured using a composite indicator building on data for 24 indicators going from a lowest possible performance of 0 to a maximum possible performance of 1. Average performance reflects performance in 2010/2011 due to a lag in data availability.
The performance of Innovation leaders is 20% or more above that of the EU27; of Innovation followers it is less than 20% above but more than 10% below that of the EU27; of Moderate innovators it is less than 10% below but more than 50% below that of the EU27; and for Modest innovators it is below 50% that of the EU27.
2.1. Innovation performance
A summary picture of innovation performance is provided by the Summary Innovation Index, a composite indicator obtained by an appropriate aggregation of the 25 indicators used for measuring innovation performance3. Figure 3 shows the
per-formance results for the 27 EU Member States. Based on this year’s Summary Innovation Index, the Member States fall into the following four performance groups:
•
The performance of the Innovation leaders, including Denmark, Finland, Germany and Sweden, is well above that of the EU27 (i.e. more than 20% above the EU27 average).•
The Innovation followers show a performance close to that of the EU27 (i.e. less than 20% above but more than 10% below that of the EU27). Austria, Belgium, Cyprus, Estonia, France, Ireland, Luxembourg, Netherlands, Slovenia and the UK are the Innovation followers.•
The performance of the Moderate innovators is below that of the EU27 (i.e. between 50% and 90% of the performance of the E27). Czech Republic, Greece, Hungary, Italy, Lithuania, Malta, Portugal, Slovakia and Spain are all Moderate innovators.•
The Modest innovators show a performancelevel well below that of the EU27 (i.e. more than 50% below that of the EU27) and include Bulgaria, Latvia, Poland and Romania.
Compared to the IUS 2011 only Lithuania has
managed to improve group membership from
a Modest innovator in the IUS 2011 to a Moderate innovator in the IUS 2013. Poland has dropped from the group of Moderate innovators and is now a Modest innovator. All other countries are in the same performance group as last year4.
3 Technical Annex 6.1 gives a brief explanation of the calculation methodology. The IUS 2010 Methodology report provides a detailed explanation.
4 The IUS performance groups are relative performance groups with countries’ group membership depending on their performance relative to that of the EU27. With
2.2. Growth performance 2008-2012
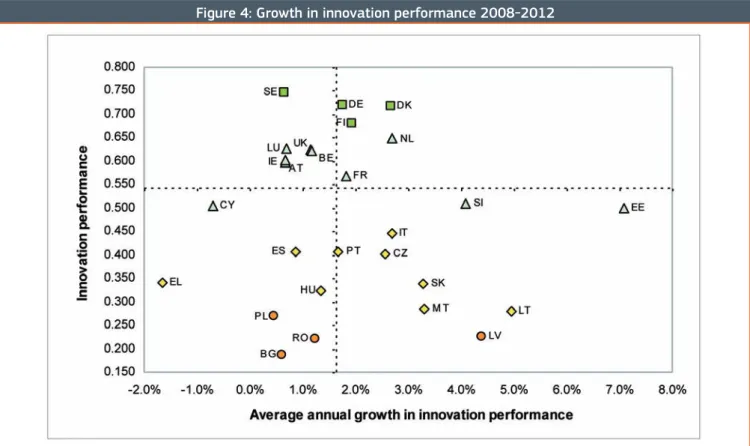
As in previous IUS editions changes in innovation perfor-mance are monitored over a five-year period. Over the period 2008-2012 all countries except Cyprus and Greece show an improvement in their innovation performance (Figure 4). Estonia has experienced the fastest annual average growth in performance (7.1%) of all Member States. For only two countries growth has been negative: where Cyprus is showing a small decline (-0.7%), Greece’s innovation performance is declining more rapidly at an annual average rate of -1.7%.
Less innovative countries on average are also no longer catching-up to more innovative countries. This type of convergence is known as beta-convergence and would be shown by a negative relation between the 2008 levels of innovation performance and innovation growth between 2008 and 2012. The discussion in Box 1
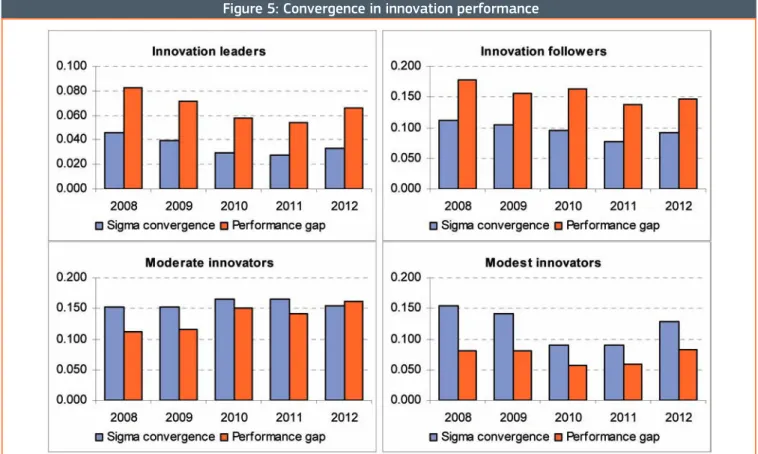
The overall process of convergence witnessed in
previous IUS editions has come to a halt. The spread in innovation performance as measured by sigma-convergence has started to increase in 2012 after having fallen continuously up until 2011 (see Box 1). Already last year these were signs of a slowing down of the convergence process as shown by a much smaller reduction in this spread in performance from 2010 to 2011 as compared to previous years.
shows that there is no statistical proof for the existence of such a negative relation for the IUS 2013 whereas such a negative relation was confirmed for previous IUS editions. Future IUS editions will show if this is a temporary stand-still of the convergence process or if it is the start of a more long lasting process of divergence.
Figure 4: Growth in innovation performance 2008-2012
Colour coding matches the groups of countries identified in Section 3.1. Average annual growth rates as calculated over a five-year period5.
Total growth over this five-year period can be derived by multiplying the average annual growth rate by 4. The dotted lines show EU27 performance and growth.
Within the four country groups growth performance is also very different with some countries growing relatively quickly and others more slowly (Table 2). Within the Innovation leaders, Denmark is the growth leader. Estonia and Slovenia are the growth leaders of the Innovation followers, Lithuania is the growth
leader of the Moderate innovators and Latvia is the growth leader of the Modest innovators. Differences in average annual growth rates between the four performance countries are relatively small with the Innovation leaders growing at an annual rate of 1.8% and the Modest innovators at 1.7%.
Box 1: Sigma- and beta-convergence
The overall process of catching up can be shown using two types of convergence commonly used in growth studies: sigma-convergence and beta-convergence.
Beta-convergence applies if a less innovative country tends to grow faster than a more innovative country. Beta-convergence can be measured by the partial correlation between growth in innovation performance over time and its initial level: a significant negative correlation confirms beta-convergence. The correlation between “2008” innovation performance and 2008-2012 innovation growth is -0.220 but not significant indicating that there is no beta-convergence.
Sigma-convergence occurs when the spread in innovation performance across a group of economies falls over time. This spread in convergence is measured by the ratio of the standard deviation and the average perfor¬mance of all EU27 Member States. As shown in the graph, this spread has been reduced up until last year confirming sigma-convergence but the rate of sigma-convergence has been slowing down and has even reversed into divergence in 2012:
differences in countries’ innovation performance have started to increase.
Table 2: Innovation growth leaders
Group
Growth rate
2008-2012
Growth leaders
Moderate growers
Slow growers
Innovation leaders 1.8% Denmark (DK 2.7%) Finland (FI 1.9%)Germany (DE 1.8%) Sweden (SE 0.6%)
Innovation followers 1.9% Estonia (EE 7.1%)
Slovenia (SI 4.1%)
Netherlands (NL 2.7%) France (FR 1.8%) United Kingdom (UK 1.2%) Belgium (BE 1.1%) Luxembourg (LU 0.7%) Austria (AT 0.7%) Ireland (IE 0.7%)
Cyprus (CY -0.7%)
Moderate innovators 2.1% Lithuania (LT 5.0%)
Malta (MT 3.3%) Slovakia (SK 3.3%) Italy (IT 2.7%)
Czech Republic (CZ 2.6%) Portugal (PT 1.7%) Hungary (HU 1.4%) Spain (ES, 0.9%)
Greece (GR -1.7%)
Modest innovators 1.7% Latvia (LV 4.4%) Romania (RO 1.2%)Bulgaria (BG 0.6%) Poland (PL 0.4%)
Convergence has also been the dominant phenomenon within 3 of the 4 performance groups up until 2011, only within the Moderate innovators performance was already diverging (Figure 5). This convergence process up until 2011 is confirmed by both the development
For the EU27 innovation performance has increased at an average rate of 1.6% over
the period 2008-2012. Growth has been above
average in Open, excellent and attractive research systems (3.3%) and Linkages & entrepreneurship (3.4%), in particular due to high growth in International scientific co-publications, Non-EU doctorate students and Innovative SMEs collaborating with others (Figure 6). Growth has been close to average for Human resources, Intellectual assets, Innovators and Economic effects despite high growth in Population aged 30-34 with completed tertiary education, Community trademarks, SMEs having introduced
in sigma-convergence and the performance gap in each performance group. But for 2012 the process of convergence has been reversed to one of divergence for the Innovation leaders, Innovations followers and Modest innovators.
a new product or process innovation and License and patent revenues from abroad. For Finance and support growth has been close to 0%, where above average growth in R&D expenditures in the public sector has been offset by negative growth in Venture capital investments. For Firm investments growth has been negative due to Non-R&D innovation expenditures declining at a rate of 5.2%. The decline in Non-R&D innovation expenditures is observed for the majority of Member States, only in Lithuania and the Netherlands these expenditures have increased significantly.
Figure 5: Convergence in innovation performance
2.3. Performance changes since the launch of the Europe 2020 strategy
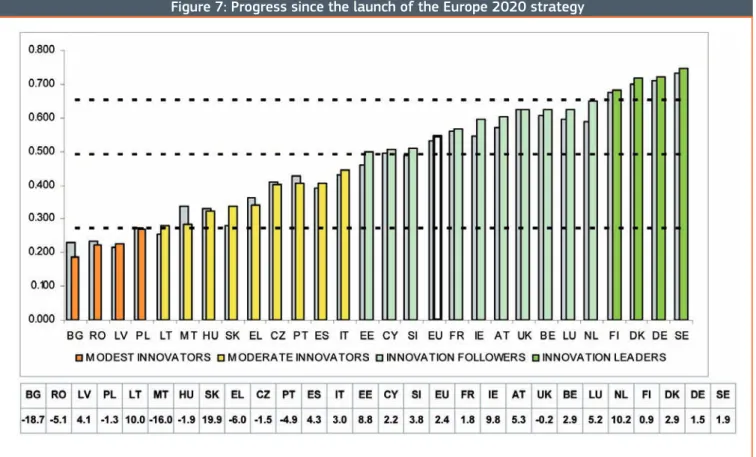
quite small but for Greece (-6.0%), Portugal (-4.9%) and in particular Malta (-16.0%) performance has decreased more significantly. For two Modest innovators performance has also decreased: for Romania (-5.1%) and most notably for Bulgaria (-18.7%).
These results match those shown in section 3.2 that the overall process of convergence up until 2011 is followed by increasing differences in Member States’ innovation performance in 2012. The divergence in 2012 is the result of the fact that innovation performance has declined for almost half of the Moderate and Modest innovators whereas it keeps improving for all Innovation leaders and Innovation followers.
Figure 6: EU27 Growth performance
The shaded area gives the average growth rate for the EU27 for all indicators.
The Europe 2020 Innovation Union flagship initiative was launched by the European Commission in October 2010 aiming to improve Europe’s innovation performance. In this section the IUS 2013 analyses progress made since late 2010 by comparing innovation performance for 2012 with that of 2010 using the IUS 2013 indicators.
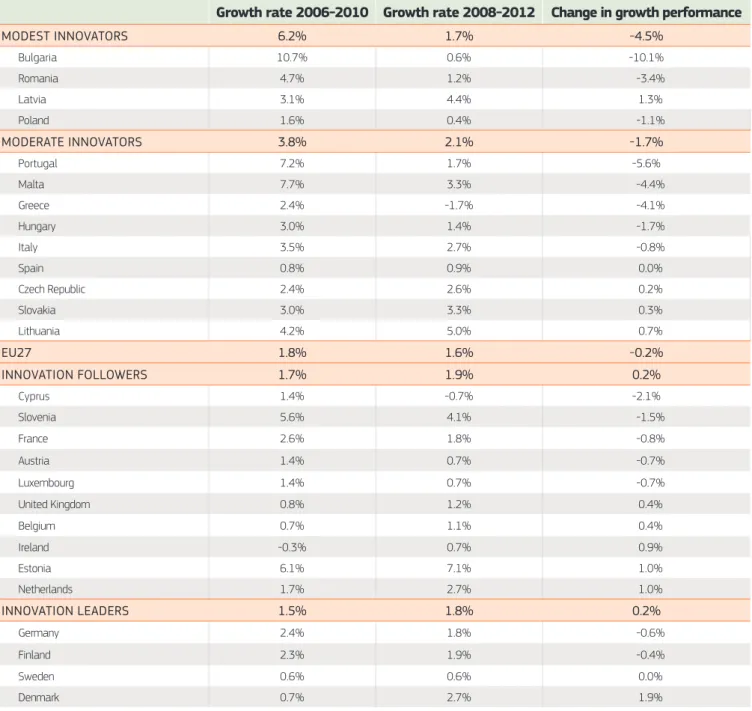
There is a marked difference in the change in five-year growth performance in the 2006-2010 period as captured in the IUS 2010 and that in 2008-20126. Where the Innovation leaders and Innovation
followers have managed to sustain their growth performance, five-year growth for the Moderate innovators has declined on average by 1.7%-points and for the Modest innovators by 4.5%-points (Table 3). But within these performance groups we also observe remarkable differences. Within the Modest innovators growth has plummeted from almost 11% to just 0.6% for Bulgaria and also for Romania growth has dropped more than 3%-points. Within the Moderate innovators five-year growth has dropped significantly for Greece, Malta and Portugal. Only Czech Republic, Lithuania and Slovakia have managed to increase their growth rates for 2008-2012 as compared to 2006-2010. Half of the Innovation followers have experienced a slowdown in their growth performance, in particular
Cyprus and Slovenia. For Belgium, the UK and in particular Estonia, Ireland and the Netherlands growth performance has improved. Slower growth is also observed for two of the Innovation leaders: Finland and Germany. For Sweden growth has remained the same but Denmark has managed to more than triple its growth. Overall for 15 Member States growth in 2008-2012 has been slowing down compared to growth in 2006-2010 clearly contributing to slower growth for the EU27 at large dropping from 1.8% for 2006-2010 to 1.6% for 2008-2012.
Figure 7: Progress since the launch of the Europe 2020 strategy
The grey coloured columns show performance in 2010 as measured using the IUS 2013 set of indicators.
The change in innovation performance between 2010 and 2012 is equal to the percentage change between the innovation indexes for 2010 and 2012 as shown on the vertical axis.
6 The growth rates for 2006-2010 are not identical to those reported in the IUS 2010 as the set of indicators has changed and also the reference years used
2.4. Innovation dimensions
Where section 3.1 introduced four performance groups based on countries’ average performance on 24 innova-tion indicators, a more interesting pattern emerges when we compare performance of these groups across the dif-ferent dimensions (Figure 8). The Innovation leaders have the smallest variation in their performance across the 8 dimensions (Table 4), confirming last year’s result that
to achieve a high level of performance countries need a balanced innovation system performing well across all dimensions. The Innovation leaders perform best on all dimensions, followed by the Innovation followers. The Moderate innovators perform better on most dimensions than the Modest innovators, but the latter come close on Human resources and Intellectual assets.
Table 3: Change in growth performance
Growth rate 2006-2010 Growth rate 2008-2012 Change in growth performance
MODEST INNOVATORS 6.2% 1.7% -4.5%
Bulgaria 10.7% 0.6% -10.1%
Romania 4.7% 1.2% -3.4%
Latvia 3.1% 4.4% 1.3%
Poland 1.6% 0.4% -1.1%
MODERATE INNOVATORS 3.8% 2.1% -1.7%
Portugal 7.2% 1.7% -5.6%
Malta 7.7% 3.3% -4.4%
Greece 2.4% -1.7% -4.1%
Hungary 3.0% 1.4% -1.7%
Italy 3.5% 2.7% -0.8%
Spain 0.8% 0.9% 0.0%
Czech Republic 2.4% 2.6% 0.2%
Slovakia 3.0% 3.3% 0.3%
Lithuania 4.2% 5.0% 0.7%
EU27 1.8% 1.6% -0.2%
INNOVATION FOLLOwERS 1.7% 1.9% 0.2%
Cyprus 1.4% -0.7% -2.1%
Slovenia 5.6% 4.1% -1.5%
France 2.6% 1.8% -0.8%
Austria 1.4% 0.7% -0.7%
Luxembourg 1.4% 0.7% -0.7%
United Kingdom 0.8% 1.2% 0.4%
Belgium 0.7% 1.1% 0.4%
Ireland -0.3% 0.7% 0.9%
Estonia 6.1% 7.1% 1.0%
Netherlands 1.7% 2.7% 1.0%
INNOVATION LEADERS 1.5% 1.8% 0.2%
Germany 2.4% 1.8% -0.6%
Finland 2.3% 1.9% -0.4%
Sweden 0.6% 0.6% 0.0%
Country rankings for each innovation dimension are shown in Figure 9. The Innovation leaders dominate performance in Finance and support, Firm investments, Intellectual assets and Economic effects and to a lesser extent in Linkages & entrepreneurship as is also shown by their low average rank performance for these dimensions (Table 4). The Innovation followers perform relatively well in Human resources, Open, excellent and attractive research
Figure 9 also shows that none of the Modest innovators manages to perform above the EU27 average for any of the 8 innovation dimensions. The Moderate innovators manage to perform better than the EU27 seven times, in Human resources (2), Open, excellent and attractive
systems and Linkages & entrepreneurship. The Moderate innovators perform relatively well in Firm investments and Innovators and the Modest innovators perform rela-tively well in Finance and support and Intellectual assets. Variation in Member States’ performance is smallest in Human resources, Firm investments and Economic effects and largest in Open, excellent and attractive research systems, Linkages & entrepreneurship and Innovators.
research systems (1), Firm investments (1) and Innovators (3). The Innovators followers combine above and below average performance on all dimensions in line with the fact that 3 Innovation followers have an overall performance score below that of the EU27
Figure 8: Country groups: innovation performance per dimension
Table 4: Average rank performance and variation
Variation
innovators
Modest
innovators
Moderate
Innovation
followers
Innovation
leaders
Variation
1.49% 0.58% 0.54% 0.26%Average
rank
Average
rank
Average
rank
Average
rank
Innovation performance
26.0 19.5 9.5 2.5Human resources 2.34% 22.0 19.8 9.8 6.5
Research systems 6.25% 26.5 19.0 9.1 6.3
Finance and support 4.62% 21.8 20.0 11.2 4.3
Firm investments 2.37% 24.5 18.9 11.5 2.8
Linkages & entrepreneurship 6.19% 26.5 20.0 8.4 5.5
Intellectual assets 4.65% 23.0 20.9 10.6 3.0
Innovators 6.10% 26.5 16.1 11.5 6.5
and 7 Innovation followers have a score above that of the EU27. None of the Innovation leaders performs below average on any of the 8 innovation dimensions highlighting their balanced innovation system.
Several countries perform much better than expected based on their performance group. Slovakia and Lithuania, both Moderate innovators, perform above average on Human resources. Slovakia performs very well due to its very strong performance in New doctorate graduates and Youth with upper secondary level education. Lithuania performs above average due to its relatively good performance in Population aged 30-34 with completed tertiary education and Youth with upper secondary level education.
The Netherlands has the most open, excellent and attractive research system due to its strong performance in both International scientific co-publications and Most cited publications. However, as data for Non-EU doctorate students are not available, average Dutch performance for this dimension is measured using data for only two indicators whereas for most of the other countries it is based on three indicators.
The United Kingdom performs best in Linkages & entrepreneurship as a result from having the highest share of Innovative SMEs collaborating with others. Also for the UK average performance is measured using data for only two indicators as data on the share of SMEs innovating in-house are not available.
Portugal performs very well on the Innovators dimension due to a 20% higher share of both SMEs introducing product or process innovations and SMEs introducing marketing or organisational innovations as compared to the average shares for the EU27. Also Greece performs above average for this dimension due to the very high share of SMEs introducing marketing or organisational innovations.
3. Comparison of EU27 innovation
perfor-mance with key benchmark countries
This section focuses on a comparison with other European countries in section 4.1 and with the EU27’s global competitors in section 4.2.
3.1. A comparison with other European countries
Switzerland is the overall innovation leader, outperforming all Member States (Figure 10). Its growth performance of 0.5% in the last five years is below that of the EU27. Swit-zerland’s strong performance is linked to being among the top-3 performers for 15 indicators, in particular in Open, excellent and attractive research systems where it has best performance in all three indicators, Firm investments, Intellectual assets, Innovators and Economic effects. Swit-zerland’s relative weakness is in having below average shares of SMEs innovating in-house, SMEs collaborating with others and Knowledge-intensive services exports.
Iceland is an Innovation follower and has the highest performance in three indicators: International scientific
The Former Yugoslav Republic of Macedonia and Turkey are Modest innovators. Both countries perform below average for most indicators, but also show particular strengths. Turkey scores top-5 positions for SMEs intro-ducing marketing or organisational innovations and for
co-publications, Public R&D expenditures and Public-private co-publications. Iceland’s growth performance is above that of the EU27 with an average annual growth rate of 2.6. Croatia, Norway and Serbia are Moderate in-novators with Norway’s innovation performance coming close to that of the Innovation followers in particular due to its strong performance in Open, excellent and attrac-tive research systems. Croatia has the overall highest performance in Youth with upper secondary education and Serbia performs very well in Non-R&D innovation expenditures. Norway’s innovation performance has im-proved at a below average rate of 0.9% whereas Croatia (2.1%) and in particular Serbia (6.8%) have grown at a faster rate than that of the EU27.
Sales of new-to-market and new-to-firm products and Macedonia for the Contribution of medium and high-tech products to the trade balance. Both countries have im-proved their innovation performance at a rate above that of the EU27 at 2.6% for Macedonia and 3.6% for Turkey.
Figure 10: European countries’ innovation performance
3.2. A comparison with global competitors
This section provides a comparison of the EU27 with some of its main global competitors including Austral-ia, the BRICS countries (Brazil, China, IndAustral-ia, Russia and South Africa), Canada, Japan, South Korea and the US.
The EU27 has managed to significantly close its performance gap with both the US and Japan
but the gap with South Korea has increased. The EU27 has increased its performance lead over Australia and Canada and has kept its lead over Brazil, India, Russia and South Africa. Of the BRICS countries only the
performance lead over China has decreased.
For these countries data availability is more limited than for the European countries (e.g. comparable inno-vation survey data are not available for many of these countries). Furthermore, the economic and/or popula-tion size of these countries outweighs those of many of the individual Member States and we thus compare
these countries with the aggregate of the Member States or the EU27.
For the international comparison of the EU27 with these global competitors a more restricted set of 12 indicators (Table 5) is used of which most are nearly identical to those used in section for comparing performance of the EU Mem-ber States (cf. Table 1). Most of these indicators focus on performance related to R&D activities (R&D expenditures, publications, patents) and there are no indicators using in-novation survey data as such data are not available for all countries or are not directly comparable with the European CIS data. The indicator measuring the share of the popula-tion aged 30 to 34 having completed tertiary educapopula-tion has been replaced by the same indicator but for the larger age group 25 to 64 as more detailed age group data are not available for most countries. Data availability for China and South Africa has improved compared to the IUS 2011.
Table 5: Indicators used in the international comparison
Main type / innovation dimension / indicator
Data source
Most recent
year
available for
Date not
ENABLERS
Human resources
1.1.1 New doctorate graduates (ISCED 6) per 1000 population aged 25-34 OECD, Eurostat 2010 India 1.1.2 Percentage population aged 25-64 having completed tertiary education OECD, World Bank, Eurostat 2010
Open, excellent and attractive research systems
1.2.1 International scientific co-publications per million population Science-Metrix (Scopus) 2011 Australia, Ca nada, South Africa
1.2.2 Scientific publications among the top 10% most cited publications world-wide as % of total scientific publications of the country
Science-Metrix
(Scopus) 2008
Australia, Ca nada, South Africa Finance and support
1.3.1 R&D expenditure in the public sector as % of GDP OECD, Eurostat 2010
FIRM ACTIVITIES
Firm investments
2.1.1 R&D expenditure in the business sector as % of GDP OECD, Eurostat 2010 Linkages & entrepreneurship
2.2.3 Public-private co-publications per million population CWTS (Thomson Reuters) 2008 Intellectual assets
2.3.1 PCT patents applications per billion GDP (in PPS€) OECD, Eurostat 2010 Brazil 2.3.2 PCT patents applications in societal challenges per billion GDP (in PPS€)
(environment-related technologies; health) OECD, Eurostat 2009
OUTPUTS
Economic effects
3.2.2 Contribution of medium and high-tech product exports to the trade balance UN, Eurostat 2011
Figure 11 summarizes the performance for the EU27 and its major global competitors7. Innovation
performance in the US, Japan and South Korea is above that of the EU27. Compared to last year’s results,
South Korea has joined the US as the global
innovation leader. The EU27 is outperforming
the other countries, in particular all BRICS countries. South Korea has joined the US as the most innovative country compared to the IUS 2011.
The dynamic innovation performance over a five-year period is shown in Figure 12. The EU27’s performance lag to South Korea has almost tripled. The EU27 is closing its performance gap to Japan and the US and is increasing its lead over Australia and Canada. The performance lead compared with the other countries is more stable and even slightly increasing with Brazil, India, Russia and South Africa. Of the BRICS countries only China is gradually closing the gap with the EU27.
7 The methodology for calculating average innovation performance is explained in the Technical Annex 6.3.
Figure 11: EU27 innovation performance compared to main competitors
Figure 12: EU27 change in innovation performance compared to main competitors
The numbers in the graphs show the performance lead/gap of each country compared to the EU27. A score above 0 shows that the country has a performance lead (e.g. a score of 20 says that the country is performing 20% better than the EU27), a score below 0 shows that the country has a performance gap (e.g. a score of -20 says that the country is performing 20% worse than the EU27).
3.2.1. Global innovation leaders
The United States is performing better than the EU27 in 7 indicators, in particular in Tertiary education, R&D ex-penditure in the business sector and Public-private co-publi-cations (Figure 13). The EU27 has a small performance lead in R&D expenditure in the public sector, PCT patents, PCT patents in societal challenges and Contribution of medium-high-tech product exports to the trade balance. Overall there is a clear performance lead in favour of the US but this lead has been declining. The US has increased its lead in New
Japan is performing better than the EU27 in 6 indica-tors, in particular in Tertiary education, R&D expenditure in the business sector, Public-private co-publications, PCT patents and PCT patents in societal challenges (Figure 14). For New doctorate graduates, International co-pub-lications, Most cited pubco-pub-lications, R&D expenditure in the public sector, Knowledge-intensive services exports and License and patent revenues from abroad the EU27 is performing better than Japan. Overall there is a clear per-formance lead in favour of Japan but this lead has been
doctorate graduates and R&D expenditure in the business sector and has reversed its lag in Knowledge-intensive ser-vices exports into a performance lead. The US lead has de-creased in Tertiary education, International co-publications, Most cited publications, Public-private co-publications and License and patent revenues from abroad. The US has lost its lead in PCT patents and PCT patents in societal chal-lenges. The EU27 has increased its lead in R&D expenditure in the public sector and Contribution of medium-high-tech product exports to the trade balance.
decreasing. Japan’s performance lead has decreased in Tertiary education, R&D expenditure in the business sector, Public-private co-publications, PCT patents, PCT patents in societal challenges and Contribution of medium-high-tech product exports to the trade balance. The EU27 has increased its lead in International co-publications, Most cited publications, R&D expenditure in the public sector, Knowledge-intensive services exports and License and patent revenues from abroad. The EU27 performance lead has decreased in New doctorate graduates.
Figure 13: EU27-US comparison
Figure 14: EU27-Japan comparison
South Korea is performing better than the EU27 in 8 indicators, in particular in R&D expenditure in the business sector, PCT patents and Knowledge-intensive services exports (Figure 15). The EU27 has a performance lead in New doctorate graduates, Most-cited publications, PCT patents in societal challenges and License and patent revenues from abroad. Overall there is a clear performance lead in favour of South Korea and this innovation lead has been increasing continuously and has almost tripled. South Korea has increased its lead in Tertiary
3.2.2. Other developed countries
The EU27 has a performance lead over Canada and this lead has more than doubled. Canada is performing better in 3 indicators, in particular in Tertiary education and Public-private co-publications (Figure 16). In R&D expenditure in the business sector, PCT patents, PCT patents in societal challenges and License and patent revenues from abroad Canada is showing the largest performance gap towards the EU27. Canada’s lead in
education, R&D expenditures in the public and business sector, PCT patents in societal challenges and Knowledge-intensive services exports. South Korea’s lead in Contribution of medium-high-tech product exports to the trade balance has remained stable and its lead in PCT patents has decreased. The EU27 has increased its lead in Most cited publications. The EU27 has a decreasing lead in New doctorate graduates, International co-publications, PCT patents in societal challenges and License and patent revenues from abroad.
Tertiary education, R&D expenditure in the public sector and Public-private co-publications has decreased. The EU27 has increased its lead in R&D expenditure in the business sector, PCT patents, PCT patents in societal challenges, Contribution of medium-high-tech product exports to the trade balance and License and patent revenues from abroad. The EU27 lead has decreased in New doctorate graduates and Knowledge-intensive services exports.
Figure 15: EU27-South Korea comparison
Figure 16: EU27-Canada comparison
The EU27 has a performance lead over Australia
and this lead has been increasing slowly. Australia is performing better in 4 indicators, in particular in New doctorate graduates and Tertiary education (Figure 17). In PCT patents, Knowledge-intensive services ex-ports and License and patent revenues from abroad Australia is showing the largest performance gap to-wards the EU27. Australia is showing a small increase in its lead in Tertiary education and R&D expenditure
3.2.3. BRICS countries
The EU27 has a clear performance lead compared to all five BRICS countries. This lead has been slightly increasing with Brazil, India, Russia and South Africa. Only China is gradually closing the gap with the EU27.
The EU27 is performing better than Russia in most indicators (Figure 18). Only in Tertiary education Russia is performing much better. Russia is lagging most in Public-private co-publications, PCT patents, PCT patents in societal challenges and License and
in the business sector. Australia’s lead has decreased in New doctorate graduates and R&D expenditure in the public sector. The EU27 has increased its lead in PCT patents, Contribution of medium-high-tech product exports to the trade balance and License and patent revenues from abroad and has reversed the gap into a lead for PCT patents in societal challenges. The EU27 performance lead has decreased in Public-private co-publications and Knowledge-intensive services exports.
patent revenues from abroad. Russia’s lead in Tertiary education has decreased. Russia has decreased its gap in R&D expenditure in the public sector, License and patent revenues from abroad and Knowledge-intensive services exports. Russia’s gap has increased for New doctorate graduates, International co-publications, Most cited publications, R&D expenditure in the business sector, Public-private co-publications, PCT patents, PCT patents in societal challenges and Contribution of medium-high-tech product exports to the trade balance.
Figure 17: EU27-Australia comparison
No data for International co-publications and Most cited publications.
The EU27 is performing better than China in most in-dicators (Figure 19). Only in New doctorate graduates and R&D expenditure in the business sector China is performing better. China is lagging most in Interna-tional co-publications, Public-private co-publications, PCT patents in societal challenges and License and patent revenues from abroad. China’s lead in R&D
ex-India is lagging in innovation performance in most indicators, in particular in International co-publica-tions, Public-private co-publicaco-publica-tions, PCT patents, PCT patents in societal challenges and License and pat-ent revenues from abroad (Figure 20). India’s perfor-mance in Knowledge-intensive services exports is well above that of the EU27 but its lead has been slightly
penditure in the business sector has increased and its lead in New doctorate graduates has remained stable. China has decreased its gap most strongly for Interna-tional co-publications, Public-private co-publications, PCT patents and PCT patents in societal challenges. China’s performance gap has only increased for Li-cense and patent revenues from abroad.
decreasing. India has decreased its performance gap in International co-publications, Most cited publica-tions and Public-private co-publicapublica-tions. India’s per-formance gap has increased for Tertiary education, R&D expenditures in the public and business sector, PCT patents, PCT patents in societal challenges and License and patent revenues from abroad.
Figure 19: EU27-China comparison
Figure 20: EU27-India comparison
South Africa’s innovation performance is lagging in all indicators, in particular in New doctorate graduates, Public-private co-publications, PCT patents, PCT patents in societal challenges and License and patent revenues from abroad (Figure 22). South Africa’s gap has increased for almost all indicators, in particular for PCT patents and License
Brazil is lagging in most indicators, in particular in Public-private co-publications, PCT patents, PCT patents in societal challenges and License and patent revenues from abroad (Figure 21). Brazil’s performance in Knowledge-intensive services exports is above that of the EU27 and has been increasing. Brazil has decreased its gap in Tertiary education, International
and patent revenues from abroad. South Africa has reduced its performance gap in PCT patents in societal challenges.
co-publications, Most cited publications, PCT patents in societal challenges, and most notably in Public-private co-publications. Brazil’s gap has increased for New doctorate graduates, PCT patents, Contribution of medium-high-tech product exports to the trade balance, R&D expenditure in the business sector and License and patent revenues from abroad.
Figure 21: EU27-Brazil comparison
Figure 22: EU27-South Africa comparison
In this section for each country a more detailed country profile is shown highlighting for each country’s relative strengths and weaknesses in innovation performance and its main drivers of innovation growth. Relative strengths and weaknesses are determined by comparing the com-posite indicator scores for each of the 8 innovation dimen-sions with the overall composite innovation index.
High growth is observed for Community trademarks. A strong decline is observed for Non-R&D innovation ex-penditure. Growth performance in Open, excellent and
Belgium is one of the innovation followers with an above average performance. Relative strengths are in Open, excellent and attractive research systems, Linkages & entrepreneurship and Innovators. Relative weaknesses are in Finance and support and Intellectual assets.
attractive research systems, Linkages & entrepreneur-ship and Intellectual assets is well above average and in Firm investments well below average.
Indicator values relative to the EU27 (EU27=100)
Bulgaria is one of the modest innovators with a below average performance. Relative strengths are in Human resources, Intellectual assets and Economics effects.
High growth is observed for Community trademarks and R&D expenditure in the business sector. A relatively strong decline is observed for Non-R&D innovation expenditures and Venture capital investments. Growth
Relative weaknesses are in Open, excellent and attrac-tive research systems, Finance and support, Firm invest-ments, Linkages & entrepreneurship and Innovators.
performance in Intellectual assets is well above average and in Finance and support and Firm investments well below average.
Indicator values relative to the EU27 (EU27=100)
Czech Republic is one of the moderate innovators with a below average performance. Relative strengths are in Human resources, Innovators and
For Population with a tertiary degree growth has been highest for all Member States and high growth is also observed for Community trademarks. A strong decline is observed for Venture capital investments and
Non-Economic effects. Relative weaknesses are in Open, excellent and attractive research systems and Intellectual assets.
R&D innovation expenditure. Growth performance in Human resources, Open, excellent and attractive research systems and Intellectual assets is above average and in Firm investments well below average. Indicator values relative to the EU27 (EU27=100)
Denmark is one of the innovation leaders with an above average performance. Relative strengths are in Open, excellent and attractive research systems,
For sales of new-to-market and new-to-firm innova-tions growth has been highest for all Member States and growth was also high for New doctorate graduates. A relatively strong decline is observed for
Communi-Linkages & entrepreneurship and Intellectual assets. Relative weaknesses are in Human resources and Firm investments.
ty designs. Growth performance in Human resources, Open, excellent and attractive research systems, Link-ages & entrepreneurship and Economic effects is well above average and in Innovators well below average. Indicator values relative to the EU27 (EU27=100)
Germany is one of the innovation leaders with an above average performance. Relative strengths are in Innovators and Intellectual assets. Relative
High growth is observed for Innovative SMEs collaborating with others, Community trademarks and License and patent revenues from abroad. A strong decline is observed for Non-R&D innovation
weaknesses are in Open, excellent and attractive research systems.
expenditure and Sales of to-market and new-to-firm innovations. Growth performance in Linkages & entrepreneurship is well above average and in Firm investments well below average.
Indicator values relative to the EU27 (EU27=100)
Estonia is one of the innovation followers with a close to average performance. Relative strengths are in Finance and support and Firm Investments.
For R&D expenditures in the business sector, PCT patents and PCT patent applications Estonia experiences the fastest growth in societal challenges and Community designs where growth rates for the first three are the highest among all Member
Relative weaknesses are in Open, excellent and attractive research systems and Economic effects.
States. A relatively strong decline is observed for Non-R&D innovation expenditures. Growth performance in Finance and support and Intellectual assets is well above average and in Firm investments and Innovators well below average. Indicator values relative to the EU27 (EU27=100)
Ireland is one of the innovation followers with an above average performance. Relative strengths are in Human resources and Economic effects. Relative
High growth is observed for License and pat-ent revenues from abroad. A strong decline is observed for Non-R&D innovation expenditures.
weaknesses are in Finance and support and Firm investments.
Growth performance in Firm investments is well below average.
Indicator values relative to the EU27 (EU27=100)
Greece is one of the moderate innovators with a below average performance. Relative strengths are in Innovators. Relative weaknesses are in Finance
High growth is observed for Community designs. A relatively strong decline is observed for Venture capital investments and Knowledge-intensive services exports. Growth
perfor-and support perfor-and Intellectual assets.
mance in Open, excellent and attractive research systems and Intellectual assets is well above average and in Finance and support and Economic effects well below average. Indicator values relative to the EU27 (EU27=100)
Spain is one of the moderate innovators with a below average performance. Relative strengths are in Open, excellent and attractive research systems (in particular international scientific co-publications)
High growth is observed for International scientific co-publications. The strongest decline is observed for Venture capital investments. Growth performance
and Economic effects (except License and patent revenues from abroad). Relative weaknesses are in Firm investments and Linkages & entrepreneurship.
in Open, excellent and attractive research systems is well above average and in Finance and support and Firm investments well below average.
Indicator values relative to the EU27 (EU27=100)
France is one of the innovation followers with an above average performance. Relative strengths are in Human resources. Relative weaknesses are in Firm investments.
High growth is observed for New doctorate graduates, Community trademarks and Sales of new to market and new to firm innovations. A relatively strong decline
is observed for Non-R&D innovation expenditures. Growth performance in Economic effects is well above average and in Firm investments well below average. Indicator values relative to the EU27 (EU27=100)
Italy is one of the moderate innovators with a below average performance. Relative strengths are in
Inno-High growth is observed for Sales of new-to-market and new-to-firm innovations and License and patent revenues from abroad. A strong decline is observed for Venture capital investments and
Non-vators and Economic effects. Relative weaknesses are in Finance and support and Firm investments.
R&D innovation expenditure. Growth performance in Open, excellent and attractive research systems and Economic effects is well above average and in Firm investments well below average.
Indicator values relative to the EU27 (EU27=100)
Cyprus is one of the innovation followers with a close to average performance. Relative strengths are
High growth is observed for International scientific co-publications and Community designs. A strong decline is observed for PCT patent applications in societal challenges and License and patent revenues
in Linkages & entrepreneurship. Relative weaknesses are in Finance and support.
from abroad. Growth performance in Open, excellent and attractive research systems and Linkages & entrepreneurship is above average and in Innovators well below average.
Indicator values relative to the EU27 (EU27=100)
Latvia is one of the modest innovators with a below average performance. Relative strengths are in Human resources and Finance and support. Relative
For Non-EU doctorate students, Community trademarks and SMEs introducing marketing or organisational in-novation growth rates for Latvia are the highest among all Member States. High growth is also observed for Community designs. A strong decline is observed for
weaknesses are in Open, excellent and attractive research systems, Firm investments and Linkages & entrepreneurship.
Non-R&D innovation expenditures. Growth perfor-mance in Open, excellent and attractive research sys-tems, Intellectual assets and Innovators is well above average and in Firm investments well below average. Indicator values relative to the EU27 (EU27=100)
Lithuania is one of the moderate innovators with a below average performance. Relative strengths are in Human resources and Finance and support.
For Community designs and Employment in knowl-edge-intensive activities growth rates are the high-est among all Member States. High growth is also observed for Non-R&D innovation expenditures, Community trademarks and License and patent
Relative weaknesses are in Open, excellent and attractive research systems and Intellectual assets.
revenues from abroad. A strong decline is observed for Sales of new-to-market and new-to-firm inno-vations. Growth performance in Firm investments and Intellectual assets is well above average and in Innovators and Economic effects well below average. Indicator values relative to the EU27 (EU27=100)
Luxembourg is one of the innovation followers with an above average performance. Relative strengths are in
Luxembourg has experienced the highest growth rates for International scientific co-publications and R&D expenditures of all Member States. Also Most cited publications have grown fast. A strong decline
Innovators and Open, excellent and attractive research systems. Relative weaknesses are in Firm investments.
is observed for Non-R&D innovation expenditure. Growth performance in Open, excellent and attractive research systems is well above average and in Firm investments well below average.
Indicator values relative to the EU27 (EU27=100)
Hungary is one of the moderate innovators with a below average performance. Relative strengths are
High growth is observed for R&D expenditures in the business sector and Community trademarks. Growth in Venture capital investments has been the highest of all Member States. A strong decline is observed
in Human resources and Economic effects. Relative weaknesses are in Innovators.
for Non-R&D innovation expenditures. Growth performance in Human resources, Intellectual assets and Economic effects is above average and in Firm investments and Innovators well below average. Indicator values relative to the EU27 (EU27=100)
Malta is one of the moderate innovators with a below average performance. Relative strengths are
Malta has experienced the fastest growth of all Member States for Most cited publications, Public-private co-publica-tions and SMEs introducing product or process innovaco-publica-tions. High growth is also observed for New doctorate graduates. A strong decline is observed for PCT patent applications,
Com-in Economic effects. Relative weaknesses are Com-in Human resources and Finance and support.
munity designs, Sales of new-to-market and new-to-firm innovations and License and patent revenues from abroad. Growth performance in Open, excellent and attractive re-search systems is well above average and in Firm invest-ments and in Economic effects well below average. Indicator values relative to the EU27 (EU27=100)
The Netherlands is one of the innovation follow-ers with an above average performance. Relative strengths are in Open, excellent and attractive
re-The Netherlands has experienced the fastest growth Non-R&D innovation expenditures and SMEs innovating in-house of all Member States. A strong decline is observed for Knowledge-intensive services
search systems and for Linkages & entrepreneurship. Relative weaknesses are in Firm investments.
exports. Growth performance in Firm investments and Innovators is well above average and in Economic effects below average.
Indicator values relative to the EU27 (EU27=100)
Austria is one of the innovation followers with an above average performance. Relative strengths are in Linkages & entrepreneurship and Intellectual
High growth is observed for International scientific co-publications and Community trademarks. A strong de-cline is observed for Non-R&D innovation expenditures and SMEs introducing marketing or organisational
in-assets. Relative weaknesses are in Finance and support, Firm investments and Economic effects.
novations. Growth performance in Open, excellent and attractive research systems, Linkages & entrepreneur-ship and Intellectual assets is well above average and in Firm investments and Innovators well below average. Indicator values relative to the EU27 (EU27=100)
Poland is one of the modest innovators with a below average performance. Relative strengths are in Human resources. Relative weaknesses are in
High growth is observed for Public-private co-publica-tions, Community designs and License and patent reve-nues from abroad. A relatively strong decline is observed for New doctorate graduates and Innovative SMEs
col-Linkages & entrepreneurship and Innovators.
laborating with others. Growth performance in Finance and support, Intellectual assets and Economic effects is well above average and in Human resources, Linkages & entrepreneurship and Innovators well below average. Indicator values relative to the EU27 (EU27=100)
Portugal is one of the moderate innovators with a below average performance. Relative strengths
High growth is observed for International scientific co-publications, R&D expenditure in the public sector and Community designs. For Youth with upper secondary level education growth was highest of all Member States. A strong decline is observed for New doctorate
are in Innovators. Relative weaknesses are in Firm investments.
graduates, Venture capital investments and Non-R&D innovation expenditures. Growth performance in Open, excellent and attractive research systems and Linkages & entrepreneurship is well above average and in Firm investments and Innovators well below average. Indicator values relative to the EU27 (EU27=100)