Walkinshaw, N. and Roper, M. and Wood, M. (2005) Understanding
object-oriented source code from the behavioural perspective. In:
Proceedings of the 13th International Workshop on Program
Comprehension (IWPC'05). IWPC, USA. ISBN 0-7695-2254-8 ,
This version is available at
https://strathprints.strath.ac.uk/2706/
Strathprints is designed to allow users to access the research output of the University of Strathclyde. Unless otherwise explicitly stated on the manuscript, Copyright © and Moral Rights for the papers on this site are retained by the individual authors and/or other copyright owners. Please check the manuscript for details of any other licences that may have been applied. You may not engage in further distribution of the material for any profitmaking activities or any commercial gain. You may freely distribute both the url (https://strathprints.strath.ac.uk/) and the content of this paper for research or private study, educational, or not-for-profit purposes without prior permission or charge.
Any correspondence concerning this service should be sent to the Strathprints administrator:
The Strathprints institutional repository (https://strathprints.strath.ac.uk) is a digital archive of University of Strathclyde research outputs. It has been developed to disseminate open access research outputs, expose data about those outputs, and enable the
Walkinshaw, N. and Roper, M. and Wood, M. (2005) Understanding
object-oriented source code from the behavioural perspective.
In: Proceedings of the 13th International Workshop on Program
Comprehension (IWPC'05). IWPC, USA. ISBN 0-7695-2254-8
http://eprints.cdlr.strath.ac.uk/2
706
/
Strathprints is designed to allow users to access the research
output of the University of Strathclyde. Copyright © and Moral
Rights for the papers on this site are retained by the individual
authors and/or other copyright owners. Users may download
and/or print one copy of any article(s) in Strathprints to facilitate
their private study or for non-commercial research. You may not
engage in further distribution of the material or use it for any
profitmaking activities or any commercial gain. You may freely
distribute the url (
http://eprints.cdlr.strath.ac.uk
) of the Strathprints
website.
Understanding Object-Oriented Source Code from the Behavioural Perspective
Neil Walkinshaw, Marc Roper, Murray Wood
Department of Computer and Information Sciences,
The University of Strathclyde, Glasgow G1 1XH, UK
E-mail:
{neil.walkinshaw, marc, murray}@cis.strath.ac.uk
Abstract
Comprehension is a key activity that underpins a variety of software maintenance and engineering tasks. The task of understanding object-oriented systems is hampered by the fact that the code segments that are related to a user-level function tend to be distributed across the system. We in-troduce a tool-supported code extraction technique that ad-dresses this issue. Given a minimal amount of information about a behavioural element of the system that is of interest (such as a use-case), it extracts a trail of the methods (and method invocations) through the system that are needed in order to achieve an understanding of the implementation of the element of interest. We demonstrate the feasibility of our approach by implementing it as part of a code extraction tool, presenting a case study and evaluating the approach and tool against a set of established criteria for program comprehension tools.
Keywords: slicing, hammock graphs, behavioural com-prehension
1. Introduction
Many software engineering activities such as mainte-nance, testing and inspection rely heavily on the use of ef-fective comprehension techniques. As an example, if a pro-grammer has to perform a maintenance task on a software system (which they may not have written themselves), they need to understand it to determine which element(s) of the system are relevant. If the task results in a change, they also need to understand how it will affect the rest of the system. In object-oriented systems, the object is the primary and sole unit of decomposition. Objects model important enti-ties within a system and consist of data tightly bound with the methods that manipulate them. The system executes by passing messages (invoking methods) between objects. A consequence of this decomposition strategy is that function and structure are no longer coincidental: functionally re-lated code is distributed over many different objects.
Polymorphic Binding
Different Class Instances Shared
Object References State
Methods
Inheritance
Class
Class Library Reference
Return values
Method Calls
Return values
[image:3.612.309.544.229.377.2]Inheritance
Figure 1. Challenges of Understanding the Behaviour of an Object-Oriented System
Understanding the behaviour of object-oriented code from a static presentation of the source code is very chal-lenging and time consuming. Paradigm features such as in-heritance, small methods, polymorphism and dynamic dis-patch mean that the type of an object (the class containing the method of interest) can often not be determined stat-ically. Tracing along every path in a non-trivial object-oriented system becomes practically infeasible because ev-ery permutation of run-time object types produces a differ-ent combination of paths that need to be taken into account. The problem is summarised succinctly by Gamma et al. [10]: “In fact, the two structures [run-time and compile-time] are largely independent. Trying to understand one from the other is like trying to understand the dynamism of living ecosystems from the static taxonomy of plants and animals”. Figure 1 illustrates some of these problems.
problem tends to be amplified. Inaccurate specification doc-uments place an enormous overhead on manually reading the source code because it is left to the reader to intuitively determine what source code is related to the program points they have been able to directly link with the specification.
Manually comprehending object-oriented systems from the dynamic perspective has been investigated by Robillard et al. [17], who investigate comprehension with respect to a software change task, Dunsmoreet al. [4] and Thelinet al. [20], who both investigate reading techniques to sup-port comprehension for software inspections. Robillardet al. conclude that a systematic approach is required to com-pensate for the fact that code artefacts related to a single change task are spread across the system. In their previous work [18] they provide a good example of the distribution of functionally related code, stating that trying to modify the conditions under which logging occurs in Jakarta Tomcat would entail the consideration of 32% of the system’s Java source files. Dunsmoreet al. stress the need to reduce the manual overhead involved in tracing relevant source code elements across classes via some form of tool support. This is the rationale for the work presented in this paper, which aims to significantly reduce the expense inherent in reading through functionally related code by removing the need to manually determine what is relevant.
We present an approach that uses program slicing to de-termine method calls that are relevant to a (potentially lim-ited) set of ‘landmark methods’ that must be executed for a given use-case scenario that could be traced from the spec-ification. A use-case is a description of a set of sequences of actions, including variants, that a system performs that yields an observable result of value to an actor [3]. A sce-nario is a particular instantiation of a use-case. Our solution provides a manageable amount of code to read and under-stand for a given use-case. We restrict the call graph to pro-vide only those methods and invocations that are related to the use-case (or use-case scenario) under consideration. We trim the source code base to make it more manageable for the code reader as follows:
1. Elicit points, called landmark methods, from the speci-fication that we know will be executed for a given use-case and map them to the source code.
2. Induce hammock graphs on the call graph between these points (hammock graphs are defined in section 2.2).
3. Use the calls in the hammock graphs as slicing crite-ria in order to mark further calls whose executions in-fluence the computation of methods belonging to the hammock graphs.
4. Expand paths from calls marked by step 3.
The next section provides an overview of code slicing and provides definitions. Section three presents our approach. Section four contains an evaluation and details of our im-plementation. Section five surveys related work and section six provides conclusions and directions for future work.
2. Background
2.1. Slicing
Slicing is a technique used to highlight statements that are relevant to a particular computation. Since it was in-troduced by Weiser in his thesis in 1979 [24], it has grown into an active field of academic research. In abstract terms, a slice presents a fragment of the program, consisting of statements that are semantically related to some slicing cri-terion specified by the user.
There exists a plethora of slicing approaches to suit dif-ferent software maintenance tasks. The approach we pro-pose uses static intra-procedural backward [25] and forward [12] slices. For a comprehensive introduction on how to compute these slices, the reader is referred to either Tip’s [21] or Binkley and Gallagher’s [1] slicing overview.
A static backward slice answers the question: “What statements can affect the behaviour of a variable v at a point p?”. The standard criterion format for a slice is denoted <p,v>, wherepdenotes the point of interest in the program andvdenotes the variable. Usually it is assumed thatvis either defined or used atp.
A staticforwardslice answers the question:“What state-ments contain variables that can be affected by a variable v at a point p?”.
There are two popular approaches to computing a slice. Weiser’s original approach is an iterative algorithm that computes the slice as the solution to a set of data-flow equa-tions [25]. The other approach is based on representing the program as a graph where vertices represent expressions and edges represent different types of inter-dependences [8]. Our approach uses dependence graphs to represent in-dividual methods (the graphs are referred to as Method De-pendence Graphs or MDGs).
between the actual-in and actual-out vertices of a call. Reps et al. [16] provide an efficient approach for their computa-tion.
2.2. Definitions
Adigraph(ordirected graph)Dis a structure
< N, E >, whereNis a set of nodes andEis a set of edges. Apathfromntomof lengthkis a list of nodesp0, p1, ..., pk such thatp0 = n,pk = m and for all i1 ≤ i ≤ k−1,
(pi, pi+1)is inE. A nodenxprecedesa nodeny(andny succeedsnx) if there exists a path fromnx tony. If they are adjacent thennxdirectly precedesny. The set of nodes precedingnyon a graphD is denoted asP re(ny, D)and the set of nodes succeedingnxis denoted asSucc(nx, D).
Aflow graphFis a structure< N, E, n0>, where
< N, E >is a digraph andn0is a member ofN such that there is a path fromn0to all other nodes inN. We will refer ton0as the initial node. Ifmandnare two nodes inN,m dominatesnifmis on every path fromntone.
An object-oriented call graphCis a flow graph that rep-resents the call relationships between methods. The node setN represents the set of methods (every method is rep-resented by a single node),Erepresents the set of calls be-tween methods andn0 is the entry point to the system. A call edgeetakes the forme =c → m, wherecis the call site (statement where the call originates) andmis the target method.
The original definition of a hammock graph is provided by Kas’janov [13]. In the context of static program analy-sis it is commonly defined with respect to the control flow graph of a method (e.g. Weiser [25] and Ferranteet al.[8]). In our work, Kas’janov’s notion of a hammock graph re-mains the same, but instead of referring to hammock graphs in the context of CFGs, we refer to them in the context of call graphs. Our definition for hammock graphs is the same as Weiser’s.
Ahammock graphH is a structure< N, E, n0, ne > such that< N, E, n0>and< N, E−1, ne>are both flow graphs, whereE−1={(a, b)|(b, a)∈E}.
We will refer to the information we garner from the specification in terms of a set of landmark methodsM =
{m0, ..., mn}. Methods can only belong toM if they can be traced from the specification to the source code.
3. Using Dependence and Specification
Infor-mation to Produce a Reduced Call Graph
Because of the large edge-to-vertex ratio in object-oriented call graphs, it is difficult to determine the context in which a method might be called during the execution of a given scenario. Here we suggest an approach that uses any available information about the execution of the scenario
1. Trace landmark methods from specification to call graph
2. Identify direct paths between traced methods:
(a) Mark methods traced from the specification on the call graph
(b) Induce hammock graphs on the call graph be-tween every pair of traced methods
3. Identify paths that can influence and be influenced by the paths in the hammock graphs:
(a) Identify call statements for every edge in the hammock graphs
(b) Generate intra-procedural slices, using call state-ments as slicing criteria
(c) Mark all calls belonging to the slices
(d) Follow all paths in the call graph originating from the marked call sites
Figure 2. Process of extracting code relevant to a particular aspect of system functionality
to limit the number of contexts in which a set of meth-ods may be called. This divides the call graph into self-contained segments that can be read individually, following a ‘divide and conquer’ policy. The process of extracting relevant code is outlined in figure 2.
We identify relevant paths through the system by mak-ing use of information from the specification. Our approach caters for the realistic situation that the specification may be incomplete, but that any scenario contains a set of land-mark method invocationsMthat can be traced to the source code. We create a chain of hammock graphs between the methods inM, isolating calls on direct paths between the methods. We then use their call sites (see section 2.2) as slicing criteria to detect calls that do not belong to paths in the hammock graphs but can still influence or be influenced by their execution.
3.1. Obtaining Hammock Graphs
A hammock graph H induced on a call graph C be-tween methods l and m is denoted H(C, l, m) where
H(C, l, m)=< N, E, l, m >andH(E) ⊆ C(E), where
a
b c
g
f d
e
h k
i j
r m
q l
n
p o
s
a
b c
g f
h i j
m
q l
n
p
a
b c
f
i
h
m
q
a
b c
f
i
h
m
q
s r
[image:6.612.132.466.69.316.2](a) (b) (c) (d)
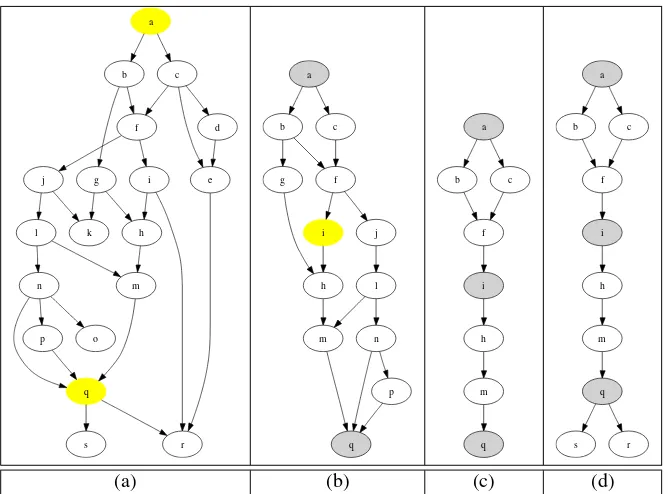
Figure 3. Trimming the call graph by inducing hammock graphs between landmark methods
intersection ofSucc(l, C)andP re(m, C)(see section 2.2) and the edges that connect them inC.
We use the set of landmark methodsM garnered from the specification to eliminate as many superfluous call graph edges as we can. Methods elicited from the scenario spec-ification act as landmarks in the call graph; every path to be understood must pass through them. A hammock graph
H(C, l, m)contains all call edges that may belong to a path from l to m. To restrict paths through the call graph to those that execute landmark methods, we produce a ham-mock graph for every pair of methods inM∪m0wherem0 is the entry method to the system.
An example of how to induce a hammock graph on a call graph is provided in figure 3. Here the nodesC={a, ..., s} represent the vertices of the entire call graph,a=m0and {q, i} ∈ M. Figure (a) shows the entire call graph, with nodesaandqhighlighted. Figure (b) shows the call graph obtained by inducing the hammock graphH(C, a, q). Fig-ure (c) shows the hammock graphs that are obtained when we divide the graph from (b) by using node ias an addi-tional landmark method. Becauseisucceedsaand precedes
qon the call graph, we can split the graphH(C, a, q)into
H(C, a, i)andH(C, i, q).
Assuming we do not know what happens after the execu-tion of methodq, we have to add all ofq’s successors to the list of calls to be inspected. The final result is represented in (d). This is what is used as the basis for computing the path dependencies, as described in the following section.
3.2. Computing Dependencies of Hammock Graph
Paths
The edges contained in the hammock graphs currently identify the calls on the call graph that directly link methods belonging to M ∪m0. Following paths that onlydirectly link landmark methods is not sufficient. Simply because there is not a direct path between two methods in the call graph does not mean that they cannot be executed as part of the same execution.
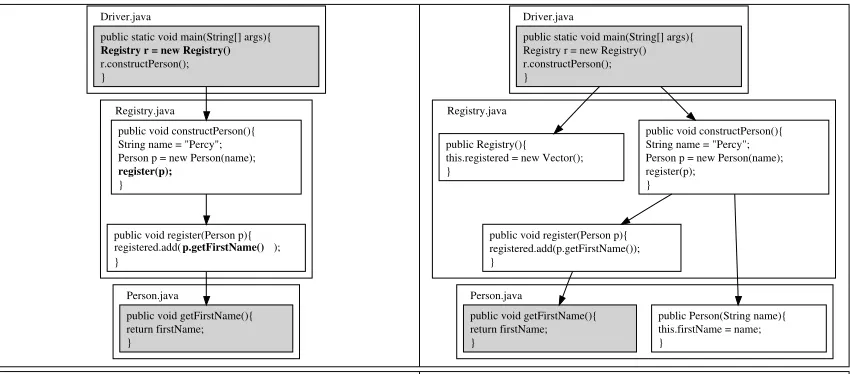
An example is provided in figure 4. The hammock graph between the methodsmainandgetFirstNameis shown in (a) (note that these methods belong to different classes). The information provided by the hammock graph alone is in-sufficient. To be thorough we would want to know how
firstNameis initialised in object pand how the Registry ob-ject is initialised. This would require the scrutiny of the
Person andRegistry constructors, which are not part of the hammock graph in (a).
p.getFirstName() Driver.java
Registry.java
Person.java
public static void main(String[] args){ Registry r = new Registry() r.constructPerson(); }
public void constructPerson(){ String name = "Percy"; Person p = new Person(name); register(p);
}
}
public void getFirstName(){ return firstName; }
public void register(Person p){ registered.add( );
Driver.java
Registry.java
Person.java
public static void main(String[] args){ Registry r = new Registry() r.constructPerson(); }
public void constructPerson(){ String name = "Percy"; Person p = new Person(name); register(p);
} public Registry(){
this.registered = new Vector(); }
public Person(String name){ this.firstName = name; }
public void register(Person p){ registered.add(p.getFirstName()); }
public void getFirstName(){ return firstName; }
[image:7.612.87.512.70.257.2](a) hammock graph betweenmainandgetFirstName (b) hammock graph from (a) with dependences
Figure 4. Adding dependences to hammock graphs
final body of code to provide a self-contained unit.
A callsite can be derived from a call graph edge because a call takes the formcallsite→method(see section 2.2). For every callsite belonging to an edge in a hammock graph, we produce intra-procedural backward and forward slices. Any call sites that belong to the slices and are not the source of an edge in a hammock graph are marked. Marked calls are significant because we know that (a) they may be ex-ecuted at run-time and (b) if they are exex-ecuted, they can influence or be influenced by the execution of methods be-longing to the hammock graph. If a marked call site is not succeeded by any landmark methods, we cannot restrict the path that would occur if it were executed. To provide a con-servative estimate of the code that is relevant, all call graph edges that can be transitively reached by that callsite must be taken into account.
In figure 4, the call sitesr.constructPerson(),register(p)and
p.getFirstName()(the call sites that spawn edges on the ham-mock graph) are used as slicing criterion points. Vari-ables representing parameters and destination objects (e.g. actual-in vertices belonging to these call sites in the MDG) are used as criterion variables (r andp). Intra-procedural slices on these criteria contain the callsRegistry r = new Reg-istry() in main, Person p = new Person() inconstructPerson and
registed.add(...) in register. If there is a call to a library method we do not add it to the paths to be inspected, be-cause we currently treat library calls as being beyond our scope of interest. registered.add(...) is a library method (the
Vector.add(Object)method in Java). ThePerson andRegistry
initialisers are however application methods so they need to be taken into account. If they were to call any further appli-cation methods (they do not in this example), these method calls would have to be traced through the call graph.
3.3. Restricting Path Dependencies
By taking both forward and backward slices from the hammock graph call sites into account, we are answering the following question: “What are the paths on the call graph that can either affect or be affected by a set of meth-ods M?”. Depending on the system being analysed and the set of landmark methods, the code base that is extracted us-ing this approach may still be too large to be of practical use.
Figure 5. Call graph navigator with window to show call stack
4. Evaluation
To assess the feasibility of our approach, it has been im-plemented as a code extraction tool for Java systems. The tool is currently being evaluated on a range of systems, to understand the effect that different landmark methods have on the results produced. To evaluate its usefulness with re-spect to comprehension we refer to Storey et al.’s set of guidelines [19] that tools for program understanding should aim to satisfy.
4.1. Implementation and Example
Upon loading Java classes the tool produces a call graph. This can be refined by selecting methods that belong to the specification and applying the approach outlined in the pre-vious section. We use the Soot byte code analysis frame-work1as a basis for extracting dependence information and the call graph. Soot operates on byte code, so slices have to be mapped back to the source code. Graphs are traversed and visualised using the Java Universal Network/Graph (JUNG) framework2.
As the call graph is trimmed, it can be navigated as shown in figure 5. Outgoing calls are listed in the pane on the left. When selected, the text-pane reloads with the source code belonging to the selected method. Intra-procedural slices can be highlighted.
As a basis for our example, we have chosen a use-case from JHotDraw3, a framework for drawing editors. It
con-tains about 120 classes and uses a variety of object-oriented paradigm features such as polymorphism and inheritance.
1http://www.sable.mcgill.ca/soot/ 2http://jung.sourceforge.net/ 3http://www.jhotdraw.org
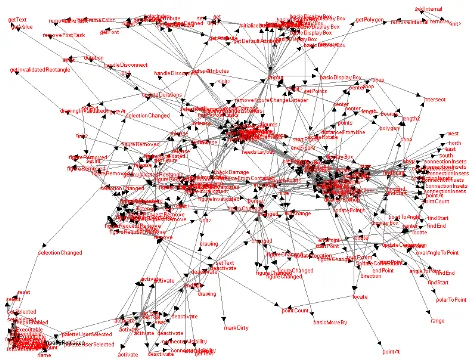
Figure 6. Call graph from
PaletteBut-ton.mouseReleasedmethod in JHotDraw
It has evolved into a mature system (its initial Smalltalk im-plementation was produced in the Eighties) and its design has been developed by using typical framework construc-tion techniques such as design patterns.
The use-case, accompanied by a set of sequence di-agrams, was produced by an individual who has expert knowledge of the system. It covers the selection of a draw-ing tool and commences when the user releases the mouse over a tool button. We use themouseReleasedmethod (im-plementing themouseListenerinterface) as the entry point for the call graph. The unrefined call graph contains 251 ver-tices (methods) connected by 719 edges (potential method invocations) and is shown in figure 6.
The problem of distributed functionality that has to be dealt with becomes apparent when we consider that every method in the call graph is executed as part of at least one use-case. Although it is possible to read the 251 methods individually, reading each method in every possible context of execution becomes infeasible. For this reason we need to apply our technique of reducing the call graph.
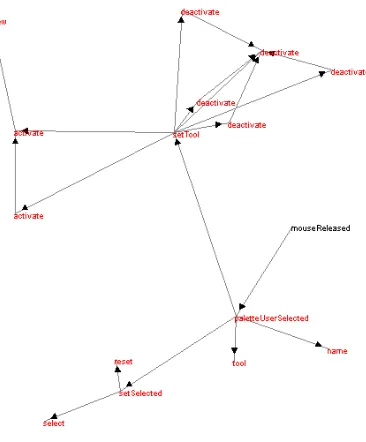
The approach was evaluated in the context of a software inspection task, so the tool was modified to use only back-ward slices at call sites. The reduced graph that corresponds to the supplied use-case is shown in figure 7 and was ob-tained by using four landmark methods. The graph is re-duced to 16 vertices, connected by 20 edges, returning two edges that are superfluous because of a polymorphic call that is not restricted by landmark methods.
Figure 7. Reduced Call Graph
the user to specify a set of relevant edgesRand the number of landmark methods to be consideredl. The tool then pro-ceeds to generate every combination ofl landmark meth-ods in R. For every combination it produces the reduced call graph and calculates its precision and recall. Precision measures the proportion of retrieved edges that are actually relevant and is calculated by dividing the number of rele-vant edges retrieved by the total number of edges retrieved. Recall measures the proportion of relevant edges that are actually retrieved and is calculated by dividing the number of relevant edges retrieved by the total number of relevant edges.
It should be emphasised our evaluation of this work is still on-going. We have shown that the approach performs very well, given a good combination of landmark methods (the combination that produced the graph in figure 7 scored 90% precision and 100% recall. Several of the four-method combinations however also produced very poor precision-recall results (the worst case produced 1% precision and 33% recall). A sample of the output produced by the tool is provided in figure 8. The results are displayed in the form of a bubble graph, where the size of the bubble rep-resents the number of landmark method combinations that produced that precision-recall result.
The initial precision-recall results vary significantly from one use-case to the other. By comparing the properties of the landmark methods that produced poor results to those that were useful, we have so far managed to highlight two key features of successful method combinations: (1) wher-ever possible they should specify the destination of a
poly-Figure 8. Precision-recall results for the sam-ple use-case, using 4 landmark methods
morphic call (otherwise the call graph follows all destina-tions) and (2) if a scenario contains multiple branches that execute independently of each other (i.e. the call to one branch would not belong to the slice from the call to another branch), each branch must contain a landmark method. Fu-ture work will explore further the criteria that make for suc-cessful landmark methods.
4.2. Tool Evaluation
Storeyet al.[19]4propose a list of fourteen cognitive de-sign elements that should be supported by a software com-prehension tool if it is to be effective. Out of these, it was found that our approach can assist on the following nine points:
Improve program comprehension
Enhance bottom-up comprehension
• Indicate syntactic and semantic relations between
soft-ware objects: Edges contained in the reduced call graph produced by our approach link the methods that are relevant to a given execution.
• Reduce the effect of delocalized plans:This is the key
aim of our approach. Our reduced call graph pulls to-gether elements of code from across the system that may affect or be affected by a particular method.
Enhance top-down comprehension
• Support goal-directed, hypothesis-driven
comprehen-sion:Using our approach, the hypothesis is expressed in terms of the landmark methods that should be exe-cuted if a scenario executes.
4Their work carries a strong bias towards software visualisation, but the
[image:9.612.305.561.73.199.2]Reduce maintainer’s cognitive overhead
Facilitate navigation
• Provide directional navigation: As shown in figure 5,
navigating the call graph before or after it has been reduced is simply a matter of selecting methods from the list and using the ‘forward’ and ‘back’ buttons.
Provide orientation clues
• Indicate the maintainer’s current focus: The current
focus is the source code for the method in the pane.
• Display the path that led to the current focus: This
is represented by the call stack, shown in the lower window in figure 5.
• Indicate options for further exploration: The list of
methods to the left of the pane indicate methods called by the current method and can be selected for further exploration.
Reduce disorientation
• Reduce additional effort for user-interface adjustment:
The interface provided by our tool is minimal and very intuitive, only requiring that the maintainer choose the destination method from a list and navigate forwards or backwards.
• Provide effective presentation styles:This refers to the
need for effective visual feedback from the tool. Our tool presents the call graph and updates it every time an additional landmark method is added (see figures 6 and 7), this is particularly effective because it immedi-ately presents the user with a visualisation of the im-pact that different landmark methods have on the final call graph.
Our approach is particularly successful with respect to the design elements aimed at reducing the maintainer’s cogni-tive overhead, where it satisfies six out of the seven points listed. The one unsatisfied point states that a tool should also provide arbitrary navigation, which was not imple-mented in our approach.
With respect to improving program comprehension our approach satisfies three of the seven elements listed. Storey et al.list that a tool should also: provide abstraction mech-anisms, provide an adequate overview of the system archi-tecture at various levels of abstraction, support the construc-tion of multiple mental models and cross-reference mental models. Their model is however intended for software ex-ploration tools that support program comprehension. Ours is not a software exploration tool, but a code extraction tool, so dealing with different levels of abstraction and different mental models is outside of its scope.
4.3. Code Reading
To explore the nature of the code returned by our ap-proach and the practical issues that arise when trying to read and understand it, we analysed the information produced by the tool for a smaller system [23]. Calls in the reduced call graphs were highlighted in the source code. Classes were printed out individually, and a reverse engineered class di-agram was provided to help identify class data members. Methods not belonging to the reduced call graph were re-moved. Method calls representing edges on the reduced call graph were highlighted, and marked with an identifier of their target method5. The following issues were
high-lighted:
1. Understanding code without further tool support is problematic because it is difficult to maintain the call-ing context in which a method is becall-ing read. It is diffi-cult to remember the caller of a method, so when men-tally executing a chain of calls, it is difficult to ‘de-scend’ back down the call chain.
2. Although the reduced code set appears to be useful, a clear reading strategy is needed to mark out the impor-tant paths through the code.
3. It would be useful to be aware when a method call crosses a class boundary.
4. An approach is needed to handle multiple instances of different objects (possible of the same type) from a static perspective.
Issue 1 can be partially addressed when using a tool. As mentioned previously, the tool displays the call stack that has led to a given method and provides a ‘backwards’ but-ton to skip back to the previous method (see figure 5). The solution is only partial, because a mental abstraction of the functionality produced by the chain of calls is needed. Is-sue 2 clearly needs to be addressed and is an important area of future work. Issue 3 is another feature that could be pro-vided by tool support. Issue 4 needs to be taken into account by any static object-oriented comprehension approach. Dif-ferent objects of the same type may have difDif-ferent states. This is a clear challenge when trying to understand the code from the dynamic perspective and must be taken into ac-count when addressing issue 2.
5. Related Work
Given a complete system, the challenge is to identify the code belonging to a set of use-cases. The key problem
5A postscript file can be downloaded from:
with reverse engineering use-cases (or particular scenarios) is that computing them statically is generally accepted to be an unsolvable problem. Static approaches tend to be nec-essarily conservative and include a large number of super-fluous method invocations. Various static approaches exist that attempt to minimise the amount of irrelevant informa-tion (see secinforma-tion 5.2).
Although dynamic approaches are based on an exact trace of the methods that are invoked at run-time, they are unsuitable if we need to understand software without exe-cuting it (as is the case with inspections). Another challenge with respect to dynamic approaches is that they rely on the determination of a suitable set of test cases that are exhaus-tive and representaexhaus-tive with respect to the use-cases. They also rely on the availability of a system that is executable in the first place. In object-oriented systems it is particularly common that incomplete systems (such as frameworks) are created, which can then be used in different contexts. Our approach presents a compromise, where dynamic informa-tion pertaining to a given set of execuinforma-tions can be used for the analysis in the form of a set of landmark methods.
5.1. Dynamic Approaches
Bojic and Velasevic [2] propose an approach for using run-time information to reverse-engineer use-cases. Their approach is based on relating run-time information obtained from a set of test cases corresponding to a use-case to a concept lattice constructed using formal concept analysis.
El-Ramlyet al. [7] propose another dynamic approach that records user interaction with the system. Based on these interactions, data mining and pattern matching tech-niques are applied. Any frequently occurring interactions are used as a basis for use-case models.
Egyed [5] proposes an approach that uses run-time in-formation to produce traces between scenarios, model el-ements and the system. The user supplies a series of rep-resentative test cases and an executable version of the sys-tem. The system is executed and a ‘footprint graph’ is con-structed. This is used as a basis for automatically generating further traces.
Eisenbarthet al.[6] combine dynamic analysis with for-mal concept analysis to map program features to procedural source code. They produce an execution profile of scenarios that are of interest and use formal concept analysis to pro-duce a mapping between the features that are invoked by the scenarios and the source code. Their work emphasises the source code units that map to a feature, whereas our work concentrates on the call relationships between units that im-plement a feature (Eisenbarthet al.’s definition of a feature is invoked by a set of scenarios).
5.2. Static Approaches
Di Luccaet al. [14] propose an approach that is based on the premise that a scenario starts with a system-level in-put and ends with a system-level outin-put. They represent the message sequences in the form of a Method-Message Graph (MMG). ‘Threads’ of message invocations are ex-tracted from the graph and collated to form use-cases.
Tonella and Potrich [22] provide a reverse-engineering approach for interaction diagrams from C++ code. Ac-knowledging that a purely static approach is over conser-vative, they use two mechanisms called partial analysis and focussing to ensure that the average size of a graph is small enough to be of use. They validate their approach by apply-ing it to a substantial real-world project.
Qinet al.[15] propose an approach based on construct-ing a call graph-based abstract representation of the subject program called the Branch-Reserving Call Graph (BRCG). This represents calls between methods and retains control dependence information, so that predicate statements that control the execution of a given procedure call are inte-grated. Because no prior use-case information is used and the approach is static, it returns all possible execution sce-narios of the system. This can be alleviated by pruning nodes using a graph-based ‘importance metric’.
6. Conclusions and Future Work
We show how to restrict the call graph to contain only methods and calls that may be relevant to the execution of a particular use-case or scenario. A strength of this work is that it allows for the context to be restricted without rely-ing on a fine-grained specification or a dynamic execution trace. This makes it extremely flexible and applicable to the realistic situation of understanding how a system executes given only a high level specification.
The results of our analysis depend on the methods cho-sen as landmarks, the scenarios in which they are analysed and the system being inspected. These are three variables that need to be investigated in order to determine the rela-tionship between the information garnered from the speci-fication and the resulting code base. This should give us a good idea of how much specification is required to produce a useful code base with respect to a given use-case and how the technique scales to larger systems.
there is still a void in corresponding object-oriented tech-niques.
With respect to the output generated by our program, a ‘degree-of-interest’ (DOI) [9] function would guide the code reader to calls that are particularly important by as-signing a ‘weight’ to different edges in the graph. On a call-graph level, it would be useful to now enable the exclu-sion of methods (and relevant edges) because we know that theywon’tbe executed. On a method statement level, we need to investigate techniques such as Harmanet al.’s Key Statement Analysis algorithm [11], to emphasise statements that contribute to the computation of principal variables be-longing to a method.
The reduced call-graph produced by our approach pro-vides benefits beyond software comprehension. It also has the potential to significantly economise further static anal-ysis. Static inter-procedural slices of object-oriented pro-grams tend to be very large because the context in which methods are called is not restricted. Our approach would be a suitable pre-processing step to produce a cut-down depen-dence graph (reducing the significant overhead involved in constructing dependence graphs) and should produce more precise results with respect to the given scenario.
References
[1] D. Binkley and K. Gallagher. Advances in Computers, vol-ume 43, chapter Program Slicing. Academic Press, San Diego, CA, 1996.
[2] D. Bojic and D. Velasevic. Reverse engineering of use case realisations in UML. InProceedings of the ACM Symposium on Applied Computing (SAC’00), pages 741–747, 2000. [3] G. Booch, J. Rumbaugh, and I. Jacobson.The Unified
Mod-eling Language User Guide. Addison Wesley, 1999. [4] A. Dunsmore, M. Roper, and M. Wood. The
develop-ment and evaluation of three diverse techniques for object-oriented code inspections. IEEE Transactions on Software Engineering, 29(8):677–686, August 2003.
[5] A. Egyed. A scenario-driven approach to traceability.
IEEE Transactions on Software Engineering, 29(2):123– 132, 2003.
[6] T. Eisenbarth, R. Koschke, and D. Simon. Locating features in source code.IEEE Transactions on Software Engineering, 29(3):210–224, 2003.
[7] M. El-Ramly, E. Stroulia, and P. Sorenson. Mining system-user interaction traces for use case models. InProceedings of the 10th International Workshop on Program Comprehen-sion (IWPC’02), pages 21–29, 2002.
[8] J. Ferrante, K. Ottenstein, and J. Warren. The program de-pendence graph and its use in optimization. ACM Transac-tions on Programming Languages and Systems, 9(3):319– 349, July 1987.
[9] G. Furnas. Generalized fisheye views. In Proceedings of Human Factors in Computing Systems (CHI’86), pages 16– 23, 1986.
[10] E. Gamma, R. Helm, R. Johnson, and J. Vlissides. Design Patterns: Elements of Reusable Object-Oriented Software. Addison-Wesley, 1999.
[11] M. Harman, N. Gold, R. Hierons, and D. Binkley. Code extraction algorithms which unify slicing and concept as-signment. In9th IEEE Conference on Reverse Engineering (WCRE ’02), Richmond, Virginia, USA, 2002.
[12] S. Horwitz, T. Reps, and D. Binkley. Interprocedural slicing using dependence graphs. ACM Transactions on Program-ming Languages and Systems, 12(1):26–60, January 1990. [13] V. Kas’janov. Distinguishing hammocks in a directed graph.
Soviet Math. Doklady, 16(5):448–450, 1975.
[14] G. A. D. Lucca, A. R. Fasolino, and U. D. Carlini. Recov-ering use case models from object-oriented code: A thread based approach. InProceedings of the 7th Working Confer-ence on Reverse Engineering (WCRE’00), pages 108–117, 2000.
[15] T. Qin, L. Zhang, Z. Zhou, D. Hao, and J. Sun. Discovering use cases from source code using the branch-reserving call graph. InProceedings of the Tenth Asia-Pacific Software Engineering Conference (APSEC’03), pages 60–67, 2003. [16] T. Reps, H. Horwitz, M. Sagiv, and G. Rosay. Speeding up
slicing. InProceedings of the third ACM SIGSOFT Sym-posium on the Foundations of Software Engineering, pages 11–20, 1994.
[17] M. Robillard, W. Coelho, and G. Murphy. How effective developers investigate source code: An exploratory study.
IEEE Transactions on Software Engineering, 30(12):889– 903, December 2004.
[18] M. Robillard and G. Murphy. Concern graphs: Finding and describing concerns using structural program dependencies. InProceedings of the 24th International Conference on Soft-ware Engineering, pages 406–416, May 2002.
[19] M.-A. Storey, F. Fracchia, and H. Mueller. Cognitive de-sign elements to support the construction of a mental model during software exploration. Journal of Software Systems, special issue on Program Comprehension, 44, 1999. [20] T. Thelin, P. Runeson, and C. Wohlin. An experimental
com-parison of usage-based and checklist-based reading. IEEE Transactions on Software Engineering, 29(8):687–703, Au-gust 2003.
[21] F. Tip. A survey of program slicing techniques. Journal of Programming Languages, 3(3):121–189, 1995.
[22] P. Tonella and A. Potrich. Reverse engineering of the inter-action diagrams from C++ code. InProceedings of the Inter-national Conference on Software Maintainence (ICSM’03), pages 159–168, 2003.
[23] N. Walkinshaw. Statically partitioning object oriented code for use-case driven code inspections. Technical Report EFoCS-55-2004, The University of Strathclyde, December 2004.
[24] M. Weiser. Formal, Psychological, and Practical Investi-gation of an Automatic Program Abstraction Method. PhD thesis, University of Michigan, Ann Arbor, MI, 1979. [25] M. Weiser. Program slicing.IEEE Transactions on Software