Sexton, B.F. and Baughan, C.J. and Elliott, M.A. and Maycock, G. (2004) The accident risk of
motorcyclists. [Report]
http://
strathprints
.strath.ac.uk/
20274
/
Strathprints is designed to allow users to access the research output of the University
of Strathclyde. Copyright © and Moral Rights for the papers on this site are retained
by the individual authors and/or other copyright owners. You may not engage in
further distribution of the material for any profitmaking activities or any commercial
gain. You may freely distribute both the url (
http://
strathprints
.strath.ac.uk
) and the
content of this paper for research or study, educational, or not-for-profit purposes
without prior permission or charge. You may freely distribute the url
(
http://
strathprints
.strath.ac.uk
) of the Strathprints website.
The accident risk of motorcyclists
Prepared for Road Safety Division, Department for Transport
B Sexton, C Baughan, M Elliott and G Maycock
This report has been produced by TRL Limited, under/as part of a contract placed by the Department for Transport. Any views expressed in it are not necessarily those of the Department.
CONTENTS
Page
Executive Summary 1
1 Introduction 3
2 Trends in motorcycling 3
2.1 Trends in motorcycle accidents 3
2.2 Trends in motorcycle numbers and sizes 4
2.3 Motorcycle mileage 4
2.4 Rider age 6
2.5 Implications of trends in motorcycling 7
3 The design of the motorcycle survey 7
3.1 Introduction 7
3.2 The questionnaire 7
3.2.1 Section A: The rider’s riding experience 8
3.2.2 Section B: Accidents 8
3.2.3 Section C: Rider behaviour, motivation and attitudes 8 3.2.4 Section D: Personal data, car driving experience 9
4 The motorcycle survey data 9
4.1 Characteristics of the respondents 9
4.1.1 Age 9
4.1.2 Miles ridden 9
4.1.3 Experience 9
4.1.4 Breaks from riding 10
4.1.5 Size of bike 10
4.1.6 Bike use 10
4.1.7 Bike use in previous year 10
4.1.8 Training 11
4.1.9 Other 11
4.2 Accidents 11
4.2.1 Numbers of accidents 11
4.2.2 Accident characteristics 11
4.3 Univariate accident relationships 12
4.3.1 Exposure to risk 12
4.3.2 Rider age and experience 13 4.3.3 Engine size and type of bike 14
4.3.4 Training 15
Page
5 Modelling the survey data 16
5.1 Age, experience, mileage, training, bike size
and ‘rider dedication’ as risk factors 16
5.1.1 Mileage 17
5.1.2 Age and experience 18
5.1.3 Training 18
5.1.4 Rider dedication 18
5.1.5 Bike size 19
5.1.6 Injury accidents 19
6 Motorcyclist attitudes, behaviours and accidents 19
6.1 Introduction 19
6.2 The behavioural variables 19
6.3 Attitudes, motivations and perceptions 20 6.4 Statistical modelling – a hybrid approach 21
6.4.1 The methodology 21
6.4.2 The model structure 22
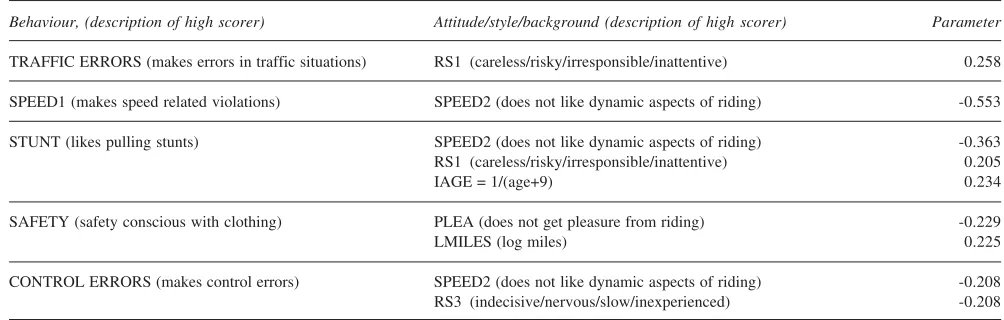
6.4.3 Results of the modelling 23
7 Motorcycling risk factors 24
7.1 Rider age and experience 24
7.2 Rider type, attitude and behaviour 26
7.3 Taking a break from motorcycling: is there
a ‘returned rider’ effect? 26
7.4 Bike ‘size’ as a risk factor 28
7.5 All-year riding 29
8 Summary and conclusions 30
8.1 Summary 30
8.1.1 Accident trends 30
8.1.2 The survey 30
8.1.3 Accidents reported 30
8.1.4 Multivariate analysis of the accident data 30
8.2 Conclusions and recommendations 31
9 Acknowledgements 32
10 References 32
Notes 33
Appendix A: The questionnaire 35
Appendix B: Producing the psychological scales 47
Appendix C: Structural equation modelling: correlations 54
Appendix D: Relationship between age and experience 55
Abstract 57
Executive Summary
that for a novice ‘all season, all weather’ rider with a single year’s experience, accident liability fell from 0.65 at age 17 to 0.19 at age 60.
A ‘rider dedication’ hierarchy showed that after
mileage, age and experience differences had been allowed for, ‘all season, and all weather riders’ (Category 1) had the highest accident liabilities. ‘Summer all weather’ riders (Category 3) had liabilities which were 41% lower than Category 1 riders and ‘Summer occasional’ riders (Category 4, 5 or 6) had liabilities which were 59% lower.
Bike size – once mileage, age and experience had been
allowed for in the model, riders of bikes over 125cc had accident liabilities (for ‘all accidents’) that were 15% lower than riders of smaller bikes. However, there appeared to be an effect of bike size on accident severity, such that the higher accident risk of bikes of 125cc and below was restricted mainly to the least severe accidents. This is consistent with previous work that has shown a risk per mile of fatal accidents that increases with engine size.
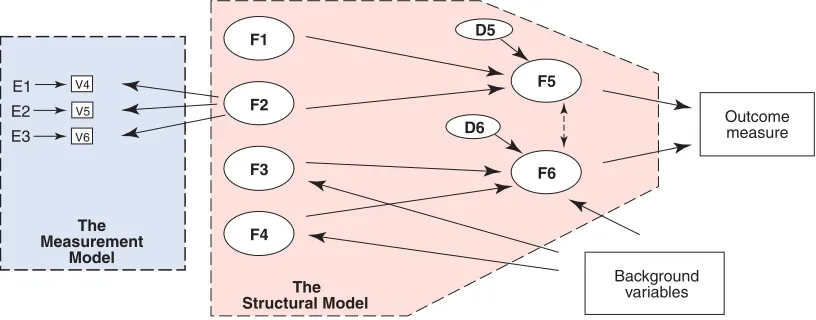
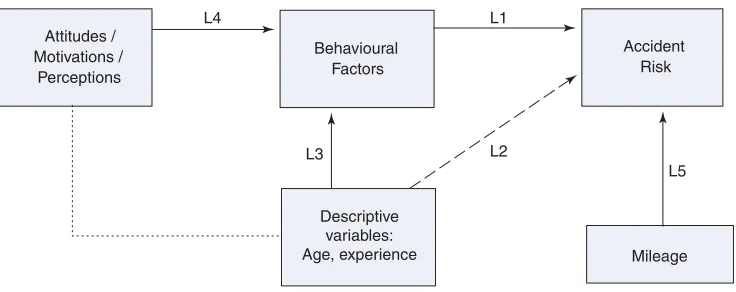
Two models of rider behaviour were developed using statistical modelling techniques. In these models attitudes/ motivations/perceptions and rider style influence rider behaviour, which in turn influence the likelihood of accident involvement. Age, sex and experience may influence both attitudes and behaviour, and may also have a direct influence on accidents. Accident risk is also directly influenced by the number of miles ridden in the past 12-months.
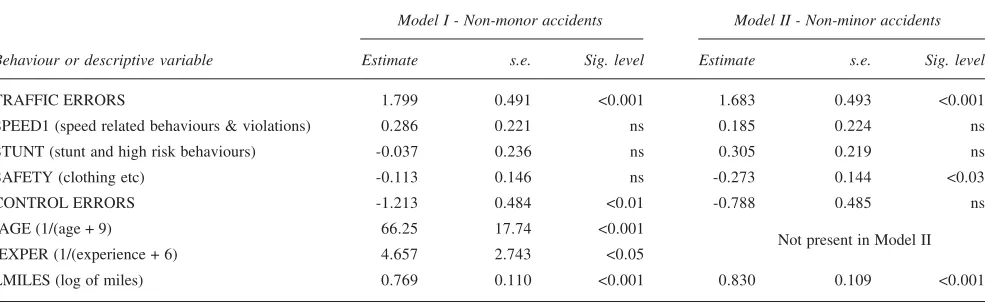
The reported frequency of errors was the most important behavioural contribution to accident involvement (once the mileage effect had been taken into account). Traffic errors (mostly associated with failures of hazard perception or observational skills) were the most consistent predictors. Control errors (mainly to do with difficulties of control associated with high speed, or errors in speed selection) were also important in some analyses. However, these errors occur in a context that suggests they may be closely linked with riding styles involving carelessness, inattention and excessive speed – i.e. styles that might be termed ‘violational’.
When age and experience were not permitted to influence accidents directly in the model, stunt/high risk behaviours became significant predictors of accidents. This is consistent with the explanation that one of the risk-increasing characteristics of young or inexperienced riders is their tendency to indulge in overtly risky behaviours.
Riding style, getting pleasure from motorcycling, and a liking for speed were identified as predictors of behavioural errors (that were, themselves, predictors of accidents). These predictors were also inter-correlated. Such relationships lend support to the view that an important part of the motorcycle safety problem stems directly from the motivations for choosing to ride motorcycles. This presents a challenging problem for road safety.
This report contains the findings of a study conducted on behalf of Road Safety Division, Department for Transport. The objective of the study was to explore and quantify the interacting influences which determine motorcyclist accident (and casualty) liabilities.
The study first reviewed existing data sources to investigate the trends in motorcycling accidents over the last decade or so. Analysis of this trend data, along with other published national data showed no evidence that the emergence of a previously unrecognised risk factor is needed to explain the recent trends in motorcycle accidents. The data showed that the number of casualties either per motorcycle or per km travelled has been fairly stable over the last decade or so. Thus it would appear that the increase in the number of casualties is mainly due to the increased number of motorcycles and the increase in the distances being travelled.
The main part of the study was to carry out a survey of current motorcyclists designed to explore the relationship between accident (or casualty) risk and variables such as annual mileage, age, experience, journey type, training, personal characteristics of the riders, and the self-reported behaviours and attitudes of the riders.
After careful design and piloting, a questionnaire was sent to 30,000 motorcyclists who were current riders and whose motorcycle was privately owned. About 40% of recipients responded to the questionnaire mailing and this provided 11,360 responses for analysis. The questionnaire asked about riding experience, accidents (including minor spills and more serious accidents), whether the rider was to blame, and a number of ‘psychological’ measures related to the rider’s behaviour and attitudes. The questionnaire also asked for basic data about the rider’s age, sex, socio-economic status, and car driving experience.
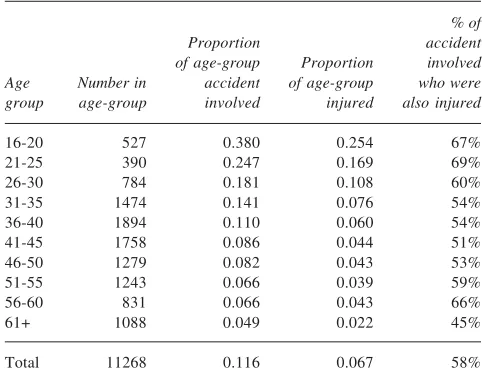
Analysis of the data returned by respondents showed that male riders were in the majority; female riders constituted only 9% of the sample. Just over 11% of male riders and just over 15% of female riders were accident involved in their past 12-months of riding, the overall accident involvement for all riders being 11.7%.
The number of accidents reported by riders within the past 12-months of riding were modelled using generalised linear techniques to take into account factors such as mileage, age, experience, bike size and the conditions prevailing when they rode (summer/winter, wet/dry etc). The multivariate model found that all these factors were important in ‘explaining’ accident involvement. The sex of the rider, whether the rider had taken compulsory basic training, or whether he or she had ‘taken a break from riding’ did not enter the model as statistically significant variables. The findings may be summarised as follows:
Annual mileage – the relationship was non-linear in that
accident liability was proportional to mileage0.4.
Age and riding experience – accident liability fell with
The report makes a number of recommendations for improving the safety of motorcycle riders including the following:
Young, inexperienced riders should continue to be a target group for safety interventions – they are at particularly high risk and they can be reached by the training/testing/licensing system. It would be useful to undertake research to develop and validate suitable interventions for these riders – which might include elements of graduated licensing as well as
improvements in training and education.
As motorcyclists become more experienced and develop improved riding skills they may make more demands on those skills as they continue to seek fun and excitement from motorcycling. There may be potential in the training and rider development provided by the advanced motorcycling organisations to promote a careful, safe, responsible riding style, perhaps by promoting alternative aspirations for motorcyclists – e.g. competence, wisdom and safety rather than excitement, ‘progress’ and speed.
Although behavioural errors associated with lack of control skills show a consistent relationship with accident liability, they tend to be errors associated with an ‘enthusiastic’ riding style. This reinforces the by now well-recognised need for rider and driver training not to focus on control skill alone, but to improve insight into risk and self-limitations.
There was no evidence that people returning from riding after a long break are at increased risk (though the study was not able to rule out a short term increase in risk). Nevertheless, returning riders increase the amount of motorcycling and the number of motorcycling accidents. Consideration should be given to developing training and educational material for these riders and to encouraging them to participate. This might be done in collaboration with manufacturers, insurers and
motorcycling organisations.
1 Introduction
Motorcyclists are more at risk of being killed or injured in a road traffic accident than any other type of vehicle user. In 2001 there were over 580 motorcycle riders or
passengers killed in road accidents, 7305 killed or seriously injured (KSI) and over 28,800 involved in reported injury accidents (all severities).
The risk depends on factors such as the rider’s age, sex, experience, type of road, characteristics of the motorcycle and exposure. The assessment of risk is complicated by interactions between these and other factors. This report contains the results and findings of a study conducted on behalf of Road Safety Division, Department for Transport, with the objective of exploring the interacting influences of various factors upon the trends for motorcyclist casualties.
The current pattern of motorcyclist casualties is very different from that of a decade and more ago when young motorcyclists on smaller capacity machines accounted for most of them. This arises, at least in part, from the changes in the types of motorcycles being ridden. There has been a long term trend towards the use of the larger machines (over 500cc engine capacity) such that by 1996 they accounted for over two thirds of the motorcycle stock and nearly two thirds of fatalities (Elliott et al., 2003). In addition, there have also been recent developments in the ‘powered two-wheeler’ market, with sales of motor scooters increasing.
In order to understand the reasons for the changes that have occurred in motorcycle accidents over the last decade or so, we need to know much more about the trends in the characteristics of the machines that motorcyclists choose to ride as well as the changes in the skills, experience and attitudes of the riders themselves. This report contains the findings from a study that collected such information and explored the interacting effects of these and other variables on accident risk with a view to identifying accident remedial measures.
The study included two tasks. The first was an analysis of existing data sources, such as STATS19 and the National Travel Survey, to identify trends and to assess, within the limitations of the available data, the influence of variables such as exposure, age, riding experience and sex
on accident risk. The second task was to undertake a survey of current motorcyclists, so as to enable variables such as attitudes, personal characteristics, self-reported riding behaviours and level of experience and training to be explored as contributors to accident risk.
Section 2 summarises the main findings of the survey of trends using existing data sources. Sections 3 and 4 describe the survey; the development of the questionnaire is discussed in Section 3 and the characteristics of the sample of motorcyclists are described and illustrated in Section 4. Section 5 describes a multivariate analysis of the basic response data (excluding the psychological data) using a Generalised Linear Model. Section 6 describes a more complex model in which accident risk is related to the riders’ self reported behaviour and attitudes; the model is fitted using a structural modelling approach. Section 7 reviews motorcyclists’ risk factors in the light of the earlier analyses, and Section 8 summarises the study giving conclusions and recommendations. Appendix A is a copy of the questionnaire, Appendix B presents the factor analysis of the psychological data, and Appendix C some of the results obtained from the Structural Equation modelling.
2 Trends in motorcycling
This section of the report presents background information culled from a variety of existing sources to examine the trends in motorcycle accidents and in the characteristics of motorcycling.
2.1 Trends in motorcycle accidents
Motorcyclists are more at risk of being killed or injured in a road traffic accident than any other type of vehicle user. Statistics for fatal and serious injury accidents involving motorcyclists showed an increase of 7 per cent in 1999 and 7 per cent in 2000 with a reduction of 1% in 2001. There were, however, still over 580 motorcycle riders or passengers killed in 2001, 6724 seriously injured and over 28,800 in total involved in reported injury accidents. The trends in injury accidents over the last decade or so are shown in Figure 2.1.1
0 10000 20000 30000 40000 50000
1988 1990 1992 1994 1996 1998 2000
Year
Number of Stats19 casualties
KSI All severities
0 200 400 600 800 1000
1988 1989 1990 1991 1992 1993 1994 1995 1996 1997 1998 1999 2000 2001
Engine size cc
Thousands
<50cc 50-125 125-500 >500cc Total
0 10 20 30 40 50 60
1988 1989 1990 1991 1992 1993 1994 1995 1996 1997 1998 1999 2000 2001
Year
Rate per 1,000 registered bik
es
KSI All severities 2.2 Trends in motorcycle numbers and sizes
Figure 2.2.1 shows how the numbers of licensed motorcycles have changed since 1988. The curve for the total number of motorcycles shows that since 1995 there has been an increase in the number of registered motorcycles, such that the size of the motorcycle fleet in 2001 had increased to the level it was in 1989.
It would appear therefore that in simple terms, the upward trend in motorcycle numbers since 1995 is more than enough to account for the increase in casualties during the same period (Figure 2.2.1). This is shown more clearly in Figure 2.2.2 which shows the overall rate per 1,000 registered motorcycles from 1988 to 2001 for killed and seriously injured casualties (KSI) and all casualties. The rate per 1,000 registered bikes has generally been decreasing since 1991.
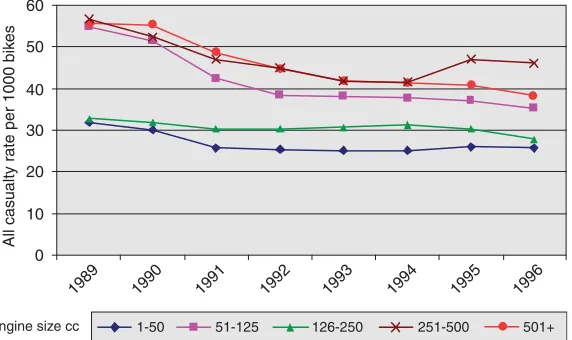
This simple conclusion is potentially complicated by the fact that during the same period, the mix of motorcycle engine sizes has been changing. Figure 2.2.1 shows a steady increase in numbers of machines over 500cc, and since 1997 a gradual increase in the number of smaller machines, this last trend being accounted for, at least partly, by the recent increase in popularity of motor scooters. Figure 2.2.3 shows trends in motorcycle casualties for each size of bike. Comparing Figure 2.2.1 with Figure 2.2.3 shows that for most sizes of bike, the trend in casualties is largely consistent with the trend in numbers of machines.
This is shown more clearly in Figure 2.2.4 which plots the casualties per 1000 motorcycles by size of bike. Unfortunately, only data up to 1996 are available for providing the detailed analysis by size of bike shown in Figures 2.2.3 and 2.2.4.
2.3 Motorcycle mileage
Although numbers of motorcycles provide a basic
indication of exposure to risk, and thus a basic explanation of trends in accidents, a more direct measure of exposure is provided by mileage ridden. The change in motorcycle mileage estimated from traffic counts (Road Casualties Great Britain, 2002) between 1990 and 2001 is shown in Figure 2.3.1. The distance covered by motorcycles fell by 50% between 1990 and 1993, and then remained relatively stable until 1998 when it starting increasing. This pattern is broadly consistent with the casualty trend in Figure 2.1.1, though casualties did start to rise slightly earlier than the upturn in annual mileage.
More detail is given in Figure 2.3.2, which plots the number of motorcyclists who were killed or seriously injured (KSI) per 100 million kilometres ridden and the number of all-casualties per 100 million kilometres. It shows the rate dropped from 1990 to 1991 and since then has remained fairly stable.
This mileage information is not available by engine size but Broughton (1998) showed, using journey data collected
Figure 2.2.1 Number of motorcycles currently registered by engine capacity
0 5,000 10,000 15,000 20,000 25,000
1984 1989 1990 1991 1992 1993 1994 1995 1996
Engine size cc
All casualties
1-50 51-125 126-250 251-500 501+
0 10 20 30 50
40 60
1989 1990 1991 1992 1993 1994 1995 1996
Engine size cc
All casualty r
ate per 1000 bik
es
1-50 51-125 126-250 251-500 501+
30 35 40 45 50 55 60
1990 1991 1992 1993 1994 1995 1996 1997 1998 1999 2000 2001
100 million motorcycle km
[image:10.595.149.451.82.258.2]Figure 2.2.3 Number of motorcyclist casualties by engine size of bike
Figure 2.2.4 Casualties per 1,000 registered bikes
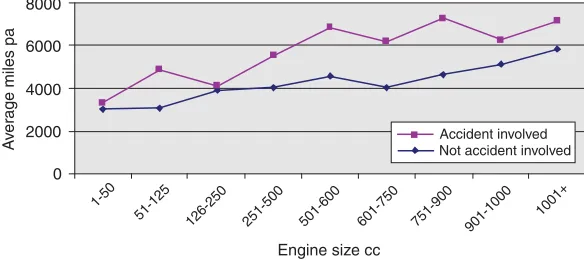
[image:10.595.164.450.312.482.2]from the National Travel Survey in 1985/86, that annual mileage increases markedly with engine capacity. This was true also in the survey to be presented later in this report. Figure 2.3.3 plots the average annual mileage by the size of bike for those riders who were accident involved and for those riders who were not accident involved. It clearly shows that the bigger the bike the more miles are ridden. The effect of exposure to risk is demonstrated by the difference between the two plots in the figure.
Figures 2.2.2 and 2.3.2 show that the number of casualties either per motorcycle or per km travelled has been fairly stable over the last decade or so. This it would
appear that the increase in the number of casualties is mainly due to the increased exposure to risk (measured by numbers of motorcycles or by annual mileage).
2.4 Rider age
Although trends in overall exposure to risk appear to be sufficient to explain accident trends, changes in the age distribution of casualties also need to be considered. Figure 2.4.1 shows the number of killed or seriously injured casualties (KSI) occurring each year since 1990. During the first half of the decade there was a significant 0
200 400 600 800
1990 1991 1992 1993 1994 1995 1996 1997 1998 1999 2000 2001
Rate per 100 million km
KSI per 100 million km All severities per 100 million km
Figure 2.3.2 Rate of killed or seriously injured and all casualties per 100 million km
0 2000 4000 6000 8000
1-50
51-125 126-250 251-500 501-600 601-750 751-900 901-1000
1001+
Engine size cc
A
v
er
age miles pa
Not accident involved Accident involved
0 1000 2000 3000 4000 5000
1990 1991 1992 1993 1994 1995 1996 1997 1998 1999 2000 2001
Age group
KSI casualties
[image:11.595.150.442.412.543.2]16-19 20-24 25-59 60+
Figure 2.3.3 Average annual mileage by capacity of motorcycle
fall in the number of young riders (aged 16-24yrs) being killed or seriously injured. However, for the 25-59 age group there was a steady rise in KSI numbers throughout most of the decade.
Whether this pattern can be explained simply in terms of changes in numbers and exposure of motorcyclists of different ages cannot be answered directly from published statistics. However, a trend in age can be confirmed by comparing age distributions of riders in the survey to be presented later in this report with the earlier survey of Taylor and Lockwood (1990). In the earlier survey about 15% of respondents were aged less than 20 years and had an average of 0.93 accidents per year. The current survey has only 4% of respondents under 20 years of age and they have an average of 0.58 accidents per year.
2.5 Implications of trends in motorcycling The trends in motorcycle casualties presented in this section can be broadly explained in terms of changes in numbers and sizes of motorcycle, and the mileage that they cover. Changes in the age distribution of casualties are also broadly consistent with the available data on changes in the age distribution of riders. It would therefore appear that the increasing trend in motorcycle casualties since 1996 does not, in itself, indicate the emergence of new or previously unrecognised risk factors for motorcyclists.
This is not the same as saying that motorcyclists’ accident risk is acceptable, or that no action is needed to improve motorcycle safety. First, any situation in which the absolute numbers of KSI casualties are increasing merits attention from the road safety perspective.
Secondly, motorcycle user accident risk is far higher than that of the car user. This is particularly true for accidents resulting in serious injury or death, where the casualty rate per 100 million vehicle kilometres is nearly 30 times higher for two wheeled vehicle users than for car users (Road Casualties GB, 2002)1. Thirdly, current trends involving increased recreational riding on powerful motorcycles, and increased use of scooters by young riders, may well continue. Indeed they may tend to accelerate as disposable income (for recreational riding) rises, and as traffic congestion and congestion charging increase. Fourthly, the gap in relative risk between cars and motorcycles seems likely to widen as improvements in primary and secondary safety become incorporated in the car fleet.
Clearly, therefore, it is highly desirable to find ways of improving motorcyclists’ safety – and to do this an understanding of the factors underlying motorcyclists’ accident risk is needed. Such factors potentially include the age and experience of the rider, ‘rider type’, attitudes, motivations, riding style, skills, and behaviours such as errors and violations. In addition, the size and type of motorcycle, and the purposes for which it is used, are potentially important. The survey to be presented in the remainder of this report aims to provide further insight into many of these issues.
3 The design of the motorcycle survey
3.1 Introduction
This section describes a survey of current motorcyclists, intended to enable variables such as attitudes, personal characteristics, self-reported riding behaviours and level of experience and training to be explored as contributors to accident risk. Originally the study was intended to focus on injury accidents only. It was to compare a random sample selected by DVLA of current motorcyclists with a sample of motorcyclists who were known (through STATS19) to have been involved in one or more injury accidents. The analysis would then apply a technique developed by TRL that was used in a study of work-related road accidents (Broughton et al., 2003).
In practice however, this research design could not be used for the present study because of difficulties in getting permission to have questionnaires sent to riders with STATS19 injury records. Instead, a single large random sample of 30,000 current motorcyclists was obtained through access to the file of motorcycle keepers held by DVLA, and the questionnaire itself was used to identify riders who had been accident-involved. This, of course, meant that many of the accidents reported in the survey were ‘damage-only’. All the motorcycles in the sample were privately owned so that there were no motorcycles in the sample belonging to motorcycle training organisations, motorcycle retailers or motorcycle courier firms.
Respondents were required to be ‘active’ motorcyclists and so only owners of bikes which had been road taxed within the past 12 months were included. A questionnaire was developed (see Section 3.2) which was sent to the selected sample in the last two weeks of June 2002. Reminders were sent a month later by which time 8,500 had been returned (30% response rate). The survey was closed in early September by which time the number of returns was 11,360 (40% response rate).
3.2 The questionnaire
The questionnaire used in the survey was designed to tap those variables regarded as likely to influence accidents involving motorcycle riders and which could be measured using self-reported questionnaire scales. Its coverage was therefore guided by the model of motorcycle behaviour discussed in Section 6. The questionnaire was pre-piloted using focus groups of motorcycle riders, and later piloted using a postal survey.
The focus groups included motorcyclists of differing ages from a range of backgrounds with varying levels of
motorcycle riding experience. There were three groups in all, each comprising five or six motorcyclists and two TRL researchers. Participants were encouraged to talk about their involvement in motorcycling and the accidents they had experienced. They were asked for their views on the questionnaire. Their comments were incorporated into a revised version of the questionnaire which was then piloted.
the factor analysis to the pilot survey responses allowed the questionnaire to be shortened while still measuring the underlying factors with adequate reliability. The
questionnaire, which is presented in Appendix A consisted of four sections (Sections A-D) as described below.
3.2.1 Section A: The rider’s riding experience Section A consisted mainly of descriptive variables. These were:
Whether or not the rider had ridden in the last year. Various aspects of the rider’s experience.
An estimate of the mileage ridden on public roads in the last 12 months. Respondents were asked to state their overall annual mileage as well as the mileage ridden of each type of motorcycle used by the respondent split by summer and winter.
The engine size of bike most often ridden on public roads split by summer and winter use.
How often a motorbike had been ridden on public roads by road type and journey purpose – also split by summer and winter.
A comparison between the amount of motorcycle use in the current year compared to the year before by road type and trip purpose.
The number of licence endorsement points accumulated whilst riding a motorcycle (not including minor infringements).
Information about the training courses the respondent had taken.
Whether or not the respondents belonged to a motorcycling organisation or club.
3.2.2 Section B: Accidents
Section B of the questionnaire elicited information about respondents’ road accidents and ‘near misses’.
Respondents were first asked how many road accidents (including minor spills) they had been involved in while riding a motorbike on a public road in the last 12 months. Those respondents who reported having been accident involved were then asked for the following information relating to their 3 most recent accidents:
The date the accident(s) occurred.
An indication of ‘what happened first’ in the accident(s) (i.e. the primary point of impact).
Whether or not the accident(s) was a minor spill or a low speed manoeuvring accident.
The type of road on which the accident(s) occurred. The road and weather conditions at the time of the
accident(s).
The severity of the injuries sustained by respondents and other road users as a result of the accident(s).
The extent of the damage caused to the motorbike and to other vehicles in the accident(s).
The type of motorbike being ridden at the time of the accident(s).
The purpose of the journey being made when the accident happened and the time of day.
The extent to which respondent felt to blame for the accident(s).
Riders were finally asked to estimate how many times they had had the impression of only just avoiding an accident (a ‘near miss’).
3.2.3 Section C: Rider behaviour, motivation and attitudes Section C of the questionnaire consisted of items intended to quantify the riders’ behaviour and attitudes. This information was collected in order to build a statistical model which would help to provide some understanding of the psychological antecedents of motorcycle accidents. The rationale for the choice of these variables and how they were to be incorporated into a behavioural model will be described in Section 6.
There were two ‘mini-questionnaires’ embedded into this part of the main questionnaire. One was a ‘Motorcycle Rider Behaviour Questionnaire’ (MRBQ) and the other a ‘Motorcycle Rider Motivation Questionnaire’ (MRMQ). Also included were items relating to the wearing of safety equipment, accident causes, riding skills, accident involvement with other riders and a motorcyclists ‘riding style’ scale.
The ‘Motorcycle Rider Behaviour Questionnaire’ (MRBQ) required respondents to rate how often (on a 6-point scale from ‘never’ to ‘nearly all the time’) they engage in certain behaviours while riding a motorbike. The MRBQ was based on the Driver Behaviour Questionnaire (DBQ) developed at Manchester University (Reason et al., 1990). Of the original 50 DBQ items, those that applied to motorcyclists or could be modified to do so were retained, and the rest dropped. Some new items were added. Focus groups were used to refine the items, 50 of which were then selected for use in the pilot survey. Following factor analysis of the pilot survey data, this pool was reduced to 43 items, loading onto five underlying factors which are described in Section 6. The detailed factor analysis of the MRBQ for the main survey sample is presented in Appendix B.
The Motorcycle Rider Motivation Questionnaire (MRMQ) was designed to assess the motivations of motorbike riders, and was based on the work of Schulz and colleagues (e.g. Schulz et al., 1991). This part of the questionnaire required respondents to rate on a 5-point scale, how strongly they agreed or disagreed with a number of statements about motorcycling. The final version of the MRMQ used in this study contained 24 items. The starting point for developing the MRMQ was a 57 item
questionnaire translated from German, and reported by Brendicke 1991. Further items judged to measure
questionnaire. The MRMQ is discussed further in Section 6 and Appendix B includes a detailed factor analysis of the MRMQ for the main survey sample.
In addition to the MRBQ and the MRMQ items, the following sets of questionnaire items were incorporated into Section C of the questionnaire:
Respondents were asked about the causes of accidents involving motorbikes. To assess opinions on accident causes, respondents rated on 5-point scales how much they agreed or disagreed with a number of statements such as ‘accidents involving motorbikes are often caused by motorcyclist going too fast’, or by ‘drivers not noticing motorcyclists’. Factor analysis showed that this set of items represented two underlying factors, one related to accidents caused by the behaviour of the motorcyclists themselves and the other related to accidents caused by the behaviour of car drivers. Respondents were asked to assess how much better or
worse they consider themselves compared to other motorcycle riders in terms of a number of riding skills. Five items, each requiring a response on a 5-point rating scale were used, including ‘controlling the motorbike’, ‘spotting hazards’ and ‘anticipating what other road users are going to do’. Factor analysis showed that these items, together with a question asking riders to assess how likely or unlikely they were to be involved in an accident while riding a motorbike, were indicators of a single underlying factor related to self-assessed riding skill.
Respondents were also asked to rate how often they used various pieces of safety equipment (e.g. protective and/or highly visible clothing) using a 6-point scale that ranged from ‘never’ to ‘nearly all the time’. Factor analysis showed that these items were indicators of a single underlying factor.
A riding style scale was also used. This was based on the driving style scale reported by Guppy et al. (1989), but worded in terms of motorcycle riding as opposed to car driving. It required respondents to rate their own riding style on twelve, 7-point semantic differential scales anchored at the ends – for example ‘attentive – inattentive’, ‘selfish – considerate’ and ‘nervous – confident’.
This scale has proved to be useful in the past to predict car driver accidents (e.g. Maycock and Forsyth, 1997). The items represent three underlying factors, as described in Section 6.
3.2.4 Section D: Personal data, car driving experience In the fourth and final section of the questionnaire information was obtained about the respondents’ age, sex and socio-economic status. In this section, respondents were also asked whether they had driven a car or van in the last 12 months and if so, how many miles they had driven in a car/van in that time. They were also asked how many accidents, if any, they had while driving a car/van in the last 3 years.
4 The motorcycle survey data
4.1 Characteristics of the respondents
In the questionnaire, respondents were asked questions about themselves, their motorbike(s) and their biking habits. Space does not allow a complete tabulation of the extensive data, but the following paragraphs give an indication of the key characteristics of the sample.
4.1.1 Age
The distribution of the sample by age and sex is shown in Table 4.1.1. The mean age of all respondents was 43 years (44 for male and 38 for female riders) and the range from 15 to 94 years. The majority (90.9%) of respondents were male. The age distribution is fairly similar for males and females, with a peak for male respondents aged around 36-40, and a peak for female respondents aged 31-35. Clearly age, per se, has no causal implication in motorcyclist accidents; it is some psychological correlate of age which influences accident liability as the years pass. This is investigated in later sections of the report. However it is of interest to look at the distribution of age and sex within the sample and perhaps to note that there were 245
respondents who were aged over 70 years (2.2%).
Table 4.1.1 Number of respondents by age and sex
Sex
Age Male Female Total
group
(years) Count Col % Count Col % Count Col %
16-20 421 4.1 106 10.4 527 4.7
21-25 317 3.1 73 7.1 390 3.5
26-30 663 6.5 121 11.8 784 7.0
31-35 1301 12.7 173 16.9 1474 13.1
36-40 1723 16.8 170 16.6 1893 16.8
41-45 1643 16.0 115 11.3 1758 15.6
46-50 1199 11.7 80 7.8 1279 11.4
51-55 1167 11.4 75 7.3 1242 11.0
56-60 781 7.6 50 4.9 831 7.4
61+ 1028 10.0 59 5.8 1087 9.6
Total 10243 100.0 1022 100.0 11265 100.0
4.1.2 Miles ridden
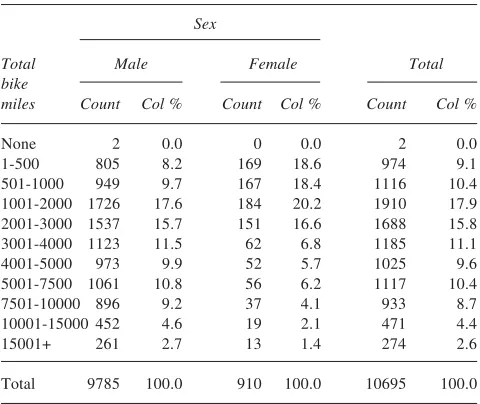
The respondents reported having ridden an average of 4677 miles in the last 12 months (4823 for male and 3109 for female riders). Table 4.1.2 shows the distribution. The most frequently reported annual mileage range for both male and female respondents was 1001-2000. Very few respondents (2.6%) reported mileage of 15,000 and over. Males tended to ride higher mileages than females, relatively few of whom reported annual mileages of more than 3,000 miles.
4.1.3 Experience
in Table 4.1.3. They reported a mean level of experience of 15 years (16 for male and 8 for female riders) ranging from less than a year’s experience to 73 years experience.
Female riders reported relatively few breaks and so their recent riding experience was similar to that shown in Table 4.1.3. In fact, only 24.2% of female riders reported that they had taken a break from riding.
In the case of male riders the most frequently reported band for recent riding experience was 2-5 years. In fact, for male riders there was almost an equal split between those who had taken a break from riding on public roads and those who had not, the figures being 49.3% and 50.7% respectively.
Overall nearly 70% of riders who took a break ceased riding for 5 years or more.
4.1.5 Size of bike
Respondents were asked what size of motorcycle they used most often ‘last summer’ and ‘last winter’. Last summer the most popular bike size for male riders was 501-600cc (17.5%); for females it was 1-50cc (31.6%). Males tend to ride larger bikes than females. The proportions of male respondents reported riding bikes of 901-1000cc and over 1001cc was 10.2% and 14.4% respectively, whereas the corresponding figures for females were considerably lower (1.9% and 3.4% respectively). Few respondents, males or females, reported riding bikes with an engine size in the range 126 -250cc (5.5% and 5.4% respectively).
4.1.6 Bike use
Respondents were asked how often they had ridden different types of motorcycle last summer and last winter and to state the total mileage they had ridden on each type of bike. For each type of bike, the respondent was asked to tick one of the ‘frequency-of-use’ categories (daily, weekly or monthly). Generally, respondents were riding motorcycles less frequently last winter than last summer, though use depended to some extent of the type of bike. For example, 52.2% of sports motorcycles were used at least weekly last summer and 28.3% last winter. In the case of ‘commuting/roadster’ and ‘scooter’ use there was a significant proportion of respondents who reported ‘daily’ use (13-15%), regardless of season.
In the case of ‘sports’, ‘touring’ and ‘commuting/ roadster’ motorcycles, the most frequently reported mileage figure for the last 12 months was, 1001-2000 miles. However, the most frequently reported mileage category for ‘off-road’, ‘classic’, ‘scooter’ and ‘moped’ categories of motorcycle was 1-500 miles in the year. Very high mileages of 10,000+ miles were reported and mainly by respondents riding sports, touring and commuting / roadster motorcycles.
4.1.7 Bike use in previous year
Two thirds of respondents reported that the amount they had ridden on public roads in the last 12 months was about the same as the amount they rode on public roads the 12 months before that. Of the other respondents some
[image:15.595.49.289.67.269.2]reported an increase in riding activity and some a decrease. Hence there was little overall change in riding activity. Some items however did show some noteworthy changes; there were fairly large net increases in the amount of riding in built-up areas, and on country and rural roads and for Table 4.1.2 Annual motorcycling mileage by sex
Sex
Total Male Female Total
bike
miles Count Col % Count Col % Count Col %
None 2 0.0 0 0.0 2 0.0
1-500 805 8.2 169 18.6 974 9.1
501-1000 949 9.7 167 18.4 1116 10.4
1001-2000 1726 17.6 184 20.2 1910 17.9
2001-3000 1537 15.7 151 16.6 1688 15.8
3001-4000 1123 11.5 62 6.8 1185 11.1
4001-5000 973 9.9 52 5.7 1025 9.6
5001-7500 1061 10.8 56 6.2 1117 10.4
7501-10000 896 9.2 37 4.1 933 8.7
10001-15000 452 4.6 19 2.1 471 4.4
15001+ 261 2.7 13 1.4 274 2.6
Total 9785 100.0 910 100.0 10695 100.0
Table 4.1.3 Total years of motorcycling experience by sex
Sex
Male Female Total
Experience
(years) Count Col % Count Col % Count Col %
0-1 213 2.3 70 8.3 283 2.8
>1-2 726 7.7 168 19.9 894 8.7
>2-5 1643 17.5 224 26.5 1867 18.3
>5-10 1781 19.0 141 16.7 1922 18.8
>10-15 1085 11.6 77 9.1 1162 11.4
>15-20 986 10.5 83 9.8 1069 10.5
>20-25 895 9.5 40 4.7 935 9.2
>25-30 746 8.0 19 2.3 765 7.5
>30-35 406 4.3 10 1.2 416 4.1
35+ 893 9.5 12 1.4 905 8.9
Total 9374 100.0 844 100.0 10218 100.0
Tables D1 and D2, in Appendix D, show the relationship between age and experience for male and female riders respectively. The tables show, as expected, that most young motorcyclists only have a few years of experience, whereas the older the rider the larger the range of experience. However, it is interesting to note that around 16% of men and 30% of woman over 40 have less than five years experience. The 41-45 age groups in particular have a large proportion of relatively
inexperienced riders, with 21% of men and 49% of women reporting less than 5 years riding experience.
4.1.4 Breaks from riding
pleasure/leisure purposes. There were also fairly large decreases in riding in fog or snow and ice, which may have just been a reflection of the prevailing weather conditions.
4.1.8 Training
Respondents were asked what training, if any, they had undergone in motorcycle riding. The course most
commonly taken was Compulsory Basic Training; 50% of the respondents said that they had taken this. The next most taken course was the Direct/Accelerated Access course, and 15.2% of respondents reported having taken this course. 3.8% of the respondents reported taking an Advanced riding test.
30.4% of male riders and 19.2% of female riders reported being a member of a motorcycling organisation or club. Overall 29.4% of respondents were members.
4.1.9 Other
The majority of male respondents (94.4%) reported not having any licence endorsements for motorcycling offences in the last 12 months. 4.3% of the male respondents reported receiving 3 licence point
endorsements in the last 12 months, and 0.8% 6 points or more. 98.0% of female respondents reported no licence endorsements in the last 12 months. 1.7% of female respondents reporting having 3 licence points and the remaining 0.3% received 6 points.
Respondents were asked whether they had driven a car or van in the last 12 months, approximately how many miles they had driven and whether they had had any accidents whilst doing so. Most respondents, (89.0%), had driven a car or van in the last 12 months. Males were more likely to have driven than females: 91% compared to 72%.
Most of the respondents (87.9%) reported having no accidents whilst driving a car or van in the last 3 years. 10.9% of the respondents reported 1 accident in the last 3 years and 1.2% reported 2 or more accidents whilst driving in the last 3 years. The proportions of male and female drivers reporting accidents were almost identical.
Respondents were also asked to indicate which occupational category best described their present work situation or, if retired, their main work situation prior to retiring. Overall, 21% reported being senior managerial, administrative or professional, 11% were middle
managerial, and 23% were junior managerial. 30% reported being ‘skilled manual workers’, 9% ‘semi skilled’.
4.2 Accidents
4.2.1 Numbers of accidents
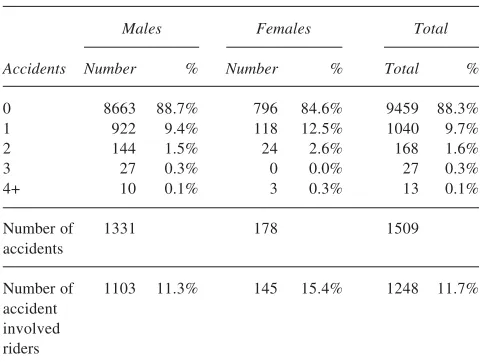
Section B of the questionnaire asked respondents about any accidents (including minor spills) they had in the past 12 months while riding on a public road. Respondents were also asked for the date(s) of the accident(s). The survey had been sent out in June 2002 and the last questionnaires accepted were in early September. Table 4.2.1 shows the numbers of accidents that fell in the required 12-month period.
4.2.2 Accident characteristics
It will be seen from Table 4.2.1 that in all, 1509 accidents dated within the 12 month period were reported.
Respondents were asked for details on the ‘most recent accident’, the ‘next most recent accident’ and the ‘one before that’. This means that for those drivers who reported having 4 or more accidents in the past 12 months, only details of the three most recent accidents would have been obtained. Thus, details of a few accidents (<0.5%) would have been excluded.
Of the 1495 accidents for which some details were available 629 involved damage only, 664 involved injury to the rider involved in the accident and 187 involved a serious injury or a fatality. (The remaining 15 of the 1495 did not have enough information to make this
classification.) Accident-involved respondents were asked ‘To what extent do you think you were to blame for the accident(s)?’ with possible responses of ‘not at all’, ‘a little’, ‘quite a lot’ and ‘entirely’. Overall, riders felt that they were ‘not at all’ to blame in 57% of accidents, to blame ‘a little’ in 20% of accidents, to blame ‘quite a bit’ in 6% of accidents and ‘entirely’ to blame in 17% of accidents. The riders’ opinions on blameworthiness of course depended on the type of accident and the circumstances attending the accident. In the paragraphs which follow, the phrase ‘mainly to blame’ represents the sum of the categories ‘quite a bit’ and ‘entirely’ to blame. Riders were asked to indicate whether the regarded the accident as ‘a minor spill’ or ‘a low speed manoeuvring accident’. 1126 accidents were classified as ‘minor spills’, 590 as ‘low speed manoeuvring’ and 345 were not assigned to either category. Some accidents were classified in more than one way, which accounts for the fact that the total of the above three figures is 2061, more than the total number of accidents reported.
Riders were asked to state what happened first in the accident – with 9 response categories being offered (question 16a).
[image:16.595.306.546.77.259.2]The most frequently reported category (apart from ‘other’, which applied to 25% of accidents) was the bike leaving the road without colliding with any other object Table 4.2.1 Number of accidents in a 12-month period
(according to the dates supplied)
Males Females Total
Accidents Number % Number % Total %
0 8663 88.7% 796 84.6% 9459 88.3%
1 922 9.4% 118 12.5% 1040 9.7%
2 144 1.5% 24 2.6% 168 1.6%
3 27 0.3% 0 0.0% 27 0.3%
4+ 10 0.1% 3 0.3% 13 0.1%
Number of 1331 178 1509
accidents
Number of 1103 11.3% 145 15.4% 1248 11.7%
(23%). The riders considered themselves mainly to blame in 36% of these accidents. The next highest category was that in which another vehicle collided with the rider (20%). The riders only consider themselves mainly to blame in 7% of these cases. In accidents in which the rider collided with another vehicle (17%), 22% or riders considered themselves to be mainly to blame. No other classification in this question exceeded 5%.
Most accidents (68%) were classified as occurring in built-up areas. The riders considered that they were mainly to blame for 19% of these accidents. 28% of accidents were classified as occurring on country/rural roads and riders considered themselves to be mainly to blame for 33% of these accidents.
Most accidents (57%) occurred in fine conditions, and 21% of these were considered to be mainly the riders’ fault. The next most frequent condition in which accidents occurred was in the rain or on a wet road. This category accounts for 19% of accidents, and 25% of riders
considered themselves mainly to blame for this category of accidents. Just over three-quarters of accidents (76%) happened during daylight hours.
Over half of the accidents reported (55%) occurred during commuting or work related riding, and it is likely that most of these would have been in built-up areas. Riders considered themselves not to blame for 59% of these accidents. 42% of accidents occurred when riding for pleasure, and 29% of these were thought to be mainly the rider’s fault.
Sports and sports tourer bikes account for the largest group of accidents with scooters accounting for the next largest group. Just over 50% of sports and sports tourer bikes were being used for pleasure purposes when the accident occurred, whereas about 60% of scooters and commuting/roadster bikes were being used for
commuting purposes when the accident occurred. These three types of bike (i.e. scooter, commuting/roadster and sports/sports tourer) account for two thirds of the bikes in the sample of accidents.
Riders were asked to specify whether there were any injuries sustained to themselves or to others as a result of the accidents and whether the injuries were slight, serious or, in the case of other road users, fatal. ‘Seriously injured’
was defined in the questionnaire as ‘e.g. needing hospital care’, ‘slight injury’ was defined as ‘e.g. cuts and bruises’. Riders were also asked about the damage to their
motorcycle or other vehicles involved in the accident. The data showed that 11% of accidents did not involve damage to the riders’ bike, 68% involved slight damage and 21% involved serious damage. The corresponding figures for damage to other vehicles were 73%, 24% and 3%. In 46% of accidents the motorcycle rider was slightly injured and in 12% of accidents the rider was seriously injured. The corresponding figures for injuries to other road users were 4% and 1%.
The severity of injury sustained in an accident will tend to be related to the extent of the damage to the riders’ bike and/or other vehicle(s) involved. The data show that where the bike was seriously damaged, then a third of the riders (33%) were seriously injured. In accidents where an ‘other’ vehicle was seriously damaged then over half of the riders (52%) were seriously injured.
4.3 Univariate accident relationships
Many interacting factors affect the accident liability of riders, and a multivariate approach is required in order understand the contribution of each in explaining accident risk. This multivariate analysis is explored in Section 5. However, the relationship between single variables and accident risk is first presented. It must be emphasised, however, that such univariate analyses can be misleading if we are trying to understand the factors that influence accident risk and devise countermeasures to reduce it. For example, age and rider experience are clearly related and to look at one without taking into account the other may produce misleading conclusions.
4.3.1 Exposure to risk
Exposure to risk, which consists of not just mileage, but the type of roads used and journeys undertaken, is clearly an important factor in the likelihood that a rider will be accident involved. The relationship between the annual miles ridden and accident involvement during the past 12-months is shown in Figure 4.3.1. The figure shows as
0.00 0.10 0.20 0.30 0.40 0.50 1-500
501-1000 1001-2000 2001-3000 3001-4000
4001-5000 5001-7500 7501-10000 10001-15000 15001+ Miles Accident in v olv ement Male Female
expected that as the number of miles ridden increases then the likelihood of being involved in an accident increases. It also shows that the probability of being accident involved at most levels of mileage is higher for females than for males.
4.3.2 Rider age and experience
The relationship between age and accident involvement is shown in Figure 4.3.2. The figure shows that those in the 16-20 years old age group have a high likelihood of being accident involved compared to the 21-25 year olds, and a very high involvment compared to the 40+ year olds. The younger males and females have a similar accident involvement, whereas the older females seem to have a higher involvement than the older males – and it needs to be borne in mind that differences in annual mileage have not been taken into account in Figure 4.3.2.
Rider experience (the length of time a rider has been riding a motorcycle) is also a key accident predictor. The effect of experience is difficult to disentangle from that of age, since the two variables are correlated. But studies that have succeeded in estimating the separate effects of age and experience have shown that experience on its own has an important influence on accident risk (e.g. Maycock et al.
(1991), Taylor and Lockwood (1990).
Experience for motorcyclists is difficult to quantify because riders often take long breaks from riding. Their
experience therefore may consist of a period when they were young and learning to ride followed after a break of some years by a period when they returned to riding. The questionnaire asked about any breaks from riding and asked respondents to estimate their overall riding
experience (in years) excluding any breaks they may have had from riding. Respondents were also asked when they last restarted riding after a break of over 12 months (if they had one) and an estimate of ‘recent experience’ since the most recent such break was then computed. Recent experience for those that had not taken a long break was the same as total experience.
Figure 4.3.3 shows the relation between accident involvement and these two measures of experience. Both plots show a strong trend for accident involvement to decrease as experience increases – though a part of this apparent experience effect will be associated with age differences. For riders with more than 5 years of experience, Figure 4.3.3 shows very similar levels of accident involvement regardless of how experience is measured, but at lower levels of experience the two plots diverge. This divergence is to be expected since the group with very low recent experience will include many older riders with substantial total experience (and a
correspondingly low accident involvement in keeping with their age and experience) who have recently taken up riding again.
0.00 0.10 0.20 0.30 0.40 0.50
16-20 21-25 26-30 31-35 36-40 41-45 46-50 51-55 56-60 60+
Age group
Accident in
v
olv
ement
Male Female
0.0 0.1 0.2 0.3 0.4 0.5 0.6
0-1 1-2 2-5 5-10 10-15 15-20 20-25 25-30 30-35 35+
Years
Accident in
v
olv
ement
All experience
Recent experience (after last long break)
Figure 4.3.2 Age group, and probability of accident involvement
4.3.3 Engine size and type of bike
Another factor that is potentially an important influence on accident involvement is the ‘size’ of bike being ridden (‘size’ in this context refers to engine size). The situation is complex because engine size and power (and power to weight ratio) are not simply related. Generally speaking, up to 600cc the larger the engine size of the bike the more powerful the machine. Beyond 600cc however, power will depend upon the type of bike. For example, 600cc sports bikes develop as much or more power than 1200cc cruiser bikes. To complicate matters further, there are also likely to be interactions between bike size and the characteristics of the riders. For example, learners are likely to use bikes up to 125cc, but 50cc bikes (mainly scooters), are also likely to be used by commuters with varying levels of experience. The relationship between bike engine size and accident involvement is shown in Figure 4.3.4.
Figure 4.3.4 shows separate plots for ‘all accidents’ reported in the survey, ‘non-minor’ accidents (those not classified by the respondent as a minor spill or a low speed manoeuvring accident), ‘no-injury’ accidents, ‘slight injury’ accidents (i.e. accidents resulting in cuts and bruises) and ‘serious injury’ accidents (e.g. those needing
hospital care). These categories are not all mutually exclusive. For ‘all accidents’, riders of motorcycles with engines up to 125cc have a much higher probability of accident involvement than riders of larger motorcycles, but beyond 125cc there is no obvious relationship between engine size and accident involvement. However, the excess accident involvement for bikes up to 125cc decreases as accident severity increases, such that for ‘non-minor’ accidents and ‘serious injury’ accidents there is no clear relationship between engine size and accident involvement across the whole range of bike size. Of course even if an apparent relation between accident involvement and bike size exists, this does not imply a causal link between the two because other factors, such as type of use, exposure, and rider age and experience are all associated with the size of bike ridden as well as with accident involvement. These effects, and the interaction between bike size and accident severity shown in Figure 4.3.4 will be returned to later.
A measure of accident involvement for the different engine sizes, adjusted for annual mileage is shown in Figure 4.3.5. The falling line in the figure shows the average number of accidents x 104/ the average annual mileage0.4. This mileage exponent was derived from a
0.00 0.05 0.10 0.15 0.20
1-50
51-125 126-250 251-500 501-600 601-750
751-900 901-1000 1001+
Bike capacity (cc)
Propor
tion accident in
v
olv
ed
Acc involved Non-minor acc No injury Slight injury Serious injury
0 10 20 30 40 50
1-50
51-125 126-250 251-500 501-60 0
601 -75
0 751
-90 0
901-1000 100
1+
Bike capacity cc
Age and e
xper
ience (yrs)
0 20 40 60 80 100 120 140
Accidents adjusted b
y
mileage
0.4
per 10,000
Age Experience Accidents adjusted by mileage0.4
Figure 4.3.4 Bike engine size and accident involvement
regression of mileage with accidents and is used to provide an accident liability index that adjusts realistically for mileage effects. The other lines in Figure 4.3.5 represent the average age and experience of the riders riding the various bike sizes. The mileage-adjusted accident rate for bikes over 125cc is half that for 51-125cc bikes, and a third of that for bikes of 50cc and below. The relative inexperience and youth of riders of smaller bikes is also shown. It remains to be seen whether the shape of the accident rate graph in Figure 4.3.5 can be explained by the differences in age and experience or not. This will be one of the key functions of the multivariate analysis.
Figure 4.3.6 shows similar information for the various categories of motorcycle. Clearly, moped and scooter riders have the highest adjusted (for mileage) accident risk and tend to be ridden by those riders with least experience
4.3.4 Training
Table 4.3.1 shows the probability of a rider being accident involved for riders who had (or had not) taken various levels of motorcycle training – specifically Compulsory Basic Training (CBT), Direct/accelerated access and a range of ‘advanced’ courses including the IAM Advanced Motorcycle Test, the RoSPA Advanced Riding Test, the Blue Riband Advanced Rider award, GNVQ ‘Advanced’ in Motorcycle Riding and some other (unspecified) advanced courses. The accident involvement figures have not been adjusted for mileage, though as the table shows average mileages differed little between the first three rows of the table. Note that in Table 4.3.1 riders are classified
by the highest level of training taken, so that the Advanced level includes some riders who have also taken Direct Access training or CBT.
Nothing can be concluded from this univariate analysis about the effect of training on safety. The apparently anomalous result for those who have taken no training (i.e. respondents who did not tick any of the training options) may at least partly be explained by the age and experience of riders who learned to ride before CBT was introduced in 1990. This is explored further in Section 5.1.3.
4.3.5 Type of experience/exposure
The average accident involvement of riders classified by variables such as frequency of use (monthly, weekly, daily), type of road (built-up, country/rural roads, and motorways/dual carriageways), weather and lighting conditions and seasonal effects (winter/summer) was calculated from the raw data. This simple univariate analysis does not however yield easily interpretable results because of the complex interactions between these variables and the age, experience and exposure variables already considered. Thus for example, accident
involvement may be higher for those riding in winter than in summer – but whether this is simply a reflection of increased annual mileage, or whether it indicates that winter riding is intrinsically more risky than summer riding, cannot be ascertained from such a simple analysis.
In an attempt to facilitate the interpretation of the data relating to the type of experience to which a rider is exposed, a typology of riders was defined. The underlying concept for this typology was to produce a hierarchy of ‘rider dedication’ ranging at one extreme from riders who ride in all circumstances including riding in the wet or dark during winter to those who ride only monthly, and only in the summer at the other. The hierarchy, consisting of 6 categories of riders, is shown in Table 4.3.2 together with the average mileage and the average probability of accident involvement in each of the groups.
The table shows that numerically speaking there are two main groups of riders – Category 1, those who ride in all Table 4.3.1 Training level, accident involvement and
mileage
Number Average Accident
of riders % mileage involvement
None 5366 47% 4,616 0.08
CBT 3893 34% 4,508 0.16
Direct access 1665 15% 4,716 0.14
Advanced 436 4% 6,685 0.11
0 10 20 30 40 50 60
Classic Tour
ing
Custom R
etro Spor ts / spor ts tour er Com
muting Off-ro
ad
Moped Scooter
Type of bike
Age/e
xper
ience in y
ears 0 10 20 30 40 50 60 70 80
10000 accs / mile
0.4
Experience
Age 10000*accs/mile0.4
conditions throughout the year, and Category 3, those who ride in all conditions during the summer, but do not ride in the winter. The former have a much higher probability of accident involvement than the latter but, again, this does not tell us whether there is a particularly high risk from all-year riding, or whether the effect is explained by the differences in annual mileage and rider characteristics.
5 Modelling the survey data
An important focus of the project was to identify factors influencing motorcycle accident risk so that they can be used (a) to help explain trends in accident numbers and (b) to help identify priorities for remedial
countermeasures. To accomplish this, given the inter-relationships between the possible explanatory variables, multivariate analysis is needed. Two approaches were taken: first, the generalised linear modelling method used extensively in earlier studies was used to investigate the relationship between accidents and variables such as rider age, experience, exposure, and bike size; these models are presented in this section. Secondly, a hybrid approach, using elements of structural equation modelling, factor analysis and generalised linear modelling was used to provide an insight into the contribution of rider-centred variables (attitudes, motivations, behaviours) to accident risk. These hybrid models will be described in Section 6.
5.1 Age, experience, mileage, training, bike size and ‘rider dedication’ as risk factors
Generalised linear modelling is a regression technique in which the dependent variable can be drawn from a range of non-Normal populations. In the present case, the dependent variable is the number of accidents that a rider has reported in a year, and this variable is assumed to follow a Poisson distribution. A statistical model can then be built using the statistical programme GLIM (Generalised Linear Interactive Modelling) which relates the number of accidents
experienced by riders to a range of explanatory variables. The quantity predicted by such a model is the ‘accident liability’ of the rider which is the statistically expected number of accidents per year the rider will have. Accident liability in the case of motorcyclists is up to about 0.7 expected accidents per year.
In previous TRL studies of accidents (Taylor and Lockwood 1990, Maycock et al., 1991, Maycock and Forsyth, 1997) a multiplicative model of the following form has been found to be suitable:
Loge (accident liability)
= b0 + b1 loge (miles) + b2 f (age)
+ b3 f (experience) + b4 f (other factors) + …. + error
Where b0, b1, b2, etc are coefficients to be estimated for the different functions of miles, age, experience etc., and ‘error’ is the residual error that is not accounted for by the fitted model.
Reciprocal age and experience functions have been found to be appropriate in previous studies (Taylor and Lockwood, 1990), and were again used in this analysis. It is also possible in these models to fit variables which are not continuous (as age, experience and mileage are) but are simple categories (like bike size). In this case, GLIM estimates a set of coefficient values, one for each level of the category variable.
GLIM estimates parameter values using maximum likelihood techniques and calculates for any particular model a ‘goodness of fit’ statistic called ‘deviance’ which is a measure of the discrepancy between the observed values and values predicted by the model. The statistical measure used to determine the importance of any specific variable within a model, is the ‘deviance difference’; it is the difference between the deviance of a model which contains the variable in question and one which does not. It is thus a measure of how much better the model fits the observed data when the additional variable is included in the model. The ‘deviance difference’ statistic is distributed as a chi-squared variable and it can be used to test whether the additional variable is effecting a statistically significant improvement to the model fit.
Table 5.1.1 shows the model fitted to the motorcycle accident data. It will be seen from the table that in addition to annual mileage (miles), age and experience (both in reciprocal form), the model includes 2-level categorical variables for training and bike size, and a 6-level categorical variable for rider dedication (as defined in Section 4.3.5 above). In the case of the categorical variables one of the levels of the variable is taken to be a ‘reference level’ (see table). The coefficients for the other levels then quantify the Table 4.3.2 Rider ‘dedication’ categories – a hierarchy of bike usage
Probability of being
Number Average accident
Category Conditions the rider is willing to ride in of riders % mileage involved
1 Ride at least daily or weekly in the wet and/or dark during Winter, i.e. ride in all conditions 5154 45% 6,070 0.16
2 Ride at least daily or weekly during the Winter but not in the dark or wet 877 8% 4,300 0.11
3 Ride in all conditions during the Summer months but not ride in the Winter 3405 30% 3,690 0.07
4 Ride daily during the Summer, but not ride in the wet or dark or during the Winter 64 <1% 1,980 0.05
5 Ride weekly during the Summer, but not ride in the wet or dark or during the Winter 520 5% 2,330 0.04
6 Ride monthly during the Summer, but not ride in the wet or dark or during the Winter 462 4% 2,050 0.03