A DISSERTATION ON
A DISSERTATION ON
A DISSERTATION ON
A DISSERTATION ON
“LEFT VENTRICULAR STRUCTURAL AND
FUNCTIONAL ABNORMALITIES IN TYPE 2
DIABETES MELLITUS”
M.D DEGREE
BRANCH - I
(GENERAL MEDICINE)
MARCH 2007
CERTIFICATE
This is to certify that the dissertation titled “STUDY OF LEFT
VENTRICULAR
FUNCTIONAL
AND
STRUCTURAL
ABNORMALITIES IN TYPE 2 DIABETES MELLITUS"
submitted by Dr. S.PALANISAMY to the Faculty of General
Medicine, The Tamilnadu Dr. M.G.R. Medical university, Chennai
in partial fulfillment of the requirement for the award of M.D. Degree
Branch I (General Medicine) is a bonafide research work carried out
by him under our direct supervision and guidance.
Dr. A. AYYAPPAN M.D., Dr. NALINI GANESH M.D.,
Professor of Medicine, Professor and Head
Chief II Medical Unit Department of Medicine,
Department of Medicine, Govt. Rajaji Hospital,
Govt. Rajaji Hospital, Madurai Medical College,
Madurai Medical College, Madurai.
DECLARATION
I, Dr. S. PALANISAMY, solemnly declare that the
dissertation
titled
“STUDY
OF
LEFT
VENTRICULAR
STRUCTURAL AND FUNCTIONAL ABNORMALITIES IN
TYPE-2 DIABETES MELLITUS” has been prepared by me. I also
declare, this bonafide work or a part of this work was not submitted
by me or any other for any award, degree, diploma to any other
university or board either in India or abroad.
This is submitted to The Tamilnadu Dr. M.G.R. Medical
University, Chennai in partial fulfillment of the rules and regulations
for the M.D. Degree Examination in General Medicine to be held in
March 2007.
Place: Madurai Dr.S.PALANISAMY
ACKNOWLEDGEMENT
My
sincere
thanks
to
The
Dean
,
Dr.S.M.SIVAKUMAR M.S,
for permitting me to use the
facilities of Madurai Medical College and Govt. Rajaji
Hospital to conduct this study.
My Professor and Head of the Department of
Medicine, Prof. NALINI GANESH M.D., has always
guided me, by example and valuable words of advice
throughout the conduct of the study and also during my
postgraduate course. My sincere thanks to her
I will ever remain in gratitude to my chief
Dr.A.AYYAPPAN M.D.,
Department of Medicine, not only
for guiding me through this study, but also for being my
mentor and source of inspiration during the period of my
My heartfelt thanks to Dr. J. SANGUMANI M.D.,
Dr. L. JERALD MAJELLAH M.D., Dr. P.R. SHEELA
M.D.,
Dr.
S.
SOMASUNDARAM
M.D.,
and
Dr.RAMAKRISHNAN M.D. for their valuable support
and guidance throughout the study and also for making
my stay in the unit both informative and pleasurable.
I express my sincere thanks to Dr. ARTHUR
ASIRVATHAM, MD., D.Diab., PROF. AND H.O.D.,
Diab., GRH,Madurai for his guidance throughout the
study.
I express my sincere thanks to Dr. S. MURUGAN
M.D., D.M., Assistant Professor, Department of
My family and friends have stood by me during my
times of need. Their help and support have been
invaluable to this study.
I would grossly fail in my duty if I fail to mention
here of my patients, who have ungrudgingly borne the
pain and discomfort of the investigations. I cannot but
pray for their speedy recovery and place this study as a
tribute to them and to the numerous others likely
CONTENTS
S.NO.
S.NO.
S.NO.
S.NO.
CONTENTS
CONTENTS
CONTENTS
CONTENTS
PAGE
PAGE
PAGE
PAGE
NO.
NO.
NO.
NO.
1.
1.
1.
1.
INTRODUCTION
1111
2.
2.
2.
2.
AIM OF THE STUDY
3333
3.
3.
3.
3.
REVIEW OF LITERATURE
4444
4.
4.
4.
4.
MATERIALS AND METHODS
28
28
28
28
5.
5.
5.
5.
RESULTS
31
31
31
31
6.
6.
6.
6.
STATISTICAL ANALYSIS
44
44
44
44
7.
7.
7.
7.
DISCUSSION
46
46
46
46
8.
8.
8.
8.
LIMITATIONS
50
50
50
50
9.
9.
9.
9.
SUMMARY
51
51
51
51
10.
10.
10.
10.
CONCLUSION
52
52
52
52
APPENDIX I : BIBLIOGRAPHY
APPENDIX II : GLOSSARY
APPENDIX III : PROFORMA
INTRODUCTION
The world today is witnessing an epidemic of diabetes
mellitus.1Globally and nationally, diabetes and its complications has become the
most important contemporary and challenging health problem.
It is estimated that there will be more than 200million diabetics
in the world within the next 10 years. India has already become the diabetes
capital of the world with over 30 million affected patients that is alarmingly just
a tip of the iceberg and is expected to touch the 55million mark in 2025.1
The impact of diabetes on both the health of the individual and
the health care system resides almost entirely in the long term complications of
diabetes.
The FRAMINGHAM HEART STUDY revealed marked
increase in peripheral arterial disease, congestive heart failure, coronary artery
disease, myocardial infarction and sudden death(The risk increases from 1 to 5
fold) in diabetics.2
The American Heart Association recently designated DM as a
major risk factor for cardiovascular disease along with other major risk
factors(smoking,hypertension and hyperlipidemia)3
Though DM is associated with a multitude of cardiovascular
complications recent studies have suggested structural myocardial involvement
relatively early in the course of the disease,15 initially impairing the diastolic
relaxation and when more extensive resulting in decreased myocardial
contraction. Prior to the development of symptomatic CHF sub-clinical LV
dysfunction (systolic and diastolic) does exist for some time.5
Further, increased LV mass has been documented in Type 2
Diabetes even in normotensive individuals at an early stage. LVH is an ominous
prognostic sign and independent risk factor for further cardiac events13 and
hence identification of this subset of patients would enable early interventional
strategies that could decrease the incidence of cardiac events.
There have been few studies that have evaluated the
development of systolic and diastolic LV dysfunction and LV mass in Type 2
DM patients, who are normotensive and have no cardiac symptoms.11
The present study was undertaken to make further inroads into
this aspect of diabetes that would have far flung implications in management of
AIM OF THE STUDY
Echocardiographic assessment of left ventricular functional and structural
abnormalities in Type 2 DM patients who are normotensive and without
any cardiac symptoms.
To assess the relationship between the duration of diabetes mellitus and
REVIEW OF LITERATURE
Definition:
DIABETES MELLITUS is defined as a syndrome characterized by
chronic hyperglycemia, associated with disturbances of carbohydrate, fat and
protein metabolism due to absolute or relative deficiency in insulin secretion
and/or action.
In view of the wide heterogeneity, Diabetes is regarded as a “syndrome”
rather than a disease entity.1
Classification:
This classification is based on the pathogenic process that leads to
hyperglycemia as opposed to earlier criteria that included the age of onset and
type of therapy.3
The classification of DM:
1. Type 1 DM (β cell destruction, usually leading to absolute insulin
deficiency)
A: Autoimmune mediated
2. Type 2 DM (may range from predominantly insulin resistance with
relative insulin deficiency to a predominantly insulin secretory defect
with insulin resistance)
3. Other types:
Genetic defects of β cell function characterized by mutation in:
1. Hepatocyte nuclear transcription (HNF) 4α MODY 1
2. Glucokinase MODY2
3. HNF-1α MODY3
4. Insulin promoter Factor (IPF) 1 MODY4
5. HNF-1β MODY5
Genetic defects in insulin action
1. Type A insulin resistance
2. Leprechaunism
3. Lipoatrophic diabetes
Disease of the exocrine pancreas
Endocrinopathies
Drugs, Toxin induced
Infections
Other genetic syndromes
TYPE 1 DIABETES MELLITUS:
This was previously known as Insulin Dependent Diabetes Mellitus
(IDDM). These patients require insulin for survival, as the endogenous insulin
secretion is almost absent in them. This disease has its onset most often in
childhood and adolescence, although it may occur at any age. Though usually
abrupt in onset, it can be protracted in its course. Genetic factors, autoimmunity
and environmental factors play a major role in the causation and the
precipitation of Type1 diabetes.
The auto immune aetiology of the disorder is well recognized by the
presence of immune markers, like Islet cell antibodies (ICA), Insulin
autoantibodies and antibodies against 64KD antigen.
Type 1 DM comprises of two broad categories, Type 1A and Type 1B.
Type 1A diabetes results from autoimmune beta cell destruction, which usually
leads to insulin deficiency. Type1B diabetes is characterized by insulin
deficiency of unknown aetiology, with lack of immunological markers
indicative of autoimmune destructive process of β cell.
Pathogenesis:
Type 1 DM develops as a result of synergetic effect of genetic,
environmental and immunological factors that ultimately destroy the β cells.
Individuals with a genetic susceptibility have normal cell β cell mass at birth,
months to years. The autoimmune process is thought to be triggered by an
infectious or environmental stimulus and to be sustained by a beta cell specific
molecule. In the majority of the individuals immunological markers appear
after the triggering event, but before diabetes become clinically overt. β cell
mass then begins to decline and insulin secretion becomes progressively
impaired, although normal glucose tolerance is maintained. Features of diabetes
do not become evident until a majority (>80%) of β cells are destroyed. At this
point, the residual functional β cells still exist, but are insufficient in number to
maintain glucose tolerance. The events that contribute to the transition from
glucose intolerance to frank diabetes are associated with increased insulin
requirements, as might occur during infections or puberty.
Various factors can be attributed to the pathogenesis of Type 1 DM: 1. Genetic factors
Genetic contribution to Type 1DM involves multiple genes. The
concordance of Type 1DM in identical twins is between 30-70%3, indicating
that additional modifying factors must be involved in determining whether
diabetes develops or not. The major susceptibility gene for Type1DM is located
in HLA region on chromosome 6. Most individuals with Type 1 DM have HLA
DR3/DR4 halotype. Refinements in genotyping of HLA loci have shown that
the halotypes DQA1*0301, DQB1*0302, DQA1*501 and DQB1*0201 have
2. Autoimmune factors:
Pathologically, the pancreatic islets are infiltrated with
lymphocytes (in a process termed insulitis) due to autoimmunity, leading to
destruction of the β cells. As a result, the following abnormalities appear in the
immune system;
a. Islet cell autoantibodies
b. Activated lymphocytes in the islets, peripancreatic lymphnodes and
the systemic circulation.
c. T lymphocytes that proliferate when stimulated with islet proteins,
and
d. Release of cytokines within the insulitis.
3. Immunological markers:
Islet cell autoantibodies are present in the majority (75%) of individuals
diagnosed as Type 1DM.This includes antibodies to GAD (Glutamic acid
decarboxylase) 65, IA-2/ICA-512 and Islet gangliosides.
4. Environmental factors:
Various environmental factors have been proposed to trigger the
autoimmunity in genetically susceptible individuals. They are mainly viral
infections (Coxsackie and Rubella), early exposure to bovine milk proteins and
TYPE 2 DIABETES MELLITUS
Type 2 DM is a heterogenous disorder with a complex aetiology that
develops in response to genetic and environmental influences. Central to the
development of Type 2 DM are Insulin resistance and Abnormal insulin
secretion. Although controversy remains regarding the primary defect, most
studies support the view that insulin resistance precedes insulin secretory
defects.
Genetic considerations:
Although the major genes that predispose to this disorder
have yet to be identified it is clear that the disease is polygenic and
multifactorial. The concordance of Type 2 DM in identical twins is between
70-90%3. If both parents have Type2DM the offspring have risk approaching 40%.
Pathogenesis:
Type 2 DM is characterized by 3 pathophysiological abnormalities:
1. Peripheral insulin resistance
2. Impaired insulin secretion
and 3. Excessive hepatic glucose production
Peripheral insulin resistance:
In early stages glucose tolerance remains normal despite insulin
resistance as the pancreatic β cells compensate by increased insulin output.
However as the insulin resistance and compensatory hyperinsulinemia progress,
hyperinsulinemic state. Thus begins a spectrum from impaired glucose tolerance
to overt diabetes mellitus reflecting the progress towards β cell failure.
Insulin resistance results from a combination of genetic susceptibility and
obesity. Insulin resistance impairs glucose utilization by insulin sensitive tissues
and increases hepatic glucose output, both effects contribute to hyperglycemia.
Increased hepatic glucose output and decreased peripheral glucose utilization
account for the increased fasting plasma glucose levels and postprandial
hyperglycemia respectively. The molecular mechanism of postreceptor defects
include (a). Polymorphism in IRS-1 (b)PI-3 kinase signaling defects, which
reduces translocation of GLUT4 to the plasma membrane and (c) elevated levels
of free fatty acids in obese individuals results in impaired glucose utilization in
skeletal muscle, promote glucose production by the liver and impair beta cell
Impaired insulin secretion:
The cause of impaired insulin secretion in type 2 DM is
unclear. It is hypothesized that this may be due to (a) Islet amyloid
polypeptide/amylin. (Amylin has been reported to lower basal and insulin
stimulated glycogen synthetase in the muscle and also to inhibit glucose
stimulated insulin secretion) (b)Glucotoxicity. Chronic hyperglycemia
paradoxically impairs beta cell function. (c) Lipotoxicity. Elevated free fatty
acids and dietary fat worsen islet function.
Increased hepatic glucose production
In type2 DM, insulin resistance in the liver reflects the failure of
hyperinsulinemia to suppress neoglucogenesis which results in fasting
hyperglycemia and decreased glycogen storage by the liver in the postprandial
state.
.
Risk factors for Type 2 DM:
1. Family history of Diabetes.
2. Obesity(BMI≥25kg/m2)
3. Habitual physical inactivity
4. Race/Ethnicity
5. Previously identified IFG or IGT
7. Hypertension(BP≥140/90mmHg)
8. HDL cholesterol level ≤35mg/dl), or TGL level ≥250mg/dl
9. Polycystic ovary syndrome or Acanthosis nigricans
Differentiation of Type 1 and Type 2 DM by clinical criteria: 3 S.No Type 1 DM Type 2 DM
1 Onset of disease prior to age of
30yrs
Onset of disease after 30years
2 Lean body habitus 80%obese(elderly individually may be
lean)
3. Requirement of insulin as the
initial therapy
May not require insulin therapy initially
4. Propensity to develop
ketoacidosis
Not usually prone for ketoacidosis
5. Associated with other
autoimmune
disorders(eg.autoimmune
thyroiditis,pernicious anaemia
and vitiligo)
Associated with conditions like
hypertension, dyslipidemia, PCOD and
cardiovascular disease.
6. Presence of ICA and GAD
Antibodies
DIAGNOSIS:3
Symptoms of Diabetes plus random* blood glucose concentration
>11.1mmol/L(200mg/dl)
or
Fasting** plasma glucose >7mmol/L(126mg/dl)
or
2hr plasma glucose>11.1mmol/L(200mg/dl)
during on oral GTT***.
*Random is defined as without regard to time since the last meal.
** Fasting is defined as no caloric intake for at least 8hrs.
*** The test should be performed using a glucose load containing the equivalent
of 75g anhydrous glucose dissolved in water; not recommended for routine use.
Long term Complications:
Although chronic hyperglycemia is an important aetiologic factor leading
to the complications of DM, four prominent theories have been proposed to
explain how hyperglycemia might lead to the chronic complications:
1. Formation of advanced glycosylation end products (AGEs) via
nonenzymatic glycosylation of intra and extracellular proteins.
2. Increased metabolism of glucose through the sorbitol pathway by the
osmolality, generates reactive oxygen species and alters the redox
potential and thus leads to cellular dysfunction.
3. Increase the formation of DAG (Diacyl glycerol) leading to activation
of Protein kinase C which in turn alters the transcription of genes for
fibronectin, type-IV collagen, contractile proteins and extracellular
matrix proteins.
4. Increased formation of Fructose-6-phosphate through the Hexosamine
pathway which may alter the function of nitric oxide synthase or by
changes in the gene expression of TGF-β and PAI-1(Plasminogen
S.No. Chronic complications of DM
1. Macroangiopathy Coronary artery disease, Cerebrovascular disorder,
Peripheral vascular disease
2. Microangiopathy Retinopathy, Macular edema, Nephropathy,
Neuropathy(Sensory, Motor), Autonomic
3. Others Dermatopathy, GIT (gastroparesis,
diarrhea),Genitourinary(Uropathy, sexual
LV STRUTURAL AND FUNCTIONAL ABNORMALITIES NORMAL LV FUNCTION
The three basic events of the cardiac cycle are
1. LV contraction
2. LV relaxation
3. LV filling.
1. LV Contraction
It comprises of 1.Isovolumic contraction phase extending from closure of
mitral and tricuspid valve to the time when pressures in the left and right
ventricles exceed the pressures in the aorta and the pulmonary artery 2.Phase of
ventricular ejection that begins as the aortic and pulmonary valves open and
ends when the ventricular pressures drop rapidly.
2. LV Relaxation
It comprises of i). Protodiastole (Phase of reduced ejection) the period
when the ventricular pressures drop very rapidly and ends when the
momentum of ejected blood is overcome and aortic and pulmonary valve close.
ii). Isovolumic ventricular relaxation: Begins with closure of the aortic and
pulmonary valve and ends with the opening of AV valves as ventricular
3. Left ventricular filling:
It comprises 1.Rapid filling phase which starts as pressure in the ventricle
drops below the left atrial pressure and the mitral valves open. This period of
rapid filling ends when pressure in the atrium and ventricle equalize. 2.
Diastasis: virtually no flow into the ventricle is seen during this phase 3.Atrial
systole (Late diastolic phase).
LV SYSTOLIC FUNCTION: 6
The determinants of LV systolic function are 1.preload 2.afterload
3.myocardial contractility and 4.heart rate
The specific indices used to evaluate LV systolic function are:
1. Ejection fraction
Ejection fraction is defined as the ratio of the stroke volume to end
diastolic volume.
EF = EDV – ESV/EDV × 100(%)
The normal value of LVEF is 55-75%.
2. End systolic ventricular volume/dimension:
ESV is strongly afterload dependent and is relatively independent of
preload. It is useful to assess LV function in patients with valvar regurgitation.
3. Other indices:
Include VCF (Velocity of circumferential fibre) shortening, Afterload
stiffness, Preload recruitable stroke work and the Maximum rate of pressure
rise.
LV DIASTOLIC FUNCTION6
Assessment of cardiac performance has traditionally focused on
systolic function. More recently however diastolic function has been found to
play an important role in cardiac morbidity and mortality. Diastolic function is
influenced importantly by ventricular structure and composition. However,
clinically, four phases of diastolic function need to be distinguished
1.isovolumetric relaxation 2.early rapid diastolic filling (E) 3.slow ventricular
filling (Diastasis) and 4. late atrial filling (A).
Diastolic function is influenced by several factors which include
1.myocardial relaxation 2.ventricular filling 3.elastic recoil 4.heart rate and
Specific indices used to evaluate diastolic dysfunction include:
1. IVRT (Intraventricular isovolumetric relaxation time):
This is the interval from the aortic valve closure to mitral valve opening.
Normal: 70-90millisecond
2. Peak mitral flow velocity
Peak mitral flow velocity of early rapid filling wave (E) and Peak
velocity of late filling wave (A) due to atrial contraction are expressed as E/A
ratio. Normal >1.
3. Deceleration time (DT):
This is the interval from the peak of the E velocity to extrapolation to
baseline. Normal <240ms.
4. Other indices include:
Pulmonary vein flow velocities, tricuspid flow velocities and hepatic vein
flow velocities and SVC flow velocities.
A E A I V R T I V C T Aortic Outflow
NORMAL DIASOLIC FILLING PATTERN
The rate of myocardial relaxation and compliance change with aging, so
that, different diastolic filling patterns are expected for different age groups.
Abnormalities of LV systolic function:
This is usually identified on echocardiograhic measurement of Ejection
Fraction. EF <55% denotes LV dysfunction.
Abnormalities of LV diastolic function: 6 1. Diastolic abnormalities:
Characterized by abnormal filling indices, they are commonly identified
on echo by prolonged IVRT, however, these patients have no clinical
symptoms. In this situation the ventricle is able to compensate for abnormal
diastolic function and to maintain a normal level of left ventricular filling
pressure. E
AT DT
2. Diastolic dysfunction:
Characterized by increased diastolic filling pressure which may be
responsible for the occurrence of dysnoea especially during exercise.
3. Diastolic heart failure:
Associated with clinical signs like PND and orthopnoea.
Echocardiographic classification of diastolic filling27
DT (msec) IVRT (msec) MITRAL E/A PVS2&PVd
Normal 160-240 70-90 1-2 PVS2≥PVd
Impaired
Relaxation
>240 >90 <1 PVS2>>PVd
Pseudo
normal
160-200 <90 1-1.5 PVS2<PVd
Restrictive
filling
<160 <90 >1.5 PVS2<<PVd
The clinical differentiation of the two forms of heart failure is of utmost
LEFT VENTRICULAR MASS
The role of LV mass estimation and diagnosis of LVH in cardiovascular
disease management is based on epidemiological research and clinical grounds.
In general, heart size increases during infancy and adolescence due to body size
enlargement, and at this stage, the gender difference becomes prominent. The
physiological factors8 that contribute to LV mass are:
1. Gender-women have increased parietal hypertrophy response to
pressure than men.
2. Ethnicity-some ethnic groups have higher LV mass(African
Americans)
3. Obesity
4. Age: LV mass progressively increases with age, particularly parietal
thickness. However, Dannenberg and coworkers demonstrated that LV mass
did not increase with age in a healthy sub-sample of the Framingham study,
suggesting that most of the supposed physiological increase is caused by other
determinants that include Hypertension, DM with metabolic syndrome, Alcohol
consumption, Increased salt intake, Smoking and Increased leisure time physical
activity in men, Blood lipid, Pulmonary function and Heart rate.
Echocardiographic measurement of LV mass is generally calculated
as the difference between the epicardium delimited volume and the LV chamber
imaging can be employed to calculate LV mass. Despite more than 30 years of
use Echocardiograph based LV mass calculation and definition are still variable
among Ultrasound technicians around the world. The Echocardiographic
criteria to calculate LV mass in this study was: 18
(RWT) (LVMI)g/m2
Normal <0.45 <131(men), <100(women)
Concentric
Remodeling >=0.45
<131(males), <100(females)
Concentric
Hypertrophy
>=0.45 >131(males), >100(Females)
Eccentric
Hypertrophy
DIABETES AND CARDIOVASCULAR DISEASE
Diabetes mellitus is an independent risk factor for cardiovascular disease
(CVD). In the FRAMINGHAM STUDY the risk of CVD for diabetic
subjects at baseline was two fold higher in men and three to four fold for
women after adjustment for other risk factors such as dyslipidemia and
hypertension. More recently NHANES1 study also showed that the diabetic
population was twice as likely to develop CAD as the nondiabetic population
with excess mortality .
The MRFIT STUDY shows that men with diabetes had an absolute risk
of death due to CAD more than three times than the nondiabetic cohort.
In the six nation OASIS study6, diabetic patients presenting with
unstable angina or Non Q MI had increased rate of stroke, CHF and death
during index hospitalization compared with the non-diabetic group.
In the Finnish contribution to WHO MONICA (World Health
Organization Multinational Monitoring of Trends and Determinants of
Cardiovascular Disease) project, the 1 year mortality was 38% higher for
diabetic men and 86% higher for women.
In view of the above, studies have been undertaken in recent times to
identify structural and functional abnormalities in normotensive diabetics who
have no cardiac symptoms. Most of the recent studies identified changes in LV
mass and LV systolic and diastolic function indices even before the patients are
The main factors that contribute to the increased incidence of cardiovascular disease in DM are: 1
1. The acceleration of atherosclerotic process leading to
macrovascular disease.
2. Development of specific cardiomyopathy
3. Progressive microvascular disease
4. Development of autonomic neuropathy
Noninvasive methods have confirmed that fibrosis is a key feature of the
heart of diabetic patients without evident cardiac disease. Increased level of
collagen in diabetics have been associated with changes in left ventricular
diastolic function.11 Chronic hyperglycemia leads to the formation of AGE’s
that modify the extracellular matrix, resulting in inelasticity of the vessel wall
and could interfere with myocardial function as well.6 These coupled with
abnormal myocardial calcium handling result in poor elastic recoil, leading to
impairment in early rapid diastolic filling(E) manifest by prolonged IVRT and
DT, and increased Mitral (A) velocity.
In the setting of insulin resistance, there is release of free fatty acids from
adipose tissue into the plasma. FFA becomes the dominant fuel for myocardial
energy in the form of free fatty acid oxidation within cardiac myocytes. In
glucose oxidation in these cells. Free fatty acid oxidation is a less efficient
means of generating adenosine triphosphate than glucose oxidation thus
contributing to chronic left ventricular dysfunction.
The impact of glucose intolerance and insulin resistance on cardiac
structure and function is as follows:
MATERIALS AND METHODS
All patients included in the study were taken from the Diabetology
department of Govt. Rajaji Hospital, Madurai.
This is a case control cross sectional study. The study period was from
August –2005 July 2006. The diagnosis of the cases was based on clinical
features and WHO criteria for DM. The total number of patients in the study
group were 60, this includes 28 males and 32 females. The study group was
further subdivided into three groups based on the duration of Diabetes.
GROUP I: 0-5YEARS
GROUP II: 6-10YEARS
GROUP III: >10YEARS
The control group was taken from the Outpatient Dept of Medicine and
Inpatients admitted for other ailments. This group was designated as GROUP
IV. Total number of controls was 40, which included 20 males and 20 females.
All cases and controls were within the age of 40-60 years. Both cases and
controls were examined and recruited in the study in the same time period. All
subjects gave informed consent for their participation in the study.
Inclusion criteria:
1. All cases of Type 2DM diagnosed by WHO criteria
2. Age: 40-60 years
3. BP: <130/85 (at least 3 recordings with the highest recording
Exclusion criteria were
1. Systemic Hypertension(BP>140/90)
2. Ishaemic heart disease(abnormal E.C.G. and RWMA on
Echo)
3. CHF
4. Congenital or Acquired Valvular Heart Disease
5. CRF
6. Age>60yrs
7. cardiac signs and symptoms(exertional dysnoea, chest pain,
palpitation, raised JVP)
8. PDR/NPDR and
9. Microalbuminuria.
Echocardiography:
Patients were evaluated by 2D and Doppler Echocardiography. All
examinations were performed using a ALOKA SSD 2000 machine 2.5Mhz
1.Ejection Fraction2.LV mass 3.Mitral Early filling velocity (E), Mitral
late atrial filling velocity (A),E/A was then derived 4.IVRT
and 5.DT.
Operators blinded to the diabetes diagnosis of the patients performed all
Echocardiographic measurements.
Computer Analysis of data was done using the software epidemiological
information package – 2002 developed by Centre for Disease Control and
Prevention, Atlanta in collaboration with WHO.
A. Comparison of Parameters in Diabetic Group (cases) and non diabetic group (Cantnoes)
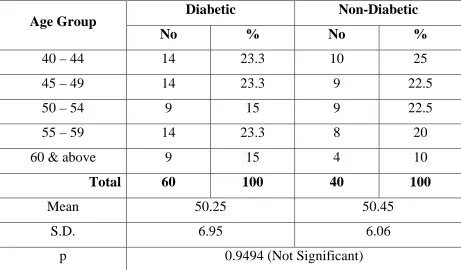
Table 1: AGE
Diabetic Non-Diabetic Age Group
No % No %
40 – 44 14 23.3 10 25
45 – 49 14 23.3 9 22.5
50 – 54 9 15 9 22.5
55 – 59 14 23.3 8 20
60 & above 9 15 4 10
Total 60 100 40 100
Mean 50.25 50.45
S.D. 6.95 6.06
Table 2: SEX
Diabetic Non-Diabetic Sex
No % No %
Male 28 46.7 20 50
Female 32 53.3 20 50
p 0.9024 (Not Significant)
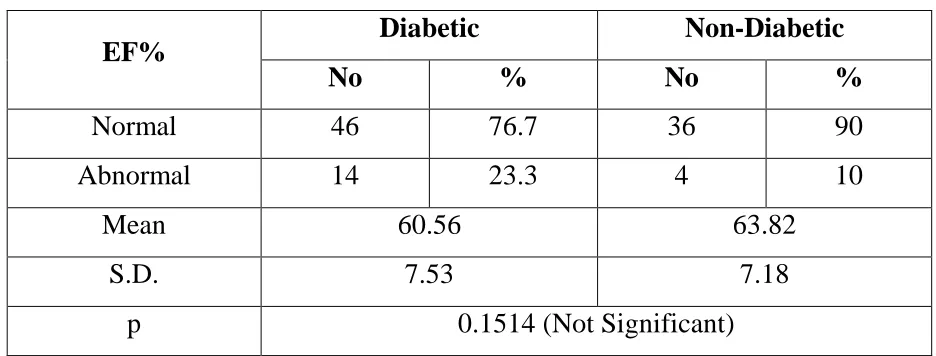
Table 3: EF %
Diabetic Non-Diabetic EF%
No % No %
Normal 46 76.7 36 90
Abnormal 14 23.3 4 10
Mean 60.56 63.82
S.D. 7.53 7.18
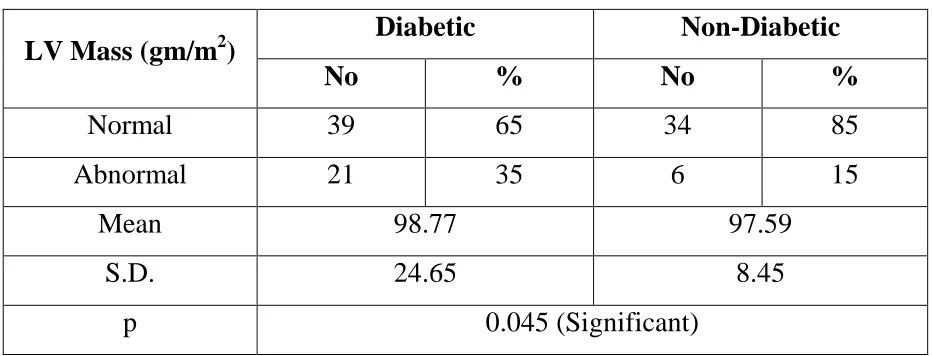
[image:39.595.63.531.400.578.2]Table 4: LV Mass (gm/m2)
Diabetic Non-Diabetic LV Mass (gm/m2)
No % No %
Normal 39 65 34 85
Abnormal 21 35 6 15
Mean 98.77 97.59
S.D. 24.65 8.45
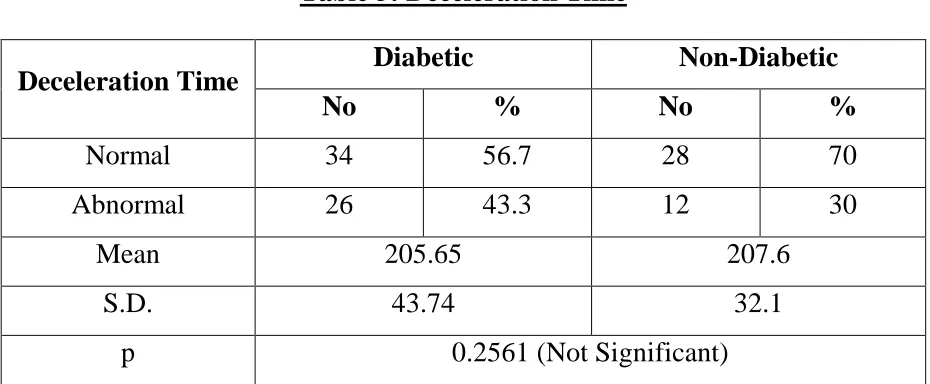
Table 5: Deceleration Time
Diabetic Non-Diabetic Deceleration Time
No % No %
Normal 34 56.7 28 70
Abnormal 26 43.3 12 30
Mean 205.65 207.6
S.D. 43.74 32.1
[image:41.595.65.534.280.616.2]p 0.2561 (Not Significant)
Table 6: IVRT
Diabetic Non-Diabetic IVRT
No % No %
Normal 21 35 22 55
Abnormal 39 65 18 45
Mean 101.65 93.2
S.D. 25.8 17.5
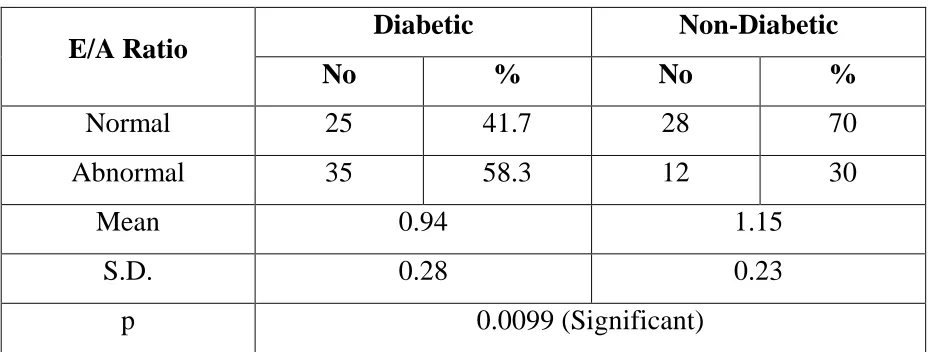
Table 7: E/A Ratio
Diabetic Non-Diabetic E/A Ratio
No % No %
Normal 25 41.7 28 70
Abnormal 35 58.3 12 30
Mean 0.94 1.15
S.D. 0.28 0.23
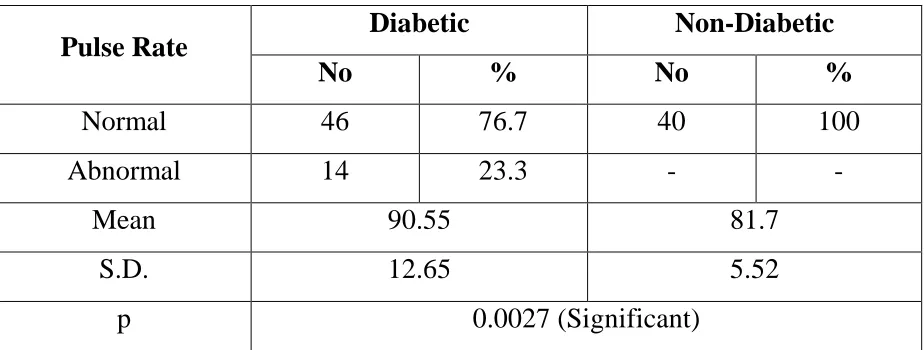
[image:42.595.66.531.310.486.2]Table 8: Pulse Rate per Minute
Diabetic Non-Diabetic Pulse Rate
No % No %
Normal 46 76.7 40 100
Abnormal 14 23.3 - -
Mean 90.55 81.7
S.D. 12.65 5.52
B. Comparison of Parameters within Diabetic Group according to duration of diabetics – I) 1 to 5 years II) 6-10 years III) More than 10 years
[image:44.595.66.531.142.473.2]
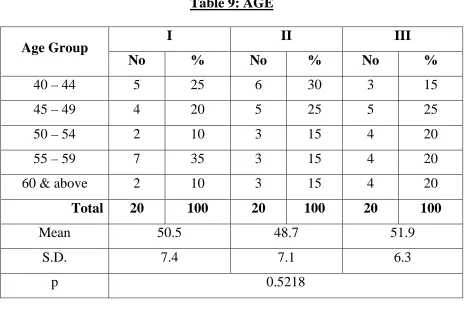
Table 9: AGE
I II III
Age Group
No % No % No %
40 – 44 5 25 6 30 3 15
45 – 49 4 20 5 25 5 25
50 – 54 2 10 3 15 4 20
55 – 59 7 35 3 15 4 20
60 & above 2 10 3 15 4 20
Total 20 100 20 100 20 100
Mean 50.5 48.7 51.9
S.D. 7.4 7.1 6.3
p 0.5218
Table 10: Sex and Duration if Diabetes
I II III
Sex
No % No % No %
Male 9 45 9 45 10 50
Female 11 55 11 55 10 50
‘p’ Value Between
I & II - 0.7506 (Not Significant)
I & III - 1.000 (Not Significant)
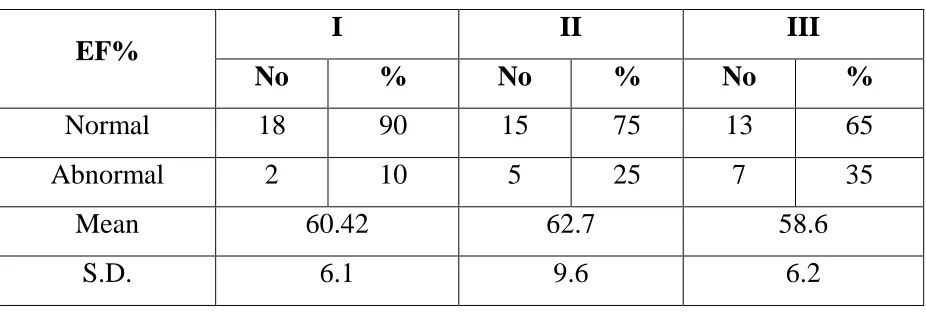
Table 11: EF% and duration of Diabetes
I II III
EF%
No % No % No %
Normal 18 90 15 75 13 65
Abnormal 2 10 5 25 7 35
Mean 60.42 62.7 58.6
S.D. 6.1 9.6 6.2
‘p’ Value Between
I & II - 0.2763 (Not Significant)
I & III - 0.0636 (Not Significant)
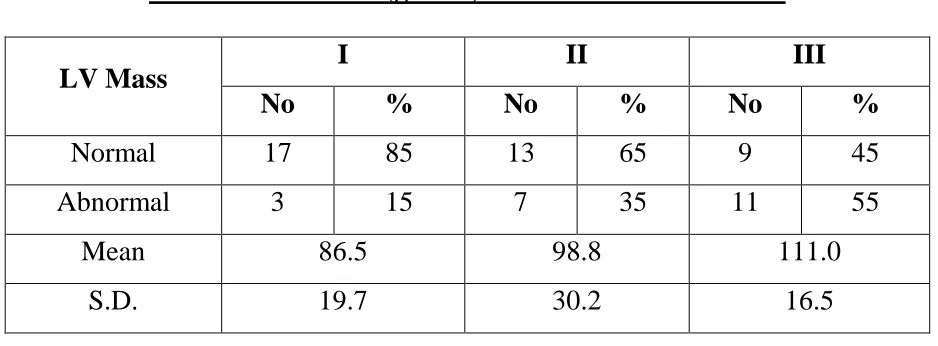
Table 12: LV Mass (gm/m2) and duration of Diabetes
I II III
LV Mass
No % No % No %
Normal 17 85 13 65 9 45
Abnormal 3 15 7 35 11 55
Mean 86.5 98.8 111.0
S.D. 19.7 30.2 16.5
‘p’ Value Between
I & II - 0.2733 (Not Significant)
I & III - 0.0203 (Significant)
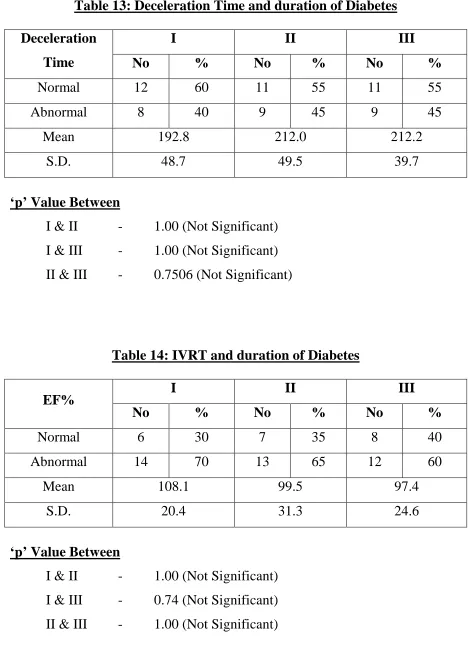
Table 13: Deceleration Time and duration of Diabetes
I II III
Deceleration
Time No % No % No %
Normal 12 60 11 55 11 55
Abnormal 8 40 9 45 9 45
Mean 192.8 212.0 212.2
S.D. 48.7 49.5 39.7
‘p’ Value Between
I & II - 1.00 (Not Significant)
I & III - 1.00 (Not Significant)
[image:47.595.64.534.96.279.2]II & III - 0.7506 (Not Significant)
Table 14: IVRT and duration of Diabetes
I II III
EF%
No % No % No %
Normal 6 30 7 35 8 40
Abnormal 14 70 13 65 12 60
Mean 108.1 99.5 97.4
S.D. 20.4 31.3 24.6
‘p’ Value Between
I & II - 1.00 (Not Significant)
I & III - 0.74 (Not Significant)
Table 15: E/A Ratio and duration of Diabetes
I II III
E/A Ratio
No % No % No %
Normal 10 50 8 40 7 35
Abnormal 10 50 12 60 13 65
Mean 1.0 0.94 0.88
S.D. 0.3 0.29 0.27
‘p’ Value Between
I & II - 0.7506 (Not Significant)
I & III - 0.5223 (Not Significant)
[image:48.595.61.531.112.426.2]II & III - 1.00 (Not Significant)
Table 16: Pulse Rate per minute and duration of Diabetes
I II III
Pulse Rate
No % No % No %
Normal 16 80 16 80 14 70
Abnormal 4 20 4 20 6 30
Mean 88.2 89.4 94.1
S.D. 12.1 13.2 12.4
‘p’ Value Between
I & II - 0.6526 (Not Significant)
I & III - 0.715 (Not Significant)
[image:48.595.67.529.126.275.2]C. Comparison of parameters within the study group(diabetics) according to Sex
Table 17: Relationship between sex and LV mass
Male Female
LV Mass
No % No %
Normal 24 85.7 15 46.9
Abnormal 4 14.3 17 53.1
Mean 97.88 99.54
S.D. 26 23.79
Table 18: Relationship between sex and E/A ratio
Male Female
E/A
No % No %
Normal 13 46.4 12 37.5
Abnormal 15 53.6 20 62.5
Mean 0.948 0.9365
S.D. 0.303 0.272
p 0.6618 (Not Significant)
Table19: Relationship between sex and pulse rate
Male Female Pulse Rate
No % No %
Normal 25 89.3 21 65.6
Abnormal 3 10.7 11 34.4
Mean 85.5 95.0
S.D. 11.76 11.88
STATISTICAL ANALYSES
This study was a cross sectional case control study conducted in 60 cases
of Type2 DM who satisfied inclusion criteria and 40 age and sex matched
controls. The mean age of cases was 50.25 years and controls 50.45years.
Of the 60 cases 28(46%) were males and 32(53.3%) were females. Of the 40
controls, 20 were males and 20 were females.
The cases were divided into three groups based on the duration of
diabetes. Group I comprising those with diabetes of 0-5 yr duration while
Groups II and III comprising those with duration of 5-10yrs and >10yrs
respectively. The number of cases in each group was 20.
The mean age of Group I patients was 50.5yrs. Of the 20 patients in the
Group,9 were males and 11 were females.
The mean age of Group II patients was 48.7yrs. Of the 20 patients in the
Group, 9 were males and 11 were females.
The mean age of Group III patients was 51.7yrs. Of the 20 patients in the
group, 10 were males and 10 were females.
In this study, regarding EF <55% considered to be systolic dysfunction.
E/A ratio <1, IVRT >90msec and DT >240msec taken as an abnormal diastolic
dysfunction.
Regarding LV Mass male >131gm/m2 and female >101gm/m2 taken as an
Observations of EF revealed that abnormalities were present in 10% of
Group I, 25% of Group II and 35% of Group III while only 10% of the control
group(Group IV) showed abnormalities.
Observations of LV mass revealed that abnormalities were present in
15% of Group I, 35% of Group II and 55% of Group III while only 15% of the
control group(Group IV) showed abnormalities.
Observations of DT revealed that abnormalities were present in 40% of
Group I, 45% of Group II and 45% of Group III while 30% of the control group
(Group IV) showed abnormalities.
Observations of IVRT revealed that abnormalities were present in 75% of
Group I, 65% of Group II and 60% of Group III while 45% of the control group
(Group IV) showed abnormalities.
Analysis of E/A ratios revealed that abnormalities were present in 50% of
Group I, 60% of Group II and 65% of Group III. 30% of GroupIV (controls)
also revealed abnormalities.
It was observed that a resting pulse rate >100 was observed in 20% of
Group I and II and 30% of Group III cases while the pulse rate was within the
DISCUSSION
In the study, it was observed that 35% of diabetics (cases) and 15% of
non-diabetics (controls) had increased LV mass, (‘p’ < 0.045) which is
statistically significant. This is in conformity with other studies as shown below.
Studies by Hirayama et al 13 observed the increased incidence of LV
mass among diabetics (normotensive and asymptomatic) than non-di abetics.
Dawson et al11 observed that the prevalence of LVmass abnormalities was 71%
among diabetics compared to 35% in our study, this may be due to non
exclusion of hypertensives in the study. Nielsen et al16 observed that increased
LV mass was found in 51% of diabetics.
Intragroup analyses of cases revealed that Increased LV mass was seen
in 15% of Group I, 35% of Group II and 55% of Group III. There was
statistically significant association between Group I and Group III (P < .0203).
This indicates that the development of increased LV mass is dependent on the
duration of Diabetes.
With regard to EF, 23.3% of diabetics and 10% of non diabetics had
in conformance with other studies Hiroyoshima et al, Siwach et al4, Saner et al19. However studies by Annonu et al14 observed that diabetics had low EF, however the study group included the presence of complications of diabetes
which were excluded in our study. Further Oirko et al15 also observed low EF
in diabetics. Thus studies regarding EF abnormalities in DM have observed
varying results which need to be further investigated.
Observations of IVRT revealed that 65% of cases and 45% of controls
show abnormalities. However this was not statistically significant.( (p<0.0762)
Observations of DT revealed that 43.3% of cases and 30% of controls
show abnormalities which was found to be statistically significant.(p <0.2561)
Observations of E/A ratio revealed that 58.3% of cases (diabetics) and
30% of controls showed abnormalities, which was found to be statistically
significant. (p<0.0099).
The observations on IVRT,DT and E/A ratio are in conformance with the
study by Siwach et al. wherein 68% of diabetics had E/A <1 compared to
58.3% in our study Most other studies performed to analyse diastolic function
abnormalities have taken into account E/A ratio as the single parameter of
diastolic function. Spiro Qirko et al, and Elizi et al12 observed values of E/A<1
relation to the controls. This infers that E/A ratio abnormality is an indicator of
diastolic dysfunction in diabetics. However the reason for the statistically
insignificant values of DT and IVRT abnormalities in diabetics are not known.
Diastolic function abnormalities occur early in the course of disease. This is
evident by the comparison of E/A ratios in Group I and Group III. Which
shows 50% of Group I and 65% of Group III had E/A<1 that was statistically
insignificant. (p<0.5223).Bonitio et al20 and Spiro Qirko et al also observed
the same in their studies.
Interestingly, observations of our study revealed increased resting pulse
rate in diabetics that was subject to statistical analysis. It was observed that
23.3% of cases (diabetics) and none of controls had increased resting pulse rate
which was statistically significant.(p<0.0027). This was earlier documented by
studies by Atheros et al17 and Saner et al. The increase in resting pulse rate is
probably due to diabetic autonomic neuropathy that was not excluded in our
study.
Further observations of LV mass between males and females revealed
that 14.3% of diabetic males and 53.1% of diabetic females had increased LV
mass which was statistically significant. (p,0.004). This reflects the increased
(four fold) cardiovascular mortality in diabetic females compared to males (two
The occurrence of structural and functional abnormalities in Type 2 DM
as observed in our study clearly state the importance of Echocardiographic
assessment(screening) of all Type 2 DM patients even in the absence of cardiac
LIMITATIONS
1. The study was restricted to hospital patients, so its relevance to the
general population is unknown.
2. Patients with DM usually have silent ischemia and this factor was not
taken into account in the study.
3. The study is subject to measurement error, subject error and instrument
error, though carefully designed.
4. Ambulatory BP could not be done this may affect the study group to some
extent.
5. Smoking, obesity and dyslipidemia were not excluded from the study
group, this may have some influence on LV mass 9.
SUMMARY
Echocardiographic assessment of diabetic non-diabetic group revealed the following findings:
1. In diabetic, systolic function not significantly affected when compare to
non-diabetic.
2. Diabetic have increase LV Mass than non-diabetic.
3. In diabetes, females have increase LV Mass than male.
4. The development of LV Mass in diabetic depend upon the duration of
illness.
5. IVRT, DT not significantly affected in diabetic when compare to diabetic.
6. E/A ratio significantly affected between diabetic & non-diabetic.
7. In diabetes, IVRT, DT & E/A ratio not significantly affected according to
the duration of illness.
CONCLUSIONS
Echocardiographic observation of Type 2 DM patients who are
normotensive and have no cardiac symptoms revealed:
Increased LV mass compared to controls, that is well correlated
with the duration of diabetes and with a female preponderance
LV diastolic dysfunction compared to controls, which does not
correlate with the duration of diabetes mellitus, reflecting the
occurrence of dysfunction early in the course of disease.
LV systolic function analyzed through EF is not significantly
BIBLIOGRAPHY
1. A.P.I. Textbook of Medicine,6th edition.
2. Plouin IF. The importance of Diabetes as a Cardiovasuclar risk factor.Int
J.Clinic Pract.Suppl 2000(110):3-8.
3. Harrisons Principles of Internal Medicine,16th edition.
4. JIACM 2002;3(2):164-8 Echocardiographic Doppler assessment of cardiac
function in patients of Type 2 DM
5. Ethn Dis 2005. Autumn;15(4)635-40, LV dysfunction in Type 2 DM
without Cardiac symptoms.
6. Braunwald’s Heart Disease A Text Book of Cardiovascular Medicine,7th
edition.
7. Hurst Volume2,10th edition;2019
8. Joslins Diabetes Mellitus,14th edition 989
9. Echocardiographic based LV mass estimation, Murilo Foppa et al.
Cardiovascular Ultrasound 2005,3:17
10. LV function in Type 2 DM in patients without Cardiac symptoms in Zaria,
David SO et al.
11. Epidemiology of LVH in Type 2 DM, Dawson A et al. Diabetolgia 2005
Oct;48(10)
12. Reduced LV diastolic function in asymptomatic patients with Type 2 DM,
13. Determination of LVmass by echocardiography in normotensive Diabetic
patients. Hirayama et al. PMID11194283
14. LV systolic and diastolic functional abnormalities in asymptomatic patients
with Type 2 DM, Annonu AK et al.PMID 11547274
15. Type 2 DM as an independent predictor of asymptomatic LV diastolic
dysfunction, Spiro Qirko et al, Clinical Science 2005;46(2)225-231
16. LVH in Type 2 DM patients with and without Diabetic nephropathy,
Nielsen et al. PMID 11547254
17. LV systolic and diastolic function in normotensive Type1 diabetic patients
with or without autonomic neuropathy, Athyros et al. PMID12832295
18. Feigenbaumis manual of Echocardiography.6th edition,149
19. Saner H et al. No evidence for systolic and diastolic dysfunction in selected
patients with long term Type 1 DM, PMID 10937927
20. Di Bonito et al. Diastolic dysfunction in patients with Type 2DM of short
duration.
21. Poirier et al. Diastolic dysfunction in normotensive men with well
controlled Type 2 DM.
22. Anderson et al. Prevalence of dysfunction in normotensive men with well
controlled Type 2 DM.AMJ. Cardiol.2001:87;320-323
23. Vanninen et al. A study of diastolic dysfunction in Type 2 DM
24. Sampson et al. Association between LVH and erythrocyte sodium lithium
exchange in normotensive subjects with and without Type 2 DM,
Diabetolgia 1995; 38;454-460
26. Ohya et al. Hyperinsulinemia and LV geometry in worksite population in
Japan.Hypertension 1996;27;729-734
27. The Echo manual JAE. K.OH., 2nd Edition
28. Nielsen FS, et al; Beneficial impact of ramipril on left ventricular
hypertrophy in normotensive nonalbuminuric Type2 DM patients. Diabetes
Care 1998; 21; 804-809
29. DeMaria, et al; Doppler echocardiographic evaluation of diastiolic
dysfunction. Cliculation.1991; 84(3 Suppl); 1288-95
30. Williams et al; Fasting insulin and left ventricular mass in hypertensives
TARGET ORGAN ABNORMALITIES IN TYPE 2 DIABETES MELLITUS
Name : Sl. No :
Age : IP.No :
Sex : OP.No :
Duration of Diabetes:
Complaints
General Examination
Investigations
Giddiness
Pallor
Urine Albumin
Palpitation
Jaundice
Hb
Breathlessness
Cyanosis
ESR
Chest discomfort
Clubbing
Blood Sugar
Headache
LNE
Urea
Vertigo
Pedal oedema
Sr. Creatinine
Weakness
Pulse rate /min
Sr. Cholesterol
Dec. in work
performance
Peripheral pulse
ECG
Swelling of Legs
BP Rt UL -mmHg
HR
Bleeding Nose
Lt UL -mmHg
PR
Seizures
Rt LL -mmHg
QRS QT
Sexual
Dysfunction
CVS
AXIS
Others
Apical Impulse
ST- T Segment
JVP
Q Waves
Personal History
Precardium Pulsations
Smoker
Epiugatric Pulsations
Alcholic
S1
Thyroid
S2
Family History
Added sounds
DM
Murmur
HT
RS
CAD
Breath Sounds
Past History
Added Sounds
DM
Abdomen
TIA
ECHO CARDIOGRAPHY DIASTOLIC FUNCTION INDICES
IVRT Mitral E m/s A m/s E/A
Tricuspid E m/s A m/s E/A
Deceleration Time (DT)
SYSTOLIC FUNCTION INDICES
IVS d LVPW d LVID d
IVS s LVPW s LVID s
EF % LV Mass
Valves
Mitral Tricuspid
Aortic
RETINOPATHY
MICROALBUMINURIA
CT SCAN
MASTER CHART