A DISSERTATION ON
NEURO DEVELOPMENTAL OUTCOME OF
NEW BORNS WITH HYPOXIC ISCHEMIC
ENCEPHALOPATHY
MD BRANCH ( VII )
PEDIATRIC MEDICINE
THE TAMILNADU
DR.M.G.R. MEDICAL UNIVERSITY
CERTIFICATE
This is to certify that this dissertation entitled “NEURO
DEVELOPMENTAL OUTCOME OF NEW BORNS WITH
HYPOXIC ISCHEMIC ENCEPHALOPATHY” submitted by
DR.K. SATHISHKUMAR to the faculty of Pediatrics, The
Tamil Nadu Dr. M.G.R. Medical University, Chennai, in
partial fulfillment of the requirement of the award of M.D.
Degree Branch VII (Pediatric Medicine) is a bonafide research
work carried out by him under our direct supervision and
guidance.
DR. N. RAGHAVAN, M.D. D.C.H.,
PROFESSOR & H.O.D.
INSTITUTE OF CHILD HEALTH & RESEARCH CENTRE,
GOVT. RAJAJI HOSPITAL &
MADURAI MEDICAL COLLEGE
DECLARATION
I, Dr. K. SATHISHKUMAR solemnly declare that the dissertation
titled
“NEURO DEVELOPMENTAL OUTCOME OF NEWBORNS
WITH HYPOXIC ISCHEMIC ENCEPHALOPATHY”
has been
prepared by me.
This is submitted to The Tamil Nadu Dr. M.G.R. Medical
University, Chennai, in partial fulfillment of the requirement for the
award of M.D., degree Examination (Pediatric Medicine) to be held
in FEBRUARY 2006.
Place : Madurai
ACKNOWLEDGEMENT
It is with immense pleasure and privilege that I express my
heartful gratitude, admiration and sincere thanks to
Prof. Dr. N.
RAGHAVAN
, Professor and Head, INSTITUTE OF CHILD
HEALTH and RESEARCH CENTRE , Government Rajaji Hospital,
Madurai Medical College, Madurai for his constant encouragement
and support while undertaking this study.
I am extremely grateful to
PROF. Dr. P.
AMUTHARAJESWARI
Additional Professor of Pediatrics, ICH
and RC, Government Rajaji Hospital, Madurai for her supervision,
help and constant guidance during this study.
I express my sincere thanks and gratitude to
PROF.
DR.M.L.VASANTHAKUMARI, PROF. DR. D.MEIKANDAN
AND PROF. DR. G. KRISHNAN
for their kind support and
I
thank
the
DEAN,
Madurai Medical College, Madurai for
permitting me to utilize the hospital materials for conducting this
study.
I wish to express my sincere thanks to my Assistant
Professors,
DR.G. MATHEVAN, DR. S. SAMBATH, DR.
M.NAGENDRAN,
DR.
S. SHANMUGA SUNDARAM, DR. S.
BALASANKAR
and other assistant professors for their valuable
suggestions and support.
It is my pleasure to thank all my fellow Post-Graduates for
their assistance.
I thank all the Parents and Children who have ungrudgingly
lent themselves to undergo this study without whom this study
would not have seen the light of the day.
Finally, I thank my God and family members who have always
CONTENTS
S.No. Contents
Page
No.
1.
INTRODUCTION
1
2.
BIRTH ASPHYXIA & HIE
3
3.
LITERATURE
REVIEW
24
4.
AIMS &
OBJECTIVES 30
5.
METHODOLOGY
31
6.
OBSERVATION & ANALYSIS
35
7.
DISCUSSION
62
8.
CONCLUSION
69
9.
BIBLIOGRAPHY
INTRODUCTION
Perinatal (Birth) Asphyxia describes a lack of oxygen, blood flow and gas exchange to fetus / new born. Hypoxic Ischemic encephalopathy is an important consequence of perinatal hypoxia.
Birth asphyxia and Hypoxic ischemic encephalopathy(HIE) are associated with increased risk of mortality & morbidity. Mortality in a full term asphyxiated newborn is about 10-20%.
Early neonatal deaths are an important cause of the high infant mortality. Apart from Low Birth Weight & Neonatal infections asphyxia contributes a significant proportion of the mortality in early neonatal period.
BIRTH ASPHYXIA & HIE
Asphyxia refers to a combination of hypoxia, hypercarbia and metabolic acidosis.
Definition :
American Academy of Pediatrics defines Perinatal Asphyxia as an insult to fetus or newborn due to a lack of oxygen (hypoxia) and or a lack of perfusion (ischemia) to various organs of sufficient magnitude & duration to produce more than fleeting functional and / or biochemical changes.
Substantial & prolonged intrauterine Asphyxia is said to be present if a) Documented Apgar score of 0-3 at 5 min
b) Cord Umbilical artery pH of < 7.0 and a base deficit of > 12
National Neonatology forum of India :
NNF suggested that birth asphyxia should be diagnosed when
APGAR SCORE
Sign 0 1 2
Heart rate Absent Slow< 100 bpm > 100 bpm
Respiration Absent Slow, irregular Good, crying
Muscle tone Limp Some flexion Active motion Reflex irritability
(catheter in nares, tactile stimulation)
No response Grimace Cough, sneeze, cry
Color Blue or pale Pink body, blue extremities
Completely pink
Low Apgar scores may be present in non asphyxiated infants also. Despite limitations, Apgar scoring is conventionally used to assess condition of newborn at 1 min after birth.
Incidence of perinatal asphyxia :
The incidence of perinatal asphyxia is about 1 to 1.5% of live births and is inversely related to gestational age and birth weight.
Pathophysiology :
During normal labour, uterine contractions, cord compression, increased O2 consumption by mother & fetus, maternal dehydration & alkalosis cause most babies to be born with little O2 reserve.
In addition to the above normal factors any process that 1. impairs maternal oxygenation
2. decreases blood flow from mother to fetus
3. impairs gas exchange across placenta / in the fetus and
4. increase fetal O2 requirement will increase risk of perinatal asphyxia In the presence of hypoxic ischemic challenge to fetus compensatory reflexes are initiated causing shunting of blood to brain, heart and adrenals (diving reflex)
Target organs of perinatal asphyxia are brain, heart, lungs, kidney, liver, bowel and bone marrow.
HYPOXIC ISCHEMIC ENCEPHALOPATHY
HIE is the most important consequence of perinatal asphyxia. Neonatal encephalopathy is defined as a state of altered level of consciouness without etiological implications.
It should be emphasised that HIE is first one out of a number of etiologies in the differential diagnosis of neurological depression in neonate.
Asphyxia may be suspected and HIE reasonably included in differential diagnosis of neonatal depression / neurologic dysfunction if the following have been documented.
1. 5 to 10 min Apgar score < 3
2. Neonatal seizures within first 24 – 48 hrs
3. Need for positive pressure resuscitation for more than 1 min or more than 5 min until first cry
4. Burst suppression patterns on EEG 5. Prolonged fetal acidosis
Pathophysiology:
Brain hypoxia & ischemia from systemic hypoxemia and reduced cerebral blood flow are primary triggers of HIE. Initially compensatory increase in Cerebral Blood Flow occurs.
With prolonged asphyxia Cerebral Blood Flow becomes pressure passive. As BP falls , brain hypoxia occurs leading to decrease in glycogen & ATP. There is a concomitant increase in lactate & fall in PH.
Reperfusion injury is a second determinant of extent of brain damage. By 6-24 hrs after initial injury, a new phase characterized by apoptosis occurs. This phase may continue for days to week.
Biochemical changes :
Both hypoxia & ischemia increase the release of excitotoxic aminoacids like glutamate. ExcitotoxicAminoacids through action at inotropic glutamate receptors (NMDA) open ion channels allowing Ca2+ and Na+ to enter cell inducing immediate neuronal death from osmolar load.
Further these excitotoxins by direct activation of NMDA channel provoke excessive Ca2+ influx. This in turn leads to a delayed neuronal death by
1. Activation of undesirable second messenger system. (lipases and proteases)
2. Pertubation of mitochondrial respiratory electron chain transport 3. Generation of free radicals & leukotrienes
4. Generation of Nitric oxide
Pathological Lesions :
¾ Parasagittal cerebral necrosis : This lesion is bilateral, usually
symmetrical, and occurs in the cerebral cortex and subcortical white matter, especially in the parietooccipital region. These regions represent the border zones of perfusion from major cerebral arteries.
¾ Status marmoratus : In this lesion, the basal ganglia, especially the
caudate nucleus, putamen, and thalamus, demonstrate neuronal loss, gliosis, and hypermyelination, leading to a marble white discoloration of these regions. This is the least common type of neuropathology, and its full evolution may take months to years.
¾ Focal and multifocal ischemic brain necrosis : These lesions are
relatively large, localized areas of necrosis of cerebral parenchyma, cortex, and subcortical white matter. The most frequently affected region is the zone perfused by the middle cerebral artery.
¾ Periventricular leukomalacia : This lesion is characterized by
Clinical Manifestations of HIE :
The spectrum of HIE ranges from mild to severe. The initial phase lasts for about 12 hrs after the insult & consists of signs of cerebral dysfunction. Clinical manifestations and course vary depending on HIE severity.
* Mild HIE
¾ Muscle tone may be increased slightly and deep tendon reflexes may be brisk during the first 24 hrs.
¾ Transient behavioural abnormalities, such as poor feeding, irritability or excessive crying or sleepiness, may be observed.
¾ By 1-2 days of life, the CNS examination findings become normal
* Moderately severe HIE
¾ The infant is lethargic, with significant hypotonia and diminished deep tendon reflexes.
¾ The grasping, Moro, and sucking reflexes may be sluggish or absent.
¾ The infant may experience occasional periods of apnea
¾ Full recovery within 1-2 weeks is possible and is associated with a better long term outcome.
¾ An initial period of well-being may be followed by sudden deterioration, suggesting reperfusion injury; during this period, seizure intensity might increase.
* Severe HIE
¾ Stupor or coma is typical. The infant may not respond to any physical stimulus.
¾ Breathing may be irregular, and the infant often requires ventilatory support.
¾ Generalised hypotonia and depressed deep tendon reflexes are common.
¾ Neonatal reflexes (eg. Sucking, swallowing, grasping, Moro) are absent.
¾ Disturbances of ocular motion, such as skew deviation of the eyes, nystagmus, bobbing, and loss of “doll’s eye” (ie, conjugate) movements may be revealed by cranial nerve examination.
¾ Pupils may be dilated, fixed, or poorly reactive to light
correlating with the phase of reperfusion injury. As the injury progresses, seizures subside and the EEG becomes isoelectric or shows a burst suppression pattern. At that time, wakefulness may deteriorate further, and the fontanelle may bulge, suggesting increasing cerebral edema.
¾ Irregularities of heart rate and BP are common during the period of reperfusion injury, as is death from cardio respiratory failure.
* Infants who survive severe HIE
¾ The level of alterness improves by days 4-5 of life
¾ Hypotonia and feeding difficulties persist, requiring tube feeding for weeks to months.
* Involvement of multiple organs besides the brain is a hall mark of HIE
¾ Severely depressed respiratory and cardiac functions and signs of brainstem compression suggest a life- threatening rupture of the vein of Galen (ie. Great cerebral vein) with a hematoma in the posterior cranial fossa.
¾ Reduced myocardial contractility, severe hypotension, passive cardiac dilatation, and tricuspid regurgitation are noted frequently in severe HIE
high output tubular failure, leading to significant water and electrolyte imbalances.
¾ Intestinal injuries may not be apparent in the first few days of life. Poor peristalsis and delayed gastric emptying are common; necrotizing enterocolitis occurs rarely.
Sarnat and Sarnat’s Clinical stages of Hypoxic Ischemic
Encephalopathy
Stage 1 Stage 2 Stage 3
Level of consciousness
Hyperalert Lethargic or obtunded
Stuporous
Neuromuscular control
Muscle tone Normal Mild hypotonia Flaccid
Posture Mild distal
flexion
Strong distal flexion Intermittent decerebration
Stretch reflexes Overactive Overactive Decreased or absent Segmental myoclonus Present Present Absent
Complex Reflexes
Suck Weak Weak or absent Absent
Moro Strong; low
threshold
Weak; incomplete; high threshold
Absent
Oculovestibular Normal Overactive Weak or absent
Tonic neck Slight Strong Absent
Autonomic Function Generalised sympathetic
Generalised parasympathetic
Both systems depressed
Pupils Mydriasis Miosis Variable; often
unequal; poor light reflex
Heart Rate Tachycardia Bradycardia Variable Bronchial and
Salivary secretions
Sparse Profuse Variable
Gastrointestinal Motility
Normal or decreased
Seizures None Common ; focal or multifocal Uncommon (excluding decerebration) Electroencephalogram Findings Normal (awake)
Early : low – voltage continuous delta and theta Later : periodic pattern (awake) Seizures : focal spike and wave.
Early : periodic pattern with Isopotential phases
Later : Totally isopotential
Duration < 24 hrs 2-14 days Hours to weeks
LAB TESTS
1. Serum creatine kinase brain fraction CKBB at 4 and 10 hours of life >
15 IU was found to be associated with mortality or neurological sequelae.
2. CKBB together with protein S – 100 ( > 8.5 µg/l) & decreased cord blood PH is found to have high specificity & sensitivity in predicting moderate to severe encephalopathy
EEG :
1. Generalised depression of background rythm & voltage are early findings.
2. Burst suppression pattern is particularly ominous.
Cranial Ultrasound :
It provides quick assessment of brain lesions. It reveals hemorrhages & periventricular changes and less well the extent of edema.
CT Scan :
It is more useful in assessing the degree of edema when performed early (2-4 days). CT may not be useful in predicting sequelae in premature infants because of excess water & lower myelin content.
It is useful in demonstrating focal ischemic lesion.
MRI :
Prognosis of perinatal asphyxia :
Birth Asphyxia severe enough to damage the fetal brain irreversibly usually kills before / soon after birth (one fourth of cases). The remainder however even those with seizures will be overwhelmingly normal.
Outcome :
1. Overall full term asphyxiated infants have a mortality of 10 to 20% . The incidence of neurologic sequelae in survivors is 20 to 45 %. Approximately 40% of these are mild and 60% are severe
2. Analyzed according to Sarnat’s stages of severity virtually 100% of newborns with stage 1 have normal neurologic outcome 80% of those with stage 2 are normal neurologically & virtually all children with stage 3 either die ( one half) or develop major neurologic sequelae ( Cerebral palsy, epilepsy, mental retardation)
Indicators of Poor Outcome :
Unfavourable signs :
1. Severe prolonged asphyxia 2. Sarnat stage 3 encephalopathy
3. Seizures of early onset ( < 12 hrs) and that which are difficult to control. 4. Elevated Intracranial pressure
5. Persistence of abnormal neurologic signs at discharge ( > 1-2 wks) 6. MRI showing abnormal signal intensities
7. Elevated CKBB level
8. Persistant oliguria for first 36 hrs of life
9. Interictal background abnormalities in EEG (Burst suppression, isoelectric potential)
10.Intraventricular hemorrhage grade II or more in Ultrasound cranium 11. Ischemia & infarction over parasagittal area
Neurologic Sequelae :
The precise neurologic sequelae following asphyxia will reflect location, identity & extent of neuronal damage. Cerebral palsy of various types, Epilepsy, Auditory & visual impairment are major sequelae. Minor motor difficulties, ADHD, language & learning difficulties also occur.
DEVELOPMENTAL ASSESSMENT:
The importance of early diagnosis and treatment of children with developmental de-lay has emerged in recent years as a matter of growing concern . Early identification of children with delayed development has important implications for their treatment and in preventing risks of future disabilities and secondary problems related to family dysfunction, peer difficulties, and school failure.
Developmental screening is a brief testing procedure designed to identify children who should be subjected for intensive diagnostic assessment. Screening refers to the detection of unsuspected deviations from normal development that would not otherwise be identified in routine pediatric practice. The goal of screening is to identify, as early as possible, developmental disabilities in children at high risk so that a treatment or remediation can be initiated at an early age when it is most effective.
The three approaches to screening include informal, routine and focussed developmental screening.
I. Informal screening is based on observing the child during a routine
Such an approach is not a very sensitive way of screening as it is only useful for not missing major delays.
Guidelines for Screening :
1. Screening instruments should be a. Reliable and valid
b. Culturally relevant
c. Used only for their specified purpose
2. Multiple sources of information should be used.
3. Developmental screening should be done only by trained personnel. 4. Screening should be on a recurrent and periodic basis.
5. Family members should be part of the screening process.
II. Routine formal screening entails systematic developmental screening
III. Focussed screening involves developmetal screening of the following groups of children.
a) Children whose parents express developmental concerns or in whom teachers and physicians suspect problems.
b) Newborns with condition that have known to have high risk for developmental delay. ex. Hypoxic ischemic encephalopathy.
Developmental Screening Tests :
Several developmental screening tests are available for use in infants and children. There are several well accepted criteria by which various tests are judged to be appropriate for use in screening programs. It is recommended that screening test should be simple, brief, convenient to use, cover all areas of development, have adequate construct validity be applicable to a wide age range, and have referral criteria that are both specific and sensitive.
Trivandrum Developmental Screening Chart (TDSC)
Commonly used revised DDST has 125 items and takes about 20-30 min to perform by a trained individual.
TDSC is a modification of Baroda scale & it contains about 17 items. These items include testing the gross motor, fine motor, social & adaptive and language skills of the child. Tests for vision & hearing are also included in it. They include tests to assess whether child holds head steady, rolls from back to stomach, raises self to sitting position, stands up by furniture, walk with help, walks alone, walk backwards, walk upstairs with help, social smile, pat a cake, throws ball, points to parts of doll (3 parts), transfer objects hand to hand, fine prehension pellet, says two words, eyes follow pen / pencil, turns head to sound of bell/ rattle etc appropriate to the age.
Following elicitation of history from the mother assessment is done using TDSC. A line is a drawn over the corresponding vertical age line in the chart appropriate to the child’s age. The left hand side of each horizontal dark line represents age at which 3% of children passed the items & right end represents 97%.
A child who has not achieved one or more skills completely to the left of the age line is suspected to have developmental delay. Repeat testing may have to be done a few days later.
TDSC can be used for children from 0-24 months. It contains only 17 items & is not time consuming (5-7 mins) and can be used in busy office practices. It can be used by paraprofessionals also as it is simple to perform. It is only a screening test. Any delay has to be confirmed by proper & complete neurodevelopmental assessement.
CDC Grading of Motor Milestones
Head Holding : Completed 4 months
Grade0 - No head holding at all
I - Head erect & steady momentarily
II - Dorsal suspension – lifts head along with body III - prone position - elevates on arms, lifting chest IV - Holds head steady while mother moves around V - Head balanced at all times
Sitting : Completed 8 months
Grade0 - Not sitting I - Sits momentarily
III - Sits with back straight
IV - while sitting can turn around & manipulate a toy V - self rises to sit
Standing : Completed 12 months
0 - Not able to stand
I - holding furniture momentarily II - takes few steps with both hands held
III - stands without support, stands alone with legs apart IV - stands himself up
V - Stands without support to take a few steps.
Assessment :
LITERATURE REVIEW
1. Figueras – Aloy J et al, the study conducted to find out the incidence of neurodevelopmental delay showed about 11.2 % of babies with hypoxic ischemic encephalopathy were found to have neurological impairment.
2. Birth Asphyxia – Incidence, clinical course and outcome in a Swedish population. Acta. Pediatrics, 1995,
Neurological abnormality of 10% was observed among the 65 babies who had HIE.
3. Robertson et al in 1993. The outcome in mild and severe form of HIE is predictable but in moderate form, it is uncertain. However the babies had variable degree of deficit.
4. Freeman J.M.et al., 25% of the babies with HIE were found to be neurologically abnormal on follow up.
6. Ellis M. et al., Outcome at 1 year of neonatal encephalopathy in Kathmandu, Nepal. By 1 year ofage,45 (44%) of the infants with Neonatal encephalopathy had died, 18 (18%) had severe impairments and two(2%) had minor impairments. Of the 18 children with major impairment, 14(78%) had spastic tetraplegic cerebral palsy and eight (44%) had multiple impairments.
7. Glenny Dixon et al, Early developmental outcomes after newborn encephalopathy. Overall 39% of patients had a poor outcome as defined by death, cerebral palsy, or a significant degree of developmental delay. 62% of those with severe encephalopathy had a poor outcome compared with 25% of those with moderate encephalopathy. Patients with a history of seizures were 3 times more likely to develop cerebral palsy than patients without. Overall, 28 (10.1%) of patients had cerebral palsy.
8. Funayama CA et al, Hypoxic – ischemic encephalopathy in new born infants. Acute period and outcome.
9. Asakura H. et al, Perinatal risk factors related to neurologic outcomes of term new borns with asphyxia at birth : a prospective study. Of the 152 newborns in 1 year prospective follow up. The incidence of a poor neurologic outcome was 13.8% among the subject. The risk of a poor outcome was increased by 13 fold in neonates with adverse neurological signs and 31 fold in those with hypoxic ischemic encephalopathy.
10. Pierrat V. et al, Prevalence, causes and outcome at 2 years of age of newborn encephalopathy : Population based study. 90 neonates with moderate or severe newborn encephalopathy were followed up for 2 years. 14 infants had a poor outcome.
11. Zhou.XJ., et al., Follow up study of mental development in high risk children. There was significant correlation between developmental assessment at 6 and 12 months and mental development at 7years. The evaluation of development at 12 months is of predictive value for long term outcome.
Moderate and severe encephalopathies are associated with poor outcome (death or severe handicap) in 25% to 100% of cases.
13. Oswyn G, et al Perinatal asphyxia at Port Moresby General Hospital : a study of incidence, risk factors and outcome. All 34 of the babies with grade 3 hypoxic ischemic encephalopathy (HIE) either died (30) or had serious neurological impairment.
14. Sorenson LC et al, Neonatal asphyxia – prognosis based on clinical findings during delivery and the first day of life. Neither complications of pregnancy, gestational age, the sex of the infant, passage of meconium before delivery, abnormal fetal heart rate nor birth weight seemed to have any interrelationship with outcome. The best predictor of outcome after intrapartum asphyxia was the severity of postasphyxial encephalopathy. The Apgar score was more depressed among the infants with poor outcome.
compared with 3%of the controls. Suboptimal head growth predicted abnormal neurodevelopmental outcome with a sensitivity of 79% and a specificity of 78%.
16. Leuthner SR et al : Low Apgar score & definition of birth Asphyxia. Non reassuring fetal heart rate pattern, prolonged labour, meconium
stained fluid , low 1 min apgar score & mild to moderate acidemia have no predictive value for long term neurological injury without encephalopathy or seizures.
17. Karin B et al, Apgar scores as predictor of chronic Neurologic disability. Low apgar scores were risk for cerebral palsy. But 55% of children with cerebral palsy had 1 min score of 7-10 & 73% with CP had 5 min score of 7-10. About 12% of 99 babies with Apgar score of 0-3 at > 10 min had CP. 11% of them had mental retardation & about 50% of them had seizures. 8 of these had other significant disabilities.
Neurosonogram & CT Brain abnormalities are associated with adverse outcome.
AIMS & OBJECTIVES
Aims of the study are
1. To study the incidence and types of neurologic sequelae at one year of age in babies admitted with neonatal hypoxic ischemic encephalopathy in the newborn ward in Institute of child health & research centre, Government Rajaji Hospital, Madurai.
2. To study the correlation of severity of Hypoxic ischemic encephalopathy to neurodevelopmental outcome.
METHODOLOGY
Study Design :
It is a prospective Analytical cohort study
Study Population:
The babies born between april 2004 and july 2004 & admitted with Hypoxic ischemic encephalopathy in newborn ward in Institute of child health and research centre madurai were included in the study.
Study Duration :
The babies were followed up for upto 1 year of age (from April 2004 to July 2005.)
Sampling :
Simple Random Sampling
Sample Size :
Inclusion criteria :
1. Term Newborn babies weighing > 2 kg admitted in Newborn ward ICH & RC Madurai
2. H/o birth asphyxia defined by
a. Apgar score of < 7 at 5 min and /or
b. Need for positive pressure ventilation > 1min after birth 3. Presence of features of hypoxic ischemic encephalopathy :
a.Altered consciousness b. Abnormal tone & reflexes c. Seizures
4. Thick meconium stained babies with HIE
Exclusion Criteria :
1. Babies with HIE who died during hospital stay 2. Depression from maternal anesthesia / analgesia 3. Babies weighing < 2 kg
4. Premature babies
5. Babies with cyanotic congenital heart disease
6. Babies with CNS malformation / other severe congenital malformation
Methodology :
After admission in the newborn ward the babies to be studied were registered. Detailed antenatal and birth history was taken & anthro pometry was done. By clinical neurological examination babies were grouped by Sarnat & Sarnat staging of HIE. Clinical course during hospitalization was studied. All the above details were recorded in a standard proforma (Annexure 2)
Babies who died during hospital stay due to complications of HIE were excluded from the study. Necessary investigation like EEG, USG cranium and CT scan was done.
After discharge the babies who survived the hospitalization were followed up at well baby clinic in ICH & RC upto the age of one year. The follow up was done every 3 months at 3,6,9 and 12 months of age.
At each follow up visit mothers were given a questionnaire regarding babies milestones. Neuro developmental assessment of babies was done
using Trivandrum developmental screening chart. (Annexure1).
Clinical Neurological Examination :
Complete neurological examination of babies was done. Special emphasis was given on
1. Presence of cranial nerve palsies 2. Strabismus
3. Examination for hypertonia / hypotonia by scarf sign, adductor angle and passive movements of limbs.
4. Examination for weakness of muscle groups
5. Deep Tendon Reflexes were elicited for presence of hyperreflexia
Measurement of Head circumference was done at each follow up. Clinical visual and auditory evaluation was done at every visit. Babies
with abnormalities were subjected to thorough ophthalmic examination and otoacoustic emission testing.
Neonatal reflexes :
Special emphasis was given to elicitation of 1) Moro reflex
2) Grasp reflex
3) Asymmetric tonic neck reflex
Children were observed for the persistence or asymmetry of these reflexes.
OBSERVATION & ANALYSIS
A total number of 100 babies were enrolled for the study & were followed up for 1 year.
Hospital admission data for 4 months April to July 2004. TABLE - 1
Total no. of live births 6000 Total no. of admission in newborn ward 560
Total no. of cases of birth asphyxia 132
Out of 132 babies admitted with birth asphyxia excluding babies with prematurity, Birth weight < 2 kg etc, 100 babies were registered & followed up in the well baby clinic up to the age of one year & the neurodevelopmental status was evaluated periodically at the interval of three months.
Statistical Analysis :
Computer analysis of data utilizing the software – Epidemiological Information Package – 2002 ( Epi Info 2002 ) – developed by the Centers for Disease Control and Prevention, Atlanta for World Health Organization.
ANALYSIS OF OUTCOME MEASURES
Neuro developmental outcome :
100 babies were followed up at the well baby clinic upto the age of 1 year and their neurodevelopmental status was evaluated periodically at intervals of 3 months using.
1. Clinical Neurological examination including testing of vision & hearing 2. Developmental Screening using Trivandrum Developmental
Screening Chart (Annexure 1)
Developmental delay in the study was defined by failure to achieve milestones appropriate for the age based on TDSC.
[image:42.612.94.527.452.648.2]Basic statistics
TABLE - 2
HIE I II III Total
Enrolled 39 48 13 100
Completed follow up 28 42 11 81
Drop out 11 6 2 19
Neurodevelopmental Status : At 3 months of Age
TABLE - 3
Neurodevelopmental status No. %
Normal 55 55
Abnormal 32 32
Drop out 13 13
During the first evaluation at 3 months of age, 55% of babies were normal & 32% were abnormal. 13 babies did not come for follow up. Dropout rate was 13%.
At 6 months :
TABLE - 4
Neurodevelopmental status No. %
Normal 64 64
Abnormal 21 21
9 babies who showed developmental delay at 3 months were found to be normal during next follow up visit. 2 more babies in addition to earlier 13 babies did not come for follow up.
At 9 months :
TABLE - 5
Neurodevelopmental status No. %
Normal 63 63
Abnormal 19 19
Drop out 18 18
2 babies who were abnormal at 6 months were found to be normal at 9 months. 3 more babies did not come for followup. All the babies who were normal at 6 months continued to be normal.
At 12 months :
TABLE - 6
Neurodevelopmental status No. %
Normal 62 62
Abnormal 19 19
At 1 yr of age, 62 babies were normal (62%), 19 babies were abnormal and a total of 19 babies had not come for follow up.
Developmental Delay - Breakup Age wise
TABLE - 7
Months I II III Total
3 4 16 12 32 6 1 9 11 21 9 0 8 11 19 12 0 8 11 19
Babies who were found to be abnormal at 9 months persisted to have developmental delay at 1 year. Babies who were normal at
3 to 6 months, remained normal thereafter.
Incidence of developmental delay - at 1 year of age.
TABLE - 8
Babies enrolled Completed
Follow up Developmental delay %
100 81 19 23.4
study period of one year. By the end of 1 year 19 babies out of the 81 were observed to have developmental delay based on Trivandrum Developmental Screening chart. That is about 23.4 % of children with Hypoxic ischemic encephalopathy were found to be abnormal at 1 year of age.
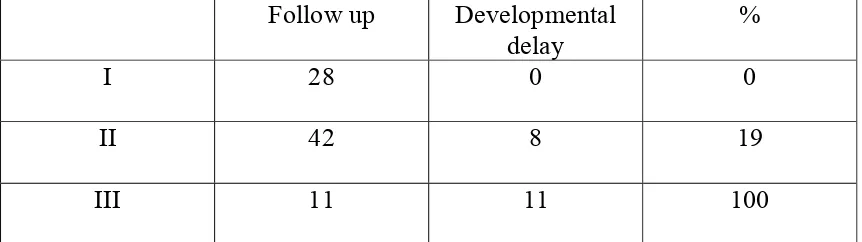
[image:46.612.95.526.311.432.2]Incidence of developmental delay in relation to HIE stages
TABLE - 9
Follow up Developmental
delay
%
I 28 0 0 II 42 8 19 III 11 11 100
Out of the 28 babies with HIE stage 1 who completed follow up none had any developmental delay. That is Developmental delay in HIE stage 1 was zero percentage.
Out of the 42 babies HIE stage II , 8 babies were found to be abnormal at 1 year of age. That is 19% of the babies with HIE stage II had developmental delay.
Other Disabilities
:Motor Disabilities at 1 year of age
TABLE - 10
I II III Total
Spastic quadriparesis 0 2 3 5
Generalised Hypotonia 0 0 1 1
Total 6
Motor disabilities were found in 6 out of 81 babies, ie. About 7.5%. Spasticity was the most common abnormality detected (83%) and it was found only in HIE stage III and Stage II.
Visual Disabilities at 1 yr of age
TABLE - 11
HIE Stage I II III Total
Convergent squint 0 5 3 8
Squint with Amblyopia 0 1 0 1
Cortical blindness 0 1 1 2
Total 11
Hearing Defects
Babies who where found to have hearing defects by clinical examination otoacoustic emission testing was done. Out of the 5 babies who were found to have hearing defects by clinical examination 2 were found to have deafness by otoacoustic emission testing.
HIE Stage II - 1 HIE Stage III - 1
[image:48.612.89.523.234.597.2]Seizures Disorder
TABLE - 12
HIE Stages I II III Total
Generalised tonic clonic 0 2 0 2
Myoclonic 0 1 0 1
Total 3
Microcephaly
Correlation of Head circumference at 1 year of age with HIE Staging TABLE - 13
HIE Stage Head Circumference
in cm
I II III
Mean 43.75 41.15 38.7
Standard Deviation (S.D)
0.68 1.72 0.75
Mean Head circumference of babies with HIE stage III was significantly lower compared to that of HIE stage II & stage I. HIE stage I babies had a mean head circumference in the normal range
Correlation of Head circumference with HIE stages TABLE - 14
HIE Stage Actual
difference of Mean S.E.(d) Standard Error of difference between means
HIE I & II 2.6 0.28
HIE I & III 5.05 0.26
HIE II & III 2.45 0.34
PERINATAL RISK FACTORS & OUTCOME
To study impact of the perinatal risk factors on neurodevelopmental outcome.
MATERNAL FACTORS :
1. Antenatal Immunisation & Antenatal check up :
82 of 100 mothers (82%) had two doses of tetanus toxoid & atleast two antenatal checks. 18 out of 100 mothers did not have even one antenatal check up and they were un immunized.
2. Parity :
TABLE - 15
Total no. of Pregnancies Numbers %
One 62 62
Two 26 26
Three 8 8
Four 2 2
> Four 2 2
Correlation of Parity with developmental delay
TABLE - 16
Developmental Delay Parity
Yes No
Relative risk P value
Primi 12 38
> Two 7 24
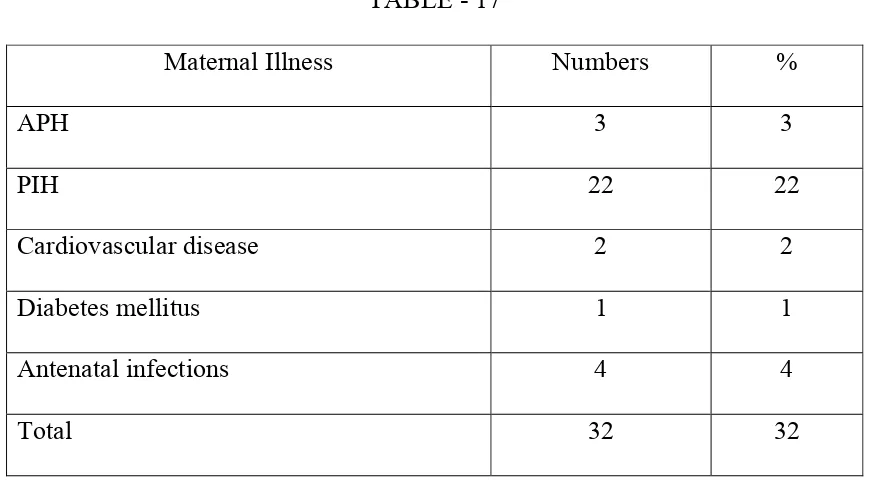
3. Maternal Illness :
TABLE - 17
Maternal Illness Numbers %
APH 3 3
PIH 22 22
Cardiovascular disease 2 2
Diabetes mellitus 1 1
Antenatal infections 4 4
Total 32 32
Out of 100 mothers 32 of them (32%) had some form illness complicating pregnancy. In this study preg`nancy induced hypertension (PIH) was the most frequent maternal illness associated with birth asphyxia.
Correlation of Maternal Illness with developmental delay. TABLE - 18
Developmental Delay Maternal Illness
Yes No
Relative Risk P value
Present 9 16
Absent 10 46 2.11 >0.05
[image:52.612.93.528.557.651.2]4. Mode of delivery :
TABLE - 19
Mode of delivery Numbers %
Labour natural 79 79
Forceps 9 9
LSCS 12 12
Vacuum 0 0
79 out of 100 mothers (79%) delivered Vaginally, 9 deliveries required forceps application (9%) & 12 babies were delivered by Caesarean section (12%). Vacuum application is not practiced in our institution.
Correlation of Mode of delivery with developmental delay TABLE - 20
Developmental Delay Mode of Delivery
Yes No
Relative Risk P value
Labour Natural 15 46
[image:53.612.92.526.492.590.2]5. Meconium stained liquor :
Meconium stained liquor was documented in 22 out of 100 mothers (22%)
[image:54.612.93.529.219.312.2]Correlation of Meconium stained liquor with developmental delay TABLE - 21
Developmental Delay Meconium stained
Liquor
Yes No
Relative Risk P value
Present 3 11
Absent 16 51 0.89 > 0.05
6. Mode of Presentation :
Majority of the deliveries were by vertex presentation 89%. Breech presentation was observed in only 11% of the babies.
Correlation of Mode of presentation with developmental delay TABLE - 22
Developmental Delay Mode of
presentation
Yes No Relative Risk P value
Vertex 16 58
[image:54.612.98.524.554.649.2]NEONATAL FACTORS :
[image:55.612.96.526.464.555.2]1. Sex
TABLE -23
Sex No. %
Male 62 62%
Female 38 38%
62 out of the 100 babies with birth asphyxia were males – 62% and 38% were females. Male to Female ratio is 1.6 : 1
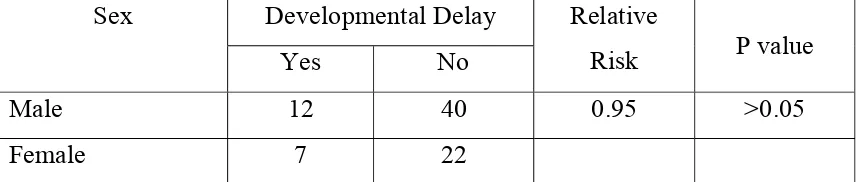
Correlation of Sex with developmental delay TABLE - 24
Developmental Delay Sex
Yes No
Relative
Risk P value
Male 12 40 0.95 >0.05
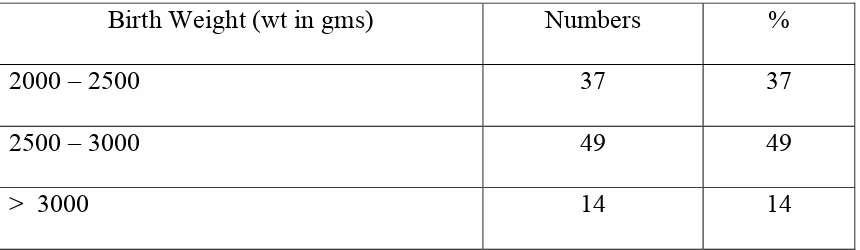
2.Birth Weight :
TABLE - 25
Birth Weight (wt in gms) Numbers %
2000 – 2500 37 37
2500 – 3000 49 49
> 3000 14 14
Those babies having birth weight below 2000 gms were excluded form the study. 37% of babies were between 2 – 2.5 kgs, 49% between 2.5 & 3.0 kg & 14% above 3.0 kg
Correlation of Birth weight with developmental delay TABLE - 26
Developmental Delay BirthWeight
Yes No
Relative
Risk P value
< 2.5 kg 7 25
[image:56.612.92.530.463.559.2]3. Time of first cry :
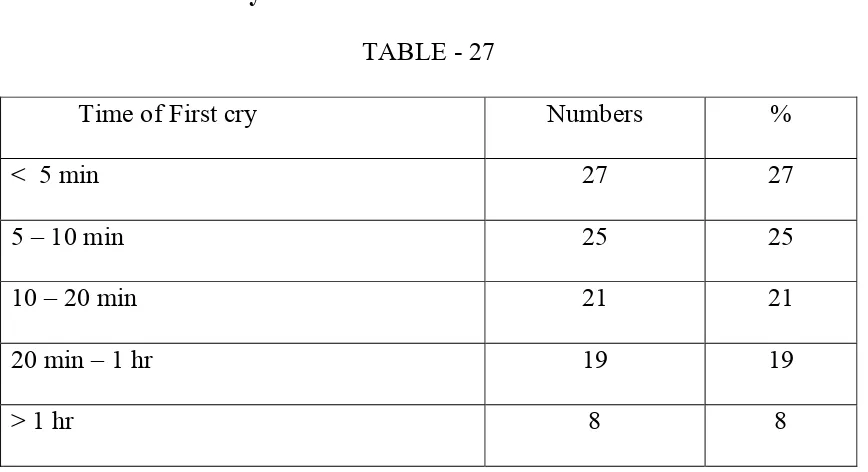
TABLE - 27
Time of First cry Numbers %
< 5 min 27 27
5 – 10 min 25 25
10 – 20 min 21 21
20 min – 1 hr 19 19
> 1 hr 8 8
About 27 % of babies cried within 5min, 25% of babies between 5-10 min, 22% of babies cried between 10-20 min. and 20% of babies cried between 20 min. to 1 hr. About 8 % of babies cried after 1 hr or later. Thus about 27 % of babies had only mild degree of asphyxia.
[image:57.612.95.529.80.316.2]Correlation of Time of first cry with developmental delay TABLE - 28
Developmental Delay Time of first cry
Yes No Relative Risk P value
> 20 min 10 14
4. Apgar Score at 5min of birth
TABLE - 29
Apgar Score No. %
0 – 3 38 38
4 – 7 62 62
38 out of the 100 babies were found to have an apgar score of less than or equal to 3 consistent with significant asphyxia
Correlation of Apgar Score at 5 min with developmental delay TABLE - 30
Developmental Delay Apgar score at
5 min
Yes No Relative Risk P value
0 – 3 9 26
[image:58.612.97.527.463.556.2]5. Apgar Score at 20 min.
TABLE - 31
Apgar Score No. %
0 – 3 22 22
4 – 7 78 78
Out of the 38 babies who had apgar score of less than or equal to 3 about 16 babies had a better apgar score of more than 3 at 20 min. only 22% of the babies had apgar score of less than 4 at 20 min.
Correlation of Apgar score at 20 min with developmental delay TABLE - 32
Developmental Delay Apgar score at
20 min
Yes No Relative Risk P value
0 – 3 11 18
[image:59.612.98.527.463.556.2]6. Resuscitation at 1 min of birth : TABLE - 33
Resuscitation at 1 min No. %
Routine 38 38
PPV at 1 min 62 62
62 out of 100 babies required positive pressure ventilation either by bag mask or endotracheal tube (62%)at 1 min after birth.
PPV at 1 min TABLE - 34
Resuscitation No. %
Bag mask ventilation 58 93.5
Endo tracheal intubation and ventilation 4 6.5
About 38% of babies required only routine resuscitation & had mild asphyxia.62% of the babies required positive pressure ventilation at 1 min after birth. 93.5% of these babies required bag and mask ventilation and about 6.5 % of these babies required intubation & ventilation.
[image:60.612.96.527.298.414.2]Correlation of Resuscitation at 1 min with developmental delay TABLE - 35
Developmental Delay Resuscitation at 1
min
Yes No
Relative Risk P value
PPV 14 37
7. Sarnat & Sarnat Staging :
Babies who developed hypoxic ischemic encephalopathy as evidenced by altered consciousness, abnormality of tone and presence of convulsions were classified into 3 groups based on Sarnat and Sarnat clinical staging.
39 babies out of 100 developed hypoxic ischemic encephalopathy - Sarnat & Sarnat Stage I. 48% of babies developed HIE Stage II & 13% of babies developed HIE stage III
Breakup of cases according to HIE stages TABLE - 36
HIE Stage No. %
I 39 39
II 48 48
III 13 13
Correlation of Sarnat & Sarnat Staging with developmental delay
[image:62.612.96.522.154.667.2]HIE stage I with HIE Stage II TABLE - 37
Developmental Delay Sarnat Stage
Yes No Relative Risk P value
I 0 28
II 8 34 (Infinite) α <0.01
HIE stage I with HIE Stage III TABLE - 38
Developmental Delay Sarnat Stage
Yes No Relative Risk P value
I 0 28
III 11 0 (Infinite) α <0.001
HIE stage II with HIE Stage III TABLE - 39
Developmental Delay Sarnat Stage
Yes No Relative Risk P value
II 8 34 5.25 <0.001
8. Duration of hospital Stay:
TABLE - 40
Duration of hospital Stay No. %
< 10 days 71 71
> 10 days 29 29
Duration of hospital stay of babies was arbitrarily classified into less than or equal to 10 days and more than 10 days. About 71% of babies were discharged within 10 days and 29% of the babies after 10 days.
Correlation of duration of hospital stay with developmental delay TABLE - 41
Developmental Delay Duration of
Hospital Stay
Yes No Relative Risk P value
> 10 days 12 13
[image:63.612.94.528.492.588.2]9. Convulsions :
TABLE - 42
Convulsions No. %
Present 51 51
Absent 49 49
About 51% of babies had atleast 1 episode of convulsions. 48 out of 51 babies with convulsions belonged to HIE Stage II and 3 babies belonged to HIE Stage III.out of the 51 babies only 43 completed follow up
Correlation of Convulsions with developmental delay TABLE - 43
Developmental Delay Convulsions
Yes No
Relative Risk P value
Present 15 28
[image:64.612.99.525.466.580.2]10. Time of onset of convulsions.
N = 51
TABLE - 44
Time of onset No. %
< 12 22 22
12 – 24 18 18
> 24 11 11
22 out of the 51 babies developed convulsions within 12 hrs of birth (43%) and remaining 29 babies had developed convulsions after 12 hrs (57%).
[image:65.612.96.525.133.284.2]Correlation of Time of onset of convulsion with developmental delay TABLE - 45
Developmental Delay Time of onset of
convulsion
Yes No Relative Risk P value
< 12 hrs 10 8
INVESTIGATIONS :
[image:66.612.95.526.145.251.2]11. Ultra sound cranium
TABLE - 46
USG cranium – Result No. %
Normal 92 92
Abnormal 8 8
USG cranium was taken in most babies in the first week. Few babies whose general condition was poor neurosonogram was done before discharge. About 92% of the babies with HIE had normal Neurosonogram findings. About 8% had abnormalities.
Out of 8 babies with abnormal neurogram 6 had cerebral edema, 1 had intraventricular hemorrhage & 1 had altered periventricular echogenicity.
Correlation of Ultra sound Cranium with developmental delay TABLE - 47
Developmental Delay Ultra sound
Cranium
Yes No Relative Risk P value
Abnormal 6 2
[image:66.612.95.529.585.678.2]12. Electroencephalogram :
TABLE - 48
EEG No. %
Normal Study 23 38.5
Abnormal record 37 61.5
EEG could be done only for 60 of the 100 babies. These included all babies in HIE stage II & 12 babies in HIE stage III
Out of the 60 babies 23 had a normal EEG ( 38.5%) &37 babies had abnormal EEG record (61.5%)
Types of abnormalities in EEG :
1. Poorly formed (low voltage) background waves in delta range. No abnormal discharge. Diffuse cerebral dysfunction.
2. Diffuse slowing with back ground beta to delta waves. Sharp wave discharges +
Correlation of Electroencephalogram with developmental delay TABLE - 49
Developmental Delay EEG
Yes No Relative Risk P value
Abnormal 11 25
[image:67.612.90.527.583.678.2]DISCUSSION
Birth Asphyxia and the consequent hypoxic ischemic encephalopathy are the common clinical problems encountered in the newborn ward. 23.5 % of the admission in the new born ward of Institute of Child Health and Research Centre, Madurai are birth asphyxiated babies.
Out of 100 babies followed up neurodevelopmental evaluation was completed in 81 babies (81%) upto one year of age. 19 babies did not complete the follow up.
Incidence of neurologic sequelae:
19 out of 81 babies i.e 23.4% were neurodevelopmentally abnormal at one year of age. In a similar study conducted by Asakura . H et al 33 showed 13.8 % children with HIE had poor neurologic outcome.
The incidence of neurologic sequelae was found to be 14% in babies with HIE (Robertson C Finer) 10. Similar results were obtained in a study by Thornberg E et al (Acta Pediatrica 1995) 15
also due to apparently normal babies (HIE stage I) not completing follow up. Also since Govt. Rajaji Hospital, Madurai is a tertiary care centre more number of complicated (Obstetric) cases are referred. The present study correlates with the observation that about 25-30% of babies are found to have permanent sequelae following HIE ( Nelson et al) 30
Severity :
No baby with HIE Stage I had developmental delay and all babies with HIE Stage III had developmental delay. The incidence of sequelae in moderate HIE was found to be about 19% which is slightly lower than that resulted in the study of Robertson C Finer et al (24%).10
Types of delay :
Motor disabilities occurred in about 7.5% of all children with HIE. That is 31.5% of children with developmental delay (by TDSC) had motor disabilities. The risk was highest in HIE III (36%). Spastic quadriparesis was the most common abnormality found (83%).
Visual disabilities :
impairment in most children. Cortical blindness with visual loss was present in 2 out of 11 patients. (18%)
Hearing deficits :
Hearing deficits occurred in minority of asphyxiated children (2.5%). Early detection by otoacoustic emission testing helped in early referral for intervention.
Seizure disorder :
Seizure disorder with recurrent convulsions in infancy was noted in 3 children. All were from HIE stage II encephalopathy (3.7%).
Microcephaly :
RISK FACTORS :
The factors significantly associated with neurodevelopmental deficit were HIE stage II, HIE stage III, delayed onset of first cry for more than 20 minutes, Low apgar score at 20 min. presence of convulsions, early onset of convulsions (< 12hrs), duration of hospital stay for more than 10 days and abnormal Ultra sound cranium.
These findings correlate well with other studies.
Sarnat & Sarnat HIE staging :
HIE stages showed marked correlation with neurodevelopmental deficit. None of the babies who had HIE stage I during neonatal period developed neurodevelopmental deficit. But HIE stage II and stage III were significantly associated with neurodevelopmental deficit. 8 of the 48 babies who were in Sarnat and Sarnat stage II and all the 11 babies with Sarnat and Sarnat stage III had neurodevelopmental deficit at one year.
In one study conducted in Swedish population 15 the observation made was similar, that is the neurodevelopmental outcome correlated well with the severity of HIE.
Delayed onset of First Cry :
The incidence of neurologic of sequelae was greater with delayed first cry >20 min (p <0.001)
Apgar Score :
The incidence of developmental delay correlated well with Apgar score at 20 min. (p < 0.001) in this study. This correlates well with study by Nelson et al 32 that incidence of cerebral palsy increased with presence of low Apgar scores (1% at 5 min to 57% at 20 min)
Convulsions :
In our study, presence of convulsions and early onset of convulsions < 12 hrs was associated with increased risk of developmental delay(p<0.001).
This correlates with study done by Thornberg et al 8 which showed
seizures increased risk of sequelae by 2-5 fold. 67% had died or developed sequelae. Early onset of seizures increases risk of adverse outcome (75% with seizures at < 4 hrs had developmental delay.)
Duration of Hospital stay :
Hospital stay (persistent neurological abnormality) of more than 10days was associated with greater risk of neurologic sequelae in our study
EEG :
30.5% with abnormal record developed neurologic sequelae. but this was not statistically significant (p>0.05)
Children with Normal / maturally delayed interictal EEG patterns have 86% normal development. Mild depression or normal background was associated with normal outcome (Volpe) 8.
Only markedly abnormal record predicted subsequent morbidity or mortality( Clancy R et al). 8
USG cranium :
6 out of 8 children with abnormal findings on ultra sound cranium had developmental delay (75%).(p < 0.001) .
8 out of 9 infants with normal scan had normal outcome (Siegel MJ. HIE in terms infants).
The result correlates well with other studies. (Neur Croat 1992) 19
Other Perinatal factors :
Other factors like maternal, illness, meconium stained liquor, mode of presentation, birth weight, mode of delivery, sex, apgar score at 5 min, parity and resuscitation at one minute were not significantly associated with neurodevelopmental deficit.
Developmental Screening :
In this study, an attempt was made to find out the earliest time of assessment which can predict neurodevelopmental abnormality. Although neurodevelopmental assessment at the age of 3 months was able to detect neurodevelopmental delay significant proportion of them became normal as child grew older.
It was also observed that none of babies found to be abnormal at the age of 9 months became normal at the of 1 year. But those babies found to be normal in the assessment at 6 months persisted as normal till end.
CONCLUSION
1. In this study out of 81 babies who completed follow up, 23.4% showed neurodevelopmental deficits.
2. The types of neurological sequelae found in HIE apart from delayed milestones were spastic cerebral palsy, hearing loss, visual impairment, epilepsy, and microcephaly.
3. The risk factors for neurodevelopmental deficit observed in this study are sarnat and sarnat HIE stage III , sarnat and sarnat HIE stage II , presence of convulsions, early onset convulsions of < 12 hrs, delayed first cry for more than 20 minutes duration of hospital stay > 10 days and abnormal USG cranium.
4. It is inferred from this study that the earliest age to detect definite neurodevelopmental abnormality is 9 months and the earliest age for predicting normal neurodevelopment is 6 months.
BIBLIOGRAPHY
1. Hypoxic ischemic encephalopathy in term newborn, Neurologic Clinics, Vol 3/ No.1 February 1985, pp. 31-46.
2. Diagnosis and management of perinatal asphyxia : current concept Indian Paediatrics Vol. 31, Oct 1994. pp – 1170-1173.
3. Park’s text book of social and preventive medicine 16th edition.
4. Manual of neonatal care, 5th edition, John P. Cloherty, pp. 394-411 5. Low, J.A. Am J. Obset Gynecol. 159 : 1235, 1998
6. Perlman, J.M. et al., Am. J. Dis. Child. 143 : 617, 1989. 7. Choi,D.W. Trends Neurosci. 11 : 465, 1988.
8. Neurology of the newborn .Volpe 5th edition
9. Pulsinelli, W.A., Birerly, J.B. and Plum. F. Temporal Profile of neuronal damage in a model of transient forebrain ischemia. Ann. Neurol. 11: 491-498, 1982.
10. Robertson, C. et al., Dev. Med. Child Neurol. 4 : 473, 1985. 11. Robertson, C.M.T. et al., J. Paediatr. 114 : 753, 1989.
12. Neurologic sequelae of hypoxic ischemic encephalopathy. An. Esp. Pediatrics, 1992 Feb, 36(2) : 115-20.
13. Assessing the contribution of birth asphyxia to cerebral palsy in term singletons. Pediatr. Perinat. Epidemiol. 1995 Apr. 9(2) 156-70.
15. Birth asphyxia – Incidence, clinical course and outcome in a Swedish population. Acta. Pediatrica, 84(8) : 927-32. 1995 Aug.
16. Perinatal asphyxia : Multivariate analysis of risk factors in hospital births. Indian Pediatrics Vol. 34 March 1997, 206-212.
17. Outcome in relation to Apgar scores in term neonates. Indian Pediatrics 1994 Oct, 31 (10) 1215-8.
18. Prospective observation of 100 high risk neonates by high field magnetic resonance imaging of the central nervous system. Lesions associated with hypoxic ischemic encephalopathy. Pediatrics 1991 Apr. 87(4) : 431-8.
19. Hypoxic ischemic brain damage in term neonates – The relation of neurodevelopmental handicap to cranial ultrasound findings. Neuro. Croat. 1992;41 (3) : 117-29
20. Freeman, J.M. et al., Paediatrics 82 : 240, 1988.
21. Robertson C.M. et al., Clin. Perinatal. 1993 Jun. 20(2) : 483-500 22. Hypoxic – ischemic encephalopathy in newborn infants. Acute
period and outcome, Arq Neuropsiquiatr. 1997 Dec., 55(4) 771-9. 23. Ellis M, Manandhar N, et al., Outcome at 1 year of neonatal
encephalopathy in Kathmandu, Nepal.
25. Perinatal risk factors related to neurologic outcomes of term newborns with asphyxia at birth : a prospective study. J Obstet Gynaecol Res. 2000 Oct ; 26 (5) : 313-24.
26. Perinatal asphyxia at Port Moresby General Hospital : a study of incidence, risk factors and outcome. P.N.G Med J. 2000 Mar-Jun; 43(1-2) : 110-20.
27. Neurological prognosis of term infants with perinatal asphyxia, J Gynecol Obstet Biol Repod (Paris). 2003 : Feb; 32 (1 suppl) : 1885-90.
28. Hypoxic ischemic encephalopathy. Incidence and risk factors in North Western Saudi Arabia. Saudi Med. J. 2003 Feb; 24(2) : 147-53.
29. Early developmental outcomes after newborn encephalopathy. Pediatrics Vol. 109 No. 1 January 2002, pp. 26-33.
30.
Nelson textbook of pediatrics 2004. 17
thedition
31.
O.P. Ghai., Piyush Gupta, VK Paul, Ghai Essential
paediatrics, 5
thEdition.
32.
Apgar Score and Cerebral palsy (Nelson et al)
33.
Asakura et al. Perinatal risk factors related to neurologic
outcome of term babies with asphyxia at birth – a
PROFORMA (ANNEXURE)
NEURO DEVELOPMENTAL OUTCOME IN CHILDREN WITH
BIRTH ASPHYXIA
NAME : I.P. NO. :
AGE : ADDRESS :
SEX :
ANTENATAL H/O
1. HYPEREMESIS - Y/N
2. DRUG INTAKE - Y/N -IFA OTHERS
3. EXANTHEMATOUS ILLNESS - Y/N
4. ANTEPARTUM HEMORRHAGE - Y/N
5. DIABETES MELLITUS - Y/N
6. HYPERTENSION - Y/N
7. PREECLAMPSIA - Y/N
NATAL H/o :
1. PLACE OF DELIVERY :
2. MODE OF DELIVERY : NORMAL
I) ASSISSTED
II) CAESAREAN
3. MATERNAL SEDTION : Y/N
4. MECONIUM STAINED LIQUOR : Y/N
RESUSCITATION:
i) SUCTION & O2
ii) BAG & MASK VENTILATION iii) BAG & TUBE VENTILATION iv) MECHANICAL VENTILATION APGAR SCORE :
1 MIN
5 MIN
20 MIN
BIRTH WEIGHT : SIBLING H/o
ON ADMISSION IN NEWBORN UNIT : 1. General Condition :
2. Cry :
3. Activity :
4. Colour :
5. HR :
6. RR :
7. CVS :
8. RS :
9. P/A :
10. CNS : TONE
NEONATAL REFLEXES ANTERIOR FONTANELLE SPINE & CRANIUM
SARNAT STAGING :
1. CONSCIOUSNESS 2. MUSCLE TONE 3. TENDON REFLEXES 4. MYOCLONUS
5. SUCKING
6. MORO RESPONSE 7. GRAPING
9. PUPILS
10. RESPIRATION 11. HEART RATE 12. CONVULSION INVESTIGATIONS :
ULTRA SOUND CRANIUM
ELECTRO ENCEPHALOGRAM
TRIVANDRUM DEVELOPMENTAL SCREENING CHART – BASED FOLLOW UP
H/O
MILESTONES :
CONVULSIONS :
OTHERS :
EXAMINATION :
HEAD CIRCUMFERENCE :
TONE :
POWER :
DTR :
PLANTAR :
NEONATAL REFLEXES :
VISION :
HEARING :
TRIVANDRUM DEVELOPMENTAL SCREENING CHART BASED DEVELOPMENTAL ASSESSMENT
ABBREVIATIONS
ADHD - ATTENTION DEFICIT HYPERACTIVITY DISORDER
APH - ANTEPARTUM HEMORRHAGE
ATP - ADENOSINE TRIPHOSPHATE
CDC - CHILD DEVELOPMENT CENTRE
CKBB - CREATINE KINASE BRAIN FRACTION
CNS - CENTRAL NERVOUS SYSTEM
CP - CEREBRAL PALSY
CT - COMPUTED TOMOGRAPHY
DDST - DENVER DEVELOPMENT SCREENING TEST
EEG - ELECTRO ENCEPHALOGRAM
HIE - HYPOXIC ISCHEMIC ENCEPHALOPATHY ICH & RC - INSTITUTE OF CHILD HEALTH RESEARCH CENTRE
LN - LABOUR NATURAL
MRI - MAGNETIC RESONANCE IMAGING
NMDA - N- METHYL, D – ASPARTATE
PIH - PREGNANCY INDUCED HYPERTENSION
PPV - POSITIVE PRESSURE VENTILATION
PERIVENTRICULAR LEUKOMALACIA
Coronal sonogram : Bilateral increased echogenecity just lateral and
CEREBRAL EDEMA
Sagittal Sonogram : Diffuse cerebral edema with silhouetting of
MASTER CHART
S . No.
Mother ’s Name Sex Mater nal i llness pr
esent / Absent
Mode of Delivery
Meconium stained li
quo
r
Bir
th weig
ht
Time of Firs
t cry
in mins
Apgar < 3 score at 20 min Y/N Resusci
tat
ion at 1
m in routine / PPV Sarna t Staging Time of on set of con v u lsion s < 1 2h rs Y /N
Duration of hos
pital sta y USG cr anium EE G
1. Revathy M P Forceps P 2.25 5 N R I - 3 N -
2. Reta Mary M P LSCS A 2.45 10 N R I - 3 N -
3. Karthiga F A L. N P 2.7 5 N PPV I - 4 N -
4. Saraswathi M P Forceps A 2.2 10 N R I - 3 N -
5 Kauupathal M A L. N P 2.3 5 N PPV II N 11 N A
6 Sakrtabanu M P L. N P 2.6 20 Y PPV III N 13 N A
7 Dhanalakshmi F A Forceps A 2.2 20 N R II N 6 N N
8 Mardayee M A L. N A 3.4 5 N PPV II N 8 N A
9 Muthumari F P L. N A 2.4 5 N R I 3 N
10 Devi shree F A L. N A 2.75 20 N R II N 12 N N
11 Venkateswari F P LSCS A 2.25 20 Y PPV II Y 11 N A
12 Sevanammal M A L. N A 2.8 5 N R II N 8 N A
86
14 Eswari M P L. N A 2.1 10 N R I 3 N -
15 Selvi F A LSCS A 2.55 20 y PPV II Y 11 N A
16 Durgeswari M A L. N A 2.4 20 N R II Y 7 N A
17 Valarmathi M A L. N A 2.75 1hr Y PPV III - 14 N A
18 Muthuselvi M A L. N P 2.25 5 N PPV I - 4 N -
19 Sri Devi M P L. N P 3.3 20 N PPV II N 7 N N
20 Jeyarani M A L. N A 2.35 5 N R I - 4 N -
21 Amirthavalli F P Forceps A 2.8 10 Y PPV III Y 11 N A
22 Kuruvathal F A L. N A 3.4 10 N PPV II N 6 N N
23 Nallamani M P L. N A 2.9 1hr N R II N 7 N A
24 Thulasi F P LSCS A 2.45 5 N R I - 3 N -
25 Papathi M A L. N P 2.5 >1hr Y PPV II Y 10 A A
26 Mala M A L. N A 2.3 10 N PPV II N 6 N A
27 Sumathi F A L. N A 2.5 1hr N R II Y 7 N A
28 Shanthi M P L. N A 2.25 10 N PPV II N 12 N N
29 Rakku M A L. N A 3.6 5 N PPV I - 3 N -
30 Natchiammal F P LSCS A 2.1 20 N R I - 3 N -
31 Pavalakodi M A L. N A 2.7 20 N R II N 11 N A
33 Selva meena F P L. N P 3.2 10 N PPV II N 7 N N
34 Veerajothi M A L. N A 2.75 1hr Y PPV III Y 12 N A
35 Arokyaselvi F A L. N A 2.6 20 N PPV II N 7 N N
36 Noorjahan M P L. N P 2.1 5 N R I - 4 N -
37 Pappa F A LSCS P 3.8 10 N R I - 4 N -
38 Chellammal M A L. N P 2.4 10 N PPV II N 11 N N
39 Jeyalakshmi F P L. N A 2.5 1hr Y PPV III - 12 N A
40 Deepalakshmi F A L. N A 3.5 20 N PPV II N 7 N N
41 Veerammal M A Forceps A 2.3 1hr N PPV II Y 11 A A
42 Vijayalakshmi M A L. N A 2.7 5 N R I - 5 N -
43 Saradha M P L. N P 3.9 20 N R I - 5 N -
44 Thangam F A L. N A 2.1 1hr N R II Y 12 N N
45 Kanimozhi M A L. N A 2.8 5 N PPV II N 7 N N
46 Katheeja F A L. N P 2.5 1hr N PPV II Y 12 N N
47 Aarthi F A LSCS A 2.2 >1hr Y PPV III - 11 A A
48 Durgeswari M P L. N A 2.9 5 N R II N 8 N N
49 Jeyarani M A L. N A 2.35 20 N R I - 3 N -
50 Muthuselvi F A Forceps P 3.2 1hr Y PPV II Y 7 A A
88
52 Chellammal M P L. N A 2.6 10 N PPV II N 7 N N
53 Sundari F A L. N A 2.25 10 N R I - 3 N -
54 Sikkandar Beevi M A L. N A 2.7 >1hr Y PPV II Y 11 N A
55 Vairamani F P L. N A 2.1 >1hr y PPV II Y 7 N A
56 Lakshmi M A L. N A 2.8 5 N PPV I - 3 N -
57 Muthumari M P LSCS p 2.4 5 N R I - 4 N -
58 Jyothi F A L. N A 2.9 10 N R I - 4 N -
59 Maruthu pandi M A L. N A 2.3 10 N PPV I - 5 N -
60 Chitra M P L. N A 3.5 5 N R I - 5 N -
61 Periyanatchi F P L. N A 2.2 10 N R I - 5 N -
62 Raja lakshmi M A Forceps A 2.5 5 N R I - 5 N -
63 Vanilla M A L. N A 2.2 5 N R II - 4 N -
64 Pandi F A L. N A 2.6 1hr N R II Y 7 N A
65 Thangam F P LSCS A 3.45 20 N PPV II Y 12 N A
66 Irulayee M A L. N A 2.5 20 N PPV II N 6 N N
67 Devi M A L. N P 2.4 1hr Y PPV II - 14 N A
68 Amutha M A L. N A 2.8 10 N PPV III N 7 N N
69 Latha F A L. N A 2.5 5 N R I - 3 N -