IMPACT OF HYPERTENSION ON RENAL DISEASE AMONG
RENAL PATIENTS
By
Rengalakshmi. A
A DISSERTATION SUBMITTED TO THE TAMIL NADU DR. M.G.R MEDICAL
UNIVERSITY, CHENNAI, IN PARTIAL FULFILLMENT OF THE
REQUIREMENTS FOR DEGREE OF MASTER OF
SCIENCE IN NURSING
IMPACT OF HYPERTENSION ON RENAL DISEASE AMONG
RENAL PATIENTS
Approved by the dissertation committee on: _________________________
Research Guide : ________________________
Prof.S.Ani Grace Kalaimathi M.Sc (N)., PGDNA., DQA., Ph.D., Principal,
MIOT College of Nursing, Chennai-116.
Nurse Guide : ________________________
Prof. N.Jayasri
M.Sc (N)., M.Phil., Ph.D., Vice principal cum
H.O.D,Medical-Surgical Nursing, MIOT College of Nursing,
Chennai-116.
Medical Guide : _______________________
Dr.Ganesh Prasad
DNB(Genmed)DNB(Nephro)MNAMS.,
Nephrologist, MIOT Hospitals,
Chennai-89.
A DISSERTATION SUBMITTED TO THE TAMIL NADU DR. M.G.R MEDICAL
UNIVERSITY, CHENNAI, IN PARTIAL FULFILLMENT OF THE
REQUIREMENTS FOR DEGREE OF MASTER OF
SCIENCE IN NURSING
DECLARATION
I hereby declare that the present dissertation entitled “IMPACT OF HYPERTENSION ON RENAL DISEASE AMONG RENAL PATIENTS” is the
outcome of the original research work undertaken and carried out by me, under the guidance of Prof. S. Ani Grace Kalaimathi M.Sc (N)., PGDNA., DQA., Ph.D., Principal MIOT College of Nursing, Chennai and Prof. N.Jayasri, M.Sc., M.Phil., Ph.D., Vice principal and Head of the Department of Medical Surgical Nursing, MIOT College of Nursing, Chennai. I also declare that the material of this has not formed in any way, the basis for the award of any degree or diploma in this university or other universities.
i
ACKNOWLEDGEMENT
I wish to express my heartfelt gratitude to my God Almighty for the abundant blessings, health and confidence throughout the dissertation.
I express my genuine gratitude to the Managing Trustee of MIOT educational institutions for giving me an opportunity to conduct the study.
I owe my whole hearted gratitude and sincere thanks to Prof. S. Ani Grace Kalaimathi, M.Sc(N).,PGDNA., DQA.,Ph.D, Principal and Research Guide, MIOT College of Nursing for her valuable guidance, innovative suggestions, constant motivation and extreme patience which enabled me to complete the dissertation successfully.
I am privileged to express my sincere gratitude and thanks to Prof. N. Jayasri, M.Sc (N)., M.Phil.,Ph.D, Vice Principal, Nurse guide and Head of the department of Medical–Surgical Nursing, MIOT College of Nursing for her valuable guidance, motivation, suggestions, extreme patience throughout the study.
I extend my thanks to Dr.Ganesh Prasad,DNB(Genmed) DNB(Nephro) MNAMS., Nephrologist, MIOT Hospitals, Chennai for his constant support, valuable suggestions, corrections and guidance for this study.
My heartfelt gratitude to Mrs. Kavitha, M.Sc (N)., Reader, Ms.Kanimozhi, M.Sc(N)., Lecturer, Department of Medical-Surgical Nursing,MIOT College of Nursing for their valuable guidance, suggestion, motivation, timely help and support throughout the study.
ii
Nursing, Chennai for her constant motivation, timely help and valuable suggestions for completing the study.
I thank all teaching faculty in MIOT College of Nursing, for their timely advice, guidance and encouragement.
I am grateful to Prof. Dr. Antony Amalraj, M.Sc., Ph.D., Professor in Bio statistics, for his help in statistical analysis.
I thank all the participants in this study for their interest and cooperation. I thank our Librarian Mrs. Buvaneshwari, M.L.I.S., for her constant help in assisting me in reviewing the books for my literature during the course of my work.
I express my whole hearted gratitude and sincere thanks to my lovable parent Mr. Ayyalusamy and Mrs. Subbulakshmi for their constant support and motivation and I express my heartfelt thanks to my beloved brothers and sisters for their constant support, encouragement, motivation in all the stages of my work which enabled me to complete this study.
With my deep gratitude, I acknowledge my friends and classmates, seniors for their concern and contribution.
iii
ABSTRACT
A retrospective study to assess the impact of hypertension on renal disease among renal patients in MIOT Hospitals, Chennai. The conceptual framework of the study was developed on the basis of epidemiological triad. The study variable was hypertension with renal disease patients attending renal outpatient department MIOT Hospitals, Chennai. A quantitative research approach with retrospective design was used to achieve the objectives of the study. The study was conducted in MIOT Hospitals, Chennai, with a sample size of 150 hypertension with renal disease patients. The samples were selected through purposive sampling method for prevalence of hypertension among renal patients and convenient sampling method for impact of hypertension on renal disease. The investigator used a demographic variable proforma and with clinical data and checklist on impact of hypertension on renal disease among renal patients to collect the data. The data collection tools were validated and reliability was established. The data was collected by using an interview method and from patient clinical file.
iv
and creatinine, majority of them did not follow regular annual check-up( 78%), 68% of patients did not take antihypertensive drugs regularly. There is a significant association between the checklist score and demographic variables like gender, occupation and educational status (P< 0.05).
v
TABLE OF CONTENTS
Chapter Contents Page No
I INTRODUCTION 1-10
Need for the study Statement of the problem Objectives of the study Operational definitions Assumptions
Delimitations Projected outcome
II REVIEW OF LITERATURE 11-31
Literature related to prevalence of renal failure among hypertensive patients.
Literature related to impact of hypertension among chronic kidney disease patients.
Conceptual framework.
III RESEARCH METHODOLOGY 32-37
Research approach Research design Setting
vi Sample size
Sampling technique Inclusion criteria Exclusion criteria Data collection tool Validity
Reliability Pilot study
Data collection procedure Human rights protection
IV DATA ANALYSIS AND INTERPRETATION 38-66
V DISCUSSION 67-74
VI SUMMARY,CONCLUSION,LIMITATIONS,
IMPLICATIONS AND RECOMMENDATIONS 75-79
REFERENCES 80-85
vii
[image:10.595.124.547.204.738.2]LIST OF TABLES
Table No. Tables Page No
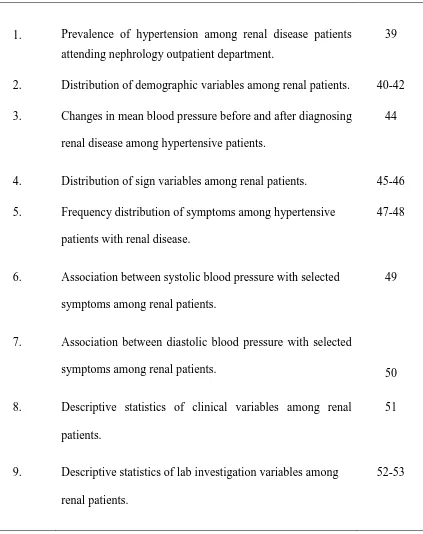
1. Prevalence of hypertension among renal disease patients attending nephrology outpatient department.
39
2. Distribution of demographic variables among renal patients. 40-42 3. Changes in mean blood pressure before and after diagnosing
renal disease among hypertensive patients.
44
4. Distribution of sign variables among renal patients. 45-46 5. Frequency distribution of symptoms among hypertensive
patients with renal disease.
47-48
6. Association between systolic blood pressure with selected symptoms among renal patients.
49
7. Association between diastolic blood pressure with selected
symptoms among renal patients. 50
8. Descriptive statistics of clinical variables among renal patients.
51
9. Descriptive statistics of lab investigation variables among renal patients.
viii
10. Correlation between lab investigations with blood pressure among renal patients.
54
11. Distribution of radiological and imaging investigations among renal patients.
56
12. Distribution of treatment–non medical and medical management among renal patients.
57-58
13. Descriptive statistics on check list for hypertension with renal disease score among renal patients.
59
14. Distribution of check list responses. 60-61
15. Association between level of check list score and demographic variables among hypertensive patients with renal disease.
ix
[image:12.595.90.538.104.472.2]LIST OF FIGURES
Figure No. Description Page No
1. Conceptual framework based on Epidemiological Triad. 31
2. Mean blood pressure value before and after diagnosing renal disease among hypertensive patients.
43
3. Distribution of urine test variables among renal patients. 55
4. Distribution of impact of hypertension on renal disease. 62
5. Distribution of impression on hypertension among renal patients.
x
LIST OF APPENDICES
Appendix Description Page No
A Letter seeking permission to conduct the study xi
B Informed consent form xii
C 1.Data collection tool- English xiii-xxiv
1
`CHAPTER I
INTRODUCTION
“Prevention is better than the cure”
The bones can break, the muscle can atrophy, the glands can loaf, even the brain go into sleep without immediate danger for the survival, but if the kidney fails neither, the bone, the muscle, the gland nor the brain could carry on its function. This statement underlies the importance of the kidney in our life.
Hypertension is sometimes called “the silent killer ” because the people who have it are often are symptom free. In the national survey , 32% of the population who had pressures exceeding 140/90 mm Hg, were unaware of their elevated blood pressure. It should be monitored at regular intervals because hypertension is a silent killer which require careful attention.
An adult more than the age of 20 years who has a systolic blood pressure of equal or more than 140 mm Hg and a diastolic blood pressure of equal or more than 90 mm Hg when recorded on two occasions in a relaxed sitting posture is considered hypertensive.
2
Chronic kidney diseases are one of the most important chronic non-communicable disease epidemics in the world, including India. Chronic kidney diseases have emerged as a serious public health problem worldwide. Health education is the cornerstone for prevention of chronic kidney disease. Public perception of chronic kidney disease and knowledge about kidney diseases is poor in India.
Hypertension causes problems for many organs in the body, including the kidneys. Kidney problems caused by high blood pressure occur often in persons who have undetected, untreated, or poorly controlled hypertension.
Many body systems are at serious risk due to the extreme rise in blood pressure. Multiple organs of the body, including the brain, the eyes, the blood vessels, the heart, and the kidneys may be damaged. The blood vessels of the kidney are highly susceptible to damage caused by high blood pressure, and kidney failure may develop and lead to permanent damage requiring long term dialysis.
Kidneys play a key role in keeping a person‟s blood pressure in a healthy range, and blood pressure, in turn, can affect the health of the kidneys. High blood pressure makes the heart work harder, and over the time, can damage the blood vessels throughout the body. If the blood vessels in the kidneys are damaged, they may stop removing wastes and extra fluid from the body. The extra fluid in the blood vessels may then raise blood pressure even more. This is a dangerous cycle.
3
until it has reached an advanced stage. It is usually detected at earlier stages by variations in the blood and urine tests only. So if it is detected early, the progression can be stopped or the disease can be reversed.
High blood pressure is one of the leading cause of kidney failure. Every year, high blood pressure leads to more than 25,000 new cases of chronic kidney disease in the United States.
Hypertension is a very common finding, particularly as people become older; it can also be the first sign of kidney disease. High blood pressure can also itself be a cause of kidney disease, so people who have high blood pressure for a number of years, particularly if it is difficult to control with medications, need to be repeatedly screened for evidence of kidney damage.
Early chronic kidney disease does not cause symptoms. One should routinely evaluate asymptomatic persons who are at high risk for chronic kidney disease. Adults, especially those in the high-risk group with strong family history of diabetes, the obese and those with hypertension should be routinely screened for hypertension, diabetes and kidney disease.
4
Nationally, 26 million adults have chronic kidney disease, more than 367,000 people depend on dialysis for survival; 87,000 people are waiting for a Kidney transplant, and 75 percent of adults on dialysis cannot attend work or school, the spokesman said.
Chronic kidney disease is emerging as an important cause for morbidity and mortality. Worldwide, the major cause for chronic kidney disease is hypertension. In a country like India, where the per capita income is low, only 1% of the population can afford renal replacement therapy. The global response to this challenge is prevention, early detection, and treatment.
Nephrologists are highlighting the important role that chronic kidney disease plays in morbidity and mortality from cardiovascular disease, and they are stressing the importance of properly treating hypertension, diabetes, and dyslipidemia in patients with impaired renal function.
5
Need for the Study
Hypertension remains one of the leading causes for renal failure and is clearly a major contributor to accelerated loss of the renal function in the setting of other forms of the renal disease.
Ashok.L, et al.(2011) stated the relationship between kidneys and hypertension. The kidneys are the regulators of blood pressure in normal body. When a person has renal hypertension, that hypertensive state itself induces histopathological changes of nephrosclerosis due to the hypertension and not due to the original renal disease. This nephrosclerosis adds to the renal damage produced by the renal disease and accelerates the process of azotemia. As a therapeutic maneuver, tight control of blood pressure helps to decelerate the process of azotemia and retards the progression of the renal failure towards end-stage.
6
Giusseppe Remuzzi, et al.(2008) stated that lack of awareness means that opportunities are being lost to prevent not only renal but cardiovascular diseases. Most important, kidney disease first needs to be identified, because of its silent nature, and the "simplest way to do this is to perform a dipstick test for proteinuria or to look at serum creatinine and see if there are any abnormalities."
Matthew.T, et al.(2008) on reviewing all the recent literatures with regard to chronic kidney disease, concluded: "The treatment of hypertension is the mainstay of management to slow the progression of renal disease and reduce cardiovascular risk.
John fee Hally, et al.(2005) said that the government to Standardize the diagnostic testing for serum creatinine (an important measure of kidney function). To the people of the country he said, test yourselves periodically for albumin in the urine.
Agarwal.R, et al.(2009) stated that hypertension is very common in patients with chronic kidney disease; its prevalence increases with glomerular filtration rate and reaches an estimated 86% in patients End Stage Renal disease. In the third national health and nutrition examination survey, 70% of those with an elevated serum creatinine had hypertension. Sodium and water retention with progressive decrease in glomerular filtration rate is thought to be etiologically related to the high prevalence of hypertension.
7
The second approach to detect kidney dysfunction is by urinalysis in high-risk patients. The tests should include a urinalysis and if needed a urine-to-protein/creatinine ratio measurement. In hypertensive and diabetic patients whom there is no Proteinuria, micro albuminuria is the earliest manifestation of kidney disease.
The exact prevalence of chronic kidney disease in India is not clear in the absence of regular national registry data and provided only a small observational series or rely on reports from personal experience, but the quality of data is quiet uneven. There are only three population based studies in India commenting on the magnitude of chronic kidney disease.
8
kidney disease. An increased effort to promote kidney disease awareness is needed and probably should target primary care providers involved in the screening process.
In a prevention programme started at community level in Chennai, the reported prevalence is 0.86% in the project population and 1.39% in the control region. The second study is based on Delhi involving 4972 urban patients. The prevalence of chronic renal failure was found to be 0.79 % or 7852 per million populations. The third study perhaps the only longitudinal study to identify the incidence of end stage renal disease based on 572,029 subjects residing in city of Bhopal suggests that the average crude and age adjusted incidence rates of end stage renal disease were 151 and 232 per million populations respectively.
The prevalence of hypertension is high in Kerala, South India. The prevalence of hypertension increases with older age, and high dietary salt intake. The low level of awareness of the problem among the population necessitates urgent medical and social intervention. Improvement of the awareness for hypertension and the early detection and treatment of high blood pressure in the community may reduce the risk of development of chronic kidney diseases.
The need for health care providers to be proactive with regard to the kidney disease by the early detection and treatment, with a view to slowing the progression is being increasingly emphasized worldwide.
Researcher has focused on importance of monitoring the renal function among hypertensive patients.
9
Statement of the Problem
A retrospective study to assess the impact of hypertension on renal disease among renal patients at MIOT Hospitals, Chennai.
Objectives
To identify the prevalence of hypertension among the renal patients.
To identify the impact of hypertension on renal disease among renal patients. To associate the renal failure checklist score with demographic variables of
hypertensive patients with renal failure.
Operational Definitions
Impact
In this study, impact refers to the extent to which the effect of hypertension was the cause for renal disease in hypertensive patient.
Hypertension
In this study, hypertension refers to persistent elevation of systolic blood pressure above 140mmhg and diastolic blood pressure above 90mmhg for prolonged period.
Renal Disease
10 Renal patients
In this study, renal patients refers to the patient having renal disease and attending nephrology outpatient department.
Assumptions
Hypertension is one of the risk factor for renal disease.
Hypertensive patients have an increased chance of developing renal disease.
Delimitations
The study period was limited to 6 weeks only.
The study was delimited to only hypertensive patients with the renal disease and hypertensive patients attending nephrology outpatient department.
Projected Outcome
11
CHAPTER II
REVIEW OF LITERATURE
The review of literature refers to the activities involved in identifying and searching for information on the topic and developing and understanding the state of knowledge on the topic.
-Polit and Hungler[2004]
Literature review was done on prevalence of hypertension on renal disease, impact of hypertension on renal disease by means of extensive survey of books, journals, internet and media. Research as well as non-research literatures were reviewed to understanding and gain insight into the problem under study. It is gradually prepared to put a research problem in context or to identify gaps and weakness in prior studies so as to justify new investigations. An extensive review of relevant literature was conducted to generate an insight and collect maximum information for laying down the foundation of the study.
The review of literature has been divided under the following headings:
Section I: Literature related to prevalence of renal failure among the patient with
hypertension.
Section II: Literature related to impact of hypertension among the chronic kidney
disease patients.
12 Section I
Literature related to prevalence of renal failure among the patient with
hypertension
Information on the incidence and outcome of chronic kidney disease in India is not available. Unlike elsewhere in the world, there is no end-stage renal disease registry in India.
Vimala.A, et al.(2009) conducted a large community-based study in South Delhi. The findings of the study revealed that the prevalence of chronic renal failure among adults was found to be 7850/million.The prevalence of chronic renal failure is much higher in the western societies where the prevalence is estimated to be 47000/million.
Emeka.A.Nwankwo, et al.(2006) conducted the study on prevalence of impaired kidney function in hospitalized hypertensive patients in Maiduguri. He has compared 54 males and 31 females patients with impaired kidney function with that of 37 male and 63 female patients with normal kidney function. The findings of the study revealed that among 50 hypertensive patients 27 % of study population had impaired kidney function. The mean serum creatinine in the study group was 289.2 µmol/l with a standard deviation of 309.88 µmol/l. Elevated serum creatinine greater than 135 micromoles per liter was seen in 85 or 45.5 % of the study population.
13
of 190 patients (64+/-14.1 years, 53% males, 77% whites) were evaluated over a 3 months period. Of the 190 patients, 146 (76.8%) were hypertensive. 117 out of 146 hypertensive patients (80.1%) had persistent elevation of blood pressure despite being on one or more antihypertensive medications.39% of patients were on calcium channel blockers,27% being on beta-blockers and 14% on angiotensin converting enzyme inhibitors. There was no correlation between the number of medications used and the control of hypertension. The hypertension was a frequent finding in hemodialysis population and it was controlled in only 19.9% of hypertensive patients. Most of this hypertension was pre-dialysis systolic. There was a significant correlation between fluid loss during dialysis and lowering of blood pressure.
14
Crews.J, et al.(2002) conducted the study on prevalence of renal disease among U.S.adults. The findings revealed that 13.4% of people who have normal bloodpressure have chronic kidney disease. Among those with prehypertensive, the prevalence was 17.3%; those with undiagnosed hypertension, the prevalence was 22.0%; and those with diagnosed hypertension, the prevalence was 27.4%. Among adults in the United States, 1 in 4 has hypertension and 1 in 8 has chronic kidney disease as on the year 2000.
The National Kidney and Urologic Disease Information, a federal agency (2001), estimates that about 4.5% of people over age 20 have chronic kidney disease, as indicated by tests that measure kidney function. Hypertension is the second leading cause of chronic kidney disease. It accounts for between 27% and 30% of all new cases of chronic kidney disease.
15
renal insufficiency (43% P<0.001). There is a high prevalence of hypertension in renal patients, which depends on the type of nephropathy and the degree of renal failure.
Christine Adamec, et al.(2001) stated that renal failure is caused primarily by chronic high blood pressure over many years. Hypertension is the second major cause of end stage renal disease after diabetes and is responsible for 25–30% of all reported cases. In addition, many people with diabetes also have hypertension, thus high blood pressure plays an even larger role in kidney failure. About 398,000 people were diagnosed with end stage renal disease in 2001. Of these, about 83,000 had hypertension and about 133,000 had diabetes.
16
Coresh.J, et al.(2000) conducted the study on chronic kidney disease awareness, prevalence, and trends among U.S. adults. The findings of the study revealed that moderately decreased kidney function awareness was much lower among women than men (2.9 +/- 1.6 versus 17.9 +/- 5.9%; P = 0.008).
Section II
Literature related to impact of hypertension among chronic kidney disease
patients
Leoncini, (2011) belongs to I-DEMAND (Italy-Developing Education and awareness on microalbuminuria in patients with hypertensive Disease) conducted study on high blood pressure and cardiovascular prevention. The study was designed to assess the prevalence of microalbuminuria and its clinical correlates among Italian hypertensive patients. Samples were included 4151 patients from 87 specialized care centers. The study demonstrated that approximately one-half of the patients had chronic kidney disease, with albuminuria being present in one-quarter of the individuals. The presence of renal abnormalities was more prevalent in patients with concomitant cardiovascular risk factors.
17
treatment adherence, limited access to health care, or failure of healthcare providers to treat hypertension aggressively. There is a clear relationship between hypertension and chronic kidney disease.
Koichi Hayashi, et al.(2010) conducted the study on impact of renal function on cardiovascular events in elderly hypertensive patients treated with efonidipine in Japan. The patients were randomly assigned to either a strict-treatment group (target systolic blood pressure < 140mm Hg, n=2212) or a mild treatment group (target systolic blood pressure 140 to <160 mm Hg, n=2206), each with efonidipine based regimens. Cardiovascular events were evaluated during the 2-year follow-up period following the prospective randomized open-blinded end-point method. Estimated glomerular filtration rate was elevated throughout the trial period in both the strict treatment group (59.4-62 mlmin-1 per 1.73m2) and the mild-treatment group (58.8-61.4ml min-1 per 1.73m2). In conclusion, the rates of decline of renal function and proteinuria constitute critical risk factors for cardiovascular events in elderly hypertensive patients; trends that are enhanced when baseline estimated glomerular filtration rate is diminished. Furthermore, the fact that efonidipine based regimens ameliorate renal function in elderly hypertensive patients with chronic kidney disease may offer novel information on the mechanisms of cardiovascular protection.
18
stage renal disease and 102 patients died. Compared with those with controlled systolic blood pressure (<130 mm Hg), patients with moderate control (130 to 149 mm Hg) had hazard ratio of 3.87 and those with poor control hazard ratio of 9.09 for end stage renal disease. Diastolic blood pressure had no direct ability to predict end stage renal disease. The study concluded that in older patients with chronic kidney disease, systolic blood pressure predicts end stage renal disease and a higher systolic blood pressure and lower diastolic blood pressure predicts all-cause mortality.
Anthony Lee, et al.(2009) stated that, result of untreated high blood pressure is kidney failure. Along with diabetes mellitus, hypertension is a major risk factor for this condition because of the damage to the functional unit of the kidney. Additionally, such kidney disease, in turn, can increase blood pressure. Between 80 to 90percentage of patients with chronic kidney failure have hypertension.
19
Marin.R, et al.(2006) conducted the study on blood pressure control in patients with chronic renal insufficiency in Spain by a cross-sectional survey. The study was designed for assessment of control rates of blood pressure, proteinuria and cardiovascular co morbidities in patients with chronic renal insufficiency. 2501 patients with a mean age 64.8 years (65.7% men) were included. The prevalence of previous cardiovascular disease was 55%. A poor blood pressure control was associated with older age, greater proteinuria and higher low-density lipoprotein cholesterol levels. Proteinuria greater than 0.5 g/day was observed in 1209 cases (48.3%). A total of 1899 patients (75.9%) were receiving drugs suppressing the activity of the renin-angiotensin system and 1048 patients (41.9%) were being treated with three or more antihypertensive drugs.
Mogensen.C.E, et al.(2005) conducted the study on vascular impact of anti-hypertensive treatment and renal protection. Hypertension contributes to the progression of renal disease by accelerating structural changes in the kidney, leading to a progressive decline in glomerular filtration rate. Hypertension and micro vascular changes can create a vicious circle, leading to further renal damage and increases in blood pressure. Angiotensin receptor blocking drugs and angiotensin converting enzyme inhibitors have been shown to display renoprotective effects and angiotensin converting enzyme inhibitors reduce the risk of microalbuminuria.
20
disease toward end stage as well as to cardiovascular events such as heart attack and stroke. Proteinuria is an important co-morbidity in hypertensive with chronic kidney disease and increase risk of disease progression and cardiovascular events. The National Kidney Foundation clinical practice guidelines recommend a blood pressure goal of less than130 mmHg systolic and less than 80 mmHg diastolic for all chronic kidney disease patients.
Flack.J.M, et al.(2005) stated the prevention of hypertension and its complications in his study elevated blood pressure, particularly systolic blood pressure, has been linked to multiple adverse clinical outcomes including stroke, heart failure, myocardial infarction, renal failure, peripheral vascular disease, retinopathy, dementia, and premature mortality. In hypertensive persons with reduced kidney function and proteinuria, lowering blood pressure with multidrug therapy that is inclusive of pharmacologic modulators of the renin-angiotensin-aldosterone-kinin system is an effective strategy to forestall the progressive loss of kidney function. The totality of data support low therapeutic blood pressure targets for persons with proteinuria >1 gm/dl.
21
Whitworth.J.A, et al.(2005) conducted the study on progression of renal failure in Annals Academy Of Medicine Singapore. He stated that High blood pressure plays a key role in the progression of renal failure. Hypertension is a common presentation of kidney disease and an almost invariable accompaniment of renal failure. Hypertension is also a major contributor to cardiovascular disease, the major cause of morbidity and mortality in renal failure. Hypertension is both cause and consequence of renal failure. There is strong evidence that hypertension accelerates the progression of experimental renal disease and that control of blood pressure is effective in preventing this progression.
Garcia Cortes.M.J, et al.(2004) conducted the study on hypertension in hemodialysis patients in Andalucia. The study population included 2,789 hypertensive patients enrolled in 46 hemodialysis centers in Andalucia. Hypertensive patients were divided into 4 groups of severity according to the number of antihypertensive drugs received. Comparisons between groups were done. The results show that a hypertension prevalence of 53.8% in comparing clinical data of no hypertensive and hypertensive patients, we observed that patients with hypertension were significantly younger (60.2 +/- 15.6 vs. 63.5 +/- 15 years; P <0.001) and had shorter time on dialysis (months) (56.5 +/- 60 vs. 67.3 +/- 68.2; P = 0.001). Coronary heart disease (P< 0.001) and diabetes (P < 0.001) were associated with hypertension.
22
because they carry a greater cardio vascular risk across the entire spectrum of chronic kidney disease. In these patients, achievement of lower blood pressure levels also is fundamental to limit the progression of renal damage, especially in the presence of significant proteinuria.
Domenic.A, et al.(2003) stated that the impact of hypertension on highly vascular organs such as the kidney can be particularly devastating. Irrespective of the genesis of hypertension, the kidney becomes a target organ for hypertension-related damage. If hypertension goes untreated, renal failure progresses, and reaches end-stage.
Hall.J.E, et al.(2003) conducted study on impact of the obesity epidemic on hypertension and renal disease. He stated that excess weight gain is a major cause of increased blood pressure in most patients with essential hypertension, and also greatly increases the risk for renal disease. Obesity raises blood pressure by increasing renal tubular reabsorption, impairing pressure natriuresis, causing volume expansion due to activation of the sympathetic nervous system and renin-angiotensin system, and by physical compression of the kidneys, especially when visceral obesity is present. With prolonged obesity, there may be a gradual loss of nephron function that worsens with time and exacerbates hypertension. Weight reduction is an essential first step in the management of obesity hypertension and renal disease.
23
filtration. One of the most important factors in the progression of Chronic Renal Failure is activation of the rennin-angiotensin system. Its effect is not only elevated blood pressure, but also the promotion of cell proliferation, inflammation and matrix accumulation.
Ronald.M, et al (2002) stated that hypertension can be related to chronic kidney disease in a number of ways. Studies show that the risk of having hypertension in chronic kidney disease patients is increased with advancing age, higher body weight. Increased activity of the sympathetic nervous system, causing an adrenaline surge. Hormonal mechanisms also play an important role in the link between chronic kidney disease and hypertension, primarily via the renin-angiotensin system; it contributes hypertension by stimulating salt retention and constriction of blood vessels. Para thyroid hormone that may raise blood pressure and has increased quantities with advancing chronic kidney disease. To slow the progression of chronic kidney disease and reduce the risk of heart disease controlling the blood pressure is important. Patients that lose a significant amount of protein in the urine are risk for progressive kidney disease and heart disease.
24
clearances below 30 ml/min. The Joint National Committee VI recommends the use of angiotensin-converting enzyme inhibitors in patients with hypertension and chronic renal disease to control hypertension and to slow progressive renal failure. Antihypertensive treatment with angiotensin-converting enzyme inhibitors may favorably alter renal hemodynamics, thereby slowing the progression of renal dysfunction.
Jafer.T.H, et al.(2001) conducted the study on proteinuria as a modifiable risk factor for the progression of non-diabetic renal disease. Data were analyzed from 1860 patients enrolled in 11 randomized controlled trials comparing the effect of antihypertensive regimens, including angiotensin converting enzyme inhibitors to regimens not including angiotensin converting enzyme inhibitors on the progression of non-diabetic renal disease. Mean baseline urine protein excretion was 1.8 (0.94) gm/day. After controlling for the current level of urine protein excretion, the beneficial effect of angiotensin converting enzyme inhibitors remained significant [relative risk for angioensin converting enzyme inhibitors vs. control was 0.66 (0.52 to 0.83)], but there was no significant interaction between the beneficial effect of angiotensin converting enzyme inhibitors and the baseline level of urine protein excretion.
25
mortality rate of the renal hypertensive after 5 years was only 20%. In renal hypertension the survival rate was extremely low when the patients had high diastolic pressure, severe cardiac and cerebrovascular complication. The prognosis of essential hypertension was poor in the order of severe cerebrovascular complication, renal complication and cardiac complication. The patients with both renal and essential hypertension showed greater survival rate when the blood pressure was much more reduced by bed rest or antihypertensive drugs
26
27
CONCEPTUAL FRAMEWORK
The conceptual framework deals with the inter- related concept that are assessable together in some rational schemes by virtue of their response to the common theme. Polit & Beck( 2004).
This chapter deals with conceptual framework adopted for this study. A conceptual framework is comprised of interrelated concepts of the natural phenomena. Epidemiology is the basis for disease prevention and health promotion.
Epidemiological information plays an important role in public health objectives aimed at promoting physical, mental, social well-being in the population. Epidemiological findings contribute to preventing and controlling disease by providing information that leads to informed public health policy and planning as well as individual health decision making.
During the present century, medical and social progresses have reduced the impact of infectious diseases on society and have increased public health concern with non-infectious chronic diseases. Difficulties have been encountered in applying the concept of agent to many of the chronic diseases.
28
failure. By looking at the next level above this, however, we find hypertension, which is a possible point for intervention. We can treat hypertension with an array of highly effective drugs.
Epidemiological triad helps to harvest the valid and precise information about the causes, preventions, and treatments for disease. The triad consists of an external agent, a host and an environment in which the host and agent are brought together causing the disease to occur in the host.
The triangle has three corners: Agent that causes the disease
Host or organism harbouring the disease
Environment or those external factors that allow or cause disease
The mission is to break at least one of the sides of the triangle, disrupting the connection between the environment, the host and the agent and interrupting the continuation of disease.
The use of a settings framework is useful for conceptualizing and planning interventions and actions. Within each setting, a broad view is needed, and the epidemiological triad helps identify strategies for action.
Agent
29
In the kidneys there are changes both in glomeruli as well as end arteries, where in there is hyaline deposition, basement membrane thickening and narrowing of the capillary lumina which leads on to chronic kidney disease, owing to constant proteinuria, hematuria.
Host
Host factors are modifiable and non-modifiable. Modifiable risk factors includes life style modification, sedentary habits, individual attitudes, poor perception of blood pressure control, non compliance and is regular follow up, irregular monitoring the blood parameters like urea, creatinine.
Non-modifiable factors includes age, gender, and genetics. Environment
Environment provides the „structure‟ within which people live and as such are powerful determinants of behaviours. Environment factors are internal and external.
Internal environment includes stress, hormonal changes, hereditary.
External environment includes physical, economical status, socio cultural factors, non compliance of regular annual check-up, and non-compliance of drug therapy.
30
Environment-related solutions can be physical (changing structures and availability of goods, services, amenities), economic (influencing cost of goods and services and incomes to pay for them), policy oriented (altering the rules), and socio cultural (influencing attitudes, beliefs, and perceptions).
31
Figure: 1 Conceptual Framework based on Epidemiological Triad Impact of Hypertension on
Renal Disease
HOST
Modifiable
a) Poor blood pressure control b) Non compliance to treatment
modalities
c) Irregular monitoring the blood parameters like urea, creatinine
Non-modifiable Age, gender, genetics AGENT
a) Uncontrolled hypertension b) Chronic hypertension c) Hypertensive renal disease d) Sedentary life style e) Aging
f) Smoking g) Heart disease h) Stress
ENVIRONMENT
Internal environment
Stress, hereditary, hormonal changes External environment
a) Low socio economic status b) Non compliance of drug therapy
32
CHAPTER III
RESEARCH METHODOLOGY
Methodology of research refers to the investigation of the ways of obtaining, organizing and analyzing data. Methodological study addresses the development in validation and evaluation of research tools and methods. -Polit [2004]
This chapter deals with research approach, research design, setting, population, sampling, sample size, sampling technique, exclusion criteria, inclusion criteria, development and description of tool, validity, reliability, pilot study, data collection procedure, data analysis and protection of human rights.
The aims of retrospective study to assess the impact of hypertension on renal disease among renal patients in MIOT Hospital, Chennai.
Research Approach
The research approach used for this study was quantitative approach.
Research Design
The retrospective research design was used for this study.
Setting
33 Population
The population of this study was renal patients attending the nephrology outpatient department in MIOT Hospitals, Chennai.
Sample
The sample was 150 patients with hypertension with renal failure in MIOT Hospitals, Chennai.
Sample Size
The sample size was 150 patients with hypertension and renal disease of both the genders.
Sampling Technique
Sampling technique used for finding the prevalence of hypertension among renal disease patients was purposive sampling method and convenient sampling method was used to assess the impact of hypertension.
Inclusion Criteria
Renal patients attending nephrology outpatient department. Patients who can understand Tamil and English.
Exclusion Criteria
Patients not willing to participate in the study. Renal patients with any other chronic illness.
34
Data Collection Tool
Description of the Tool
Part A
Demographic profile of the patient. It includes age, sex, marital status, occupation, religion, educational status, diet pattern, place of residence, nationality, type of family, leisure time activity, habits, habits of regular exercise.
Part B
Section I: Clinical data includes, year of hypertension, year of renal disease, present
and past blood pressure recording, symptoms, signs, cardiovascular system, respiratory system, gastrointestinal systems, central nervous system, lab investigation, impression, medical and non-medical management.
Section II: Hypertension and Renal Disease related Checklist. The checklist with 15
questions to assess the impact of hypertension among renal disease patients.
Scoring and interpretation:
Question no 1,2,9,10,12a,12b,12c12d,12e,12f,13 scores for ‘Yes’-0; ‘No’-1. Question no 3,4,5,6a,6b,6c,6d,6e,6f,7,8,11,14,15 scores for ‘Yes’-1; ‘No’-0
Total score is 25; the score was interpreted as follows, Mild impact - <50%
35 Validity
Validity of the tool was obtained from experts in the field of Nursing and
Nephrology.
Reliability
The reliability of the tool was established through pilot study by inter rater testing method, the obtained score was r= 0.98.
Pilot Study
In order to check the feasibility, reliability and practicability of the study, a pilot study was conducted after permission due for a period of one week from 31.03.2011 to 5.04.2011. The study was conducted on 20 patients with hypertension and renal disease in Nephrology outpatient department at MIOT Hospitals, Chennai. The data was collected by the investigator using a clinical data and checklist. The result proved that the tool was valid and reliable.
Data Collection Procedure
36
disease patients and the purpose of the study was explained. The informed consent was obtained from the hypertensive with renal disease patients. The prevalence of hypertension in renal disease patients was identified with patient’s clinical records by purposive sampling method. Through purposive sampling method the investigator identified 451 hypertensive patients in renal disease. Out of these identified patients the investigator selected 150 patients diagnosed to have hypertensive with renal disease by convenient sampling method. Interview method was used to ask question in demographic variables and checklist. Clinical data was identified from patient’s old records and clinical file. The data collection was done from 31.05.2011to 09.07.2011(6 days per week) as per the following schedule:
Weeks Number of samples
1st Week 22
2nd Week 29
3rd Week 27
4th Week 24
5th Week 25
37
Human Rights Protection
38
CHAPTER IV
DATA ANALYSIS AND INTERPRETATION
Analysis is defined as the method of organizing data in such a way that the research questions can be answered. Interpretation is the process of making sense of the results and of examining the simplification of the findings with in a broader context. Polit & Beck(2004).
This chapter deals with analysis and interpretation of the findings. The data were collected from the hypertension with renal disease patients to assess the prevalence of hypertension among renal disease patient and impact of hypertension on renal disease.
The study findings are presented in the following sections.
Section I : Prevalence rate of hypertension among renal disease patient.
Section II : Distribution of sample according to the demographic characteristics.
Section III : Distribution of impact of hypertension on renal disease.
Section IV : Association between demographic variables and checklist score of hypertensive patients with renal disease.
39 Section I
[image:52.595.106.530.267.556.2]This section presents prevalence of hypertension among renal disease patients.
Table 1: Prevalence of hypertension among renal disease patients attending
nephrology outpatient department.
N=1544.
The above table shows that 1544 patients attended nephrology outpatient department during data collection period. Among them 451 patients had hypertension. Prevalence rate was estimated to be 292.1 per 1000 renal patients.
Weeks Total no of patients
attended the outpatient
department.
Prevalence of
hypertension among renal
patients
Percentage
1st Week 173 55 31.79
2nd Week 328 98 29.88
3 rd Week 272 76 27.9
4th Week 318 89 28.0
5th Week 224 61 27.2
6th Week 229 72 31.4
40 Sections II
[image:53.595.119.526.216.750.2]This section describes the demographic variables of hypertension with renal disease patients.
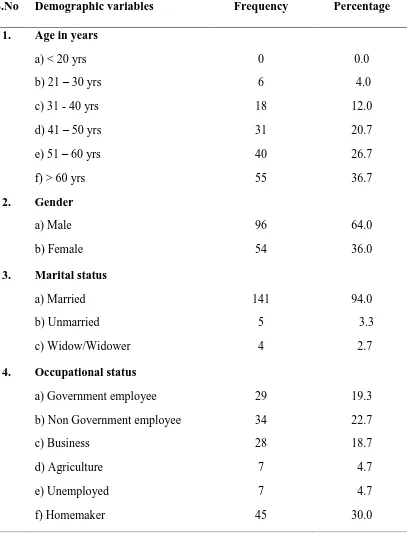
Table 2: Distribution of demographic variables among renal patients.
n=150
S.No Demographic variables Frequency Percentage
1. Age in years
a) < 20 yrs b) 21 – 30 yrs c) 31 - 40 yrs d) 41 – 50 yrs e) 51 – 60 yrs f) > 60 yrs
0 6 18 31 40 55 0.0 4.0 12.0 20.7 26.7 36.7 2. Gender
a) Male b) Female 96 54 64.0 36.0 3. Marital status
a) Married b) Unmarried c) Widow/Widower 141 5 4 94.0 3.3 2.7 4. Occupational status
41 5. Religion
a) Hindu b) Muslim c) Christian 134 6 10 89.3 4.0 6.7 6. Educational status
a) Illiterate b) Primary
c) Secondary school d) Higher Secondary e) Diploma
f) Graduate & above
8 6 15 49 10 62 5.3 4.0 10.0 32.7 6.7 41.3 7. Diet pattern
a) Vegetarian b) Non Vegetarian
53 97
35.3 64.7 8. Residence
a) Urban b) Rural
125 25
16.7
9. Type of family
a) Nuclear family b) Joint family
104 46
69.3 30.7 10. Leisure time activity
a) Watching TV b) Gardening
c) Reading books/newspaper
42
Table 2 shows that 36.1% of the patients were above 61years of age , 64% were male, 94% of them were married; 41.3% were graduate, 64.7% were non-vegetarian, most of them(69.3%) were nuclear family,32% of them were smokers, majority of the patients were not following the regular exercise.
11. Habits
a) Smoking b) Alcoholism c) Drug abuse d) Tobacco
48 25 0 4
32.0 16.7 0.0 2.7 12. Habits of regular exercise
a) Yoga b) Meditation c) Physical exercise
3 4 12
[image:55.595.109.515.114.335.2]43 Section III
[image:56.595.119.503.249.563.2]This section presents the impact of hypertension on renal disease.
Figure 2: Mean blood pressure value before and after diagnosis of renal disease
among hypertensive patients.
n= 150
Figure 2 shows that before diagnosis renal disease, mean systolic and diastolic blood pressure respectively were 156.33 and 93.60 mm Hg; after diagnosing renal disease mean systolic and diastolic blood pressure respectively were 168.27 and 96.93.This shows that after renal damage the blood pressure is elevated.
156.33
168.27
93.6 96.93
15.12 19.86
7.35 8.11
0 20 40 60 80 100 120 140 160 180
Before diagnosis After Diagnosis
SBP Mean
DBP Mean
SBP SD
44
Table 3: Changes of mean blood pressure before and after diagnosing renal
disease among hypertensive patients.
n=150
Note: *** - P<0.001 Level of significant
Table 3 shows that changes of blood pressure before and after diagnosing renal disease, systolic blood pressure mean was 11.93, standard deviation is 20.94.Diastolic blood pressure mean was 3.33 and standard deviation was 9.60. Which was significant at P<0.001.
Blood pressure Changes in blood pressure Paired t test and P value
Mean Standard
Deviation
Systolic blood pressure
11.93 20.94 t = 6.979, P = 0.000
***
Diastolic blood pressure
3.33 9.60 t = 4.252, P = 0.000
45
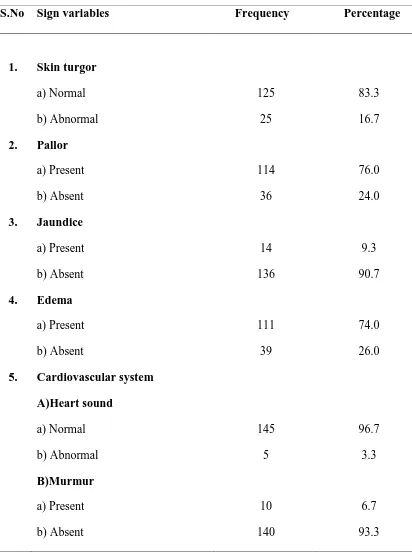
Table 4: Distribution of sign variables among renal patients.
n= 150
S.No Sign variables Frequency Percentage
1. Skin turgor
a) Normal b) Abnormal 125 25 83.3 16.7 2. Pallor
a) Present b) Absent 114 36 76.0 24.0 3. Jaundice
a) Present b) Absent 14 136 9.3 90.7 4. Edema
a) Present b) Absent 111 39 74.0 26.0 5. Cardiovascular system
46
Table 4 shows that 74% of patients had edema, 7.3% of patients had ascites. 6. Respiratory system
a) Rate b) Rhonchi c) Wheeze d) Any other
18 5 20
1
12.0 3.3 13.3 0.7 7. Gastrointestinal system
a) Abdominal distension b) Ascites
c) Visceromegaly
22 11 14
14.7 7.3 9.3 8. Central nervous system
a) Less Power of muscle strength b) Abnormal reflexes
3 2
47
Table 5: Frequency distribution of symptoms among hypertensive patients with
renal disease.
n= 150
S.No Demographic variables Frequency Percentage
1. 2. 3. 4. 5. 6. 7. 8. 9. 10. 11. 12. 13. 14. 15. 16. Generalized weakness Headache Tiredness Irritability
Loss of concentration Giddiness
Syncope
Puffiness of face Swelling of legs Dyspnea
Cough
Loss of appetite Nausea & vomiting
48
Table 5 shows that some of the patient are volume overloaded in that 40% of patient had facial swelling, 74.7% of patient had lib swelling.53.3% patient had reduced urine output, patient had urinary abnormalities in the form of 14.7% frothy urine and hematuria 3.7%.
17. 18.
Hematuria Epistaxis
5 2
49
Table 6: Association between systolic blood pressure with selected symptoms
among renal patients.
n = 150
Note: * - P<0.05 Level of Significant.
Table 6 reveals that there is a significant association between the systolic blood pressure, headache (P=0.047) and dyspnea (P=0.029).
S.No Selected
symptoms
Symptoms response and systolic blood pressure
Independent
t-test and
P – value
No Yes
Mean blood pressure Stantard deviation (n) Mean blood pressure Standard deviation (n)
1. Generalized weakness
162.3 17.4 (13) 168.8 20.0 (137) t = 1.133 P = 0.259 2. Headache 165.9 18.1 (99) 172.7 22.4 (51) t = 2.033
P = 0.047 * 3. Puffiness
of face
167.1 18.1 (90) 170.0 22.2 (60) t = 0.872 P = 0.385 4. Swelling
of legs
165.2 16.6 (38) 169.3 20.8 (112) t = 1.080 P = 0.282 5. Dyspnea 164.3 15.9 (67) 171.4 22.1 (83) t = 2.211
[image:62.595.103.549.195.590.2]50
Table 7: Association between diastolic blood pressure with selected symptoms
among renal patients.
n =150
Note: * - P<0.05 Level of Significant.
Table 7 shows that there is a significant association between the diastolic blood pressure and headache (P=0.012).
S.No Selected
symptoms
Symptoms response and diastolic blood pressure
Independent
t test and
P – value
No Yes
Mean blood pressure Standard deviation Mean blood pressure Standard deviation (n)
1. Generalized Weakness
92.3 4.4 (13) 93.7 7.6 (137) t = 0.662 P = 0.509 2. Headache 92.5 7.7 (99) 95.7 6.1 (51) t = 2.539
P = 0.012 * 3. Puffiness
of face
93.7 7.4 (90) 93.5 7.3 (60) t = 0.136 P = 0.892 4. Swelling
of legs
93.2 7.0 (38) 93.7 7.5 (112) t = 0.428 P = 0.669 5. Dyspnea 93.4 6.6 (67) 93.7 7.9 (83) t = 0.249
[image:63.595.93.530.195.589.2]51
Table 8: Descriptive statistics of clinical variables among renal patients.
n=150
S.No Blood pressure Mean Standard
deviation
Range
Minimum
Maximum
1. Temperature 98.51 0.25 97.8 100.0
2. Pulse Rate 84.12 5.62 62 102
3. Respiratory Rate 24.00 5.78 20 30
4. Systolic blood pressure
168.27 19.86 140 250
5. Diastolic blood pressure
96.93 8.11 80 130
6. Weight 62.52 10.67 36.4 91.6
7. Height 160.80 7.99 143.0 182.0
8. BMI 24.14 3.30 15.8 31.9
[image:64.595.115.532.155.629.2]52
Table 9: Descriptive statistics of lab investigation variables among renal patients.
n =150
S.No Lab investigation
variables
Mean Standard
deviation
Range
Minimum
Maximum
1. Hemoglobin 10.08 1.90 4.9 14.7
2. Packed cell volume 33.38 26.50 10.9 44.9
3. White blood count 8145.99 2582.51 5260 18100
4. Blood urea 90.13 32.91 42 191
5. Serum creatinine 5.05 2.89 1.4 15.7
6. Blood sugar 99.67 14.70 70 161
7. Serum potassium 5.10 0.74 3.7 7.5
8. Serum sodium 139.47 3.85 126 151
9. Serum Calcium 8.84 0.71 5.7 10.3
10. Serum phosphorus 4.90 1.12 3.1 9.3
11. Serum chloride 105.53 5.44 90 119
12. Serum bicarbonate 19.42 2.78 12 24
13. Uric acid 6.69 1.76 3.6 13.2
14. Serum total protein 7.04 0.59 5.4 8.2
53
Table 9 shows that patients have hemoglobin range from 4.9 to 14.7gm/dl, blood urea range from42 to 191 mg/dl, serum creatinine ranges from 1.4to 15.7 mg/dl, serum potassium ranges from 3.7 to 7.5 meq/l, and serum sodium ranges from 126-151 meq/l.
16. Serum globulin 3.27 0.50 2.2 4.6
[image:66.595.99.544.116.183.2]54
Table 10: Correlation between lab investigations with blood pressure among
renal patients.
n =150
Note: * - P<0.05 Level of Significant.
Table 10 results that there is a significant association between the blood pressure and hemoglobin (0.028), packed cell volume (0.028), creatinine (0.018), calcium (0.002), uric acid (0.028), and total protein (0.028). There is a positive correlation between the blood pressure and creatinine (0.193). This implies that patient with uncontrolled hypertension will have high risk of elevated serum creatinine that is uncontrolled hypertension have proponderness in progression of renal failure.
S.No Lab investigation Blood pressure
Systolic blood pressure Diastolic blood pressure
r – value P – value r – value P – value
1. Hemoglobin -0.180 0.028* 0.050 0.540
2. Packed cell volume -0.180 0.028* 0.050 0.540
3. Urea 0.021 0.798 -0.064 0.439
4. Creatinine 0.193 0.018 * 0.098 0.233
5. Blood Sugar 0.010 0.901 -0.149 0.068
6. Potassium -0.063 0.442 0.095 0.248
7. Sodium -0.140 0.087 -0.117 0.155
8. Calcium -0.250 0.002 ** -0.102 0.213
9. Phosphorus 0.0 1.0 -0.046 0.576
10. Uric acid -0.182 0.026 * -0.099 0.229
55
Figure 3: Distribution of urine test variables among renal patients
n =150
The figure 3 shows that 52.7% of patient have urine albumin 2+, 8.7% of patients have no albuminuria. Patients those lose a significant amount of protein in the urine are at somewhat higher risk, both for progression of kidney disease and heart disease. Currently, guidelines support a goal blood pressure less than 130/80 mm Hg for all patients with chronic kidney disease and less than 125/75mm Hg for those patients losing more than one gram of protein in the urine per day.
0% 10% 20% 30% 40% 50% 60% 70% 80% 90% 100%
Nil Trace 1+ 2+ 3+ 4+
8.70%
4.70%
20.00%
52.70%
13.70%
0.70%
56
Table 11: Distribution of radiological and imaging investigations among renal
patients. n=150
[image:69.595.107.530.136.554.2]
Table 11 shows that in ultrasound 83.3% of patients had shrunken kidney, 24.7% of patient had criteria qualifying for cardiac enlargement chest X-ray; of which 41.3% of patients had left ventricular hypertrophy in electrocardiogram continued 38.7% of patients had left ventricular hypertrophy in echocardiogram. 24.7% of patients had cardiac enlargement in chest X-ray. In ultrasound 83.3% of patients had shrunken kidney. This implies that hypertensive patients in renal disease have more chances of cardiac problems.
S.No Radiological and imaging Frequency Percentage
1. Ultrasound – kidney size
a) Normal b) Enlarged c) Shrunken 18 7 125 12.0 4.7 83.3 2. Ultrasound – Liver
a) Enlarged b) Not Enlarged
39 109
26.0 72.7 3. Electrocardiogram
a) Left ventricular hypertrophy b) Arrhythmias
62 5
41.3 3.3 4. Echocardiogram
a) Left ventricular hypertrophy 58 38.7
5. Chest x-ray cardiac enlargement
a) Present b) Not Present
37 113
57
Table 12: Distribution of treatment – non medical and medical management
among renal patients.
n =150
S.No Management Frequency Percentage
1. Stress management technique
a) Yoga b) Meditation 3 3 2.0 2.0 2. Fluid restriction per day
a) 500 ml/day b) 1 lit/day c) 1.5 lit/day d) 2 lit/day
6 10 116 18 4.0 6.7 77.3 12.0 3. Salt restricted diet
a) No salt b) 1 gm c) 2 gm d) 3 gm
8 55 80 7 5.3 36.7 53.3 4.4 4. Weight reduction technique
a) Exercise b) Diet 31 149 20.7 99.3 5. Life style modification
a) Smoking cessation b) Avoid alcohol intake
149 150
58
Table 12 shows that most of the patients (85.3%) take calcium channel blockers. Many of them were taking calcium (86.7%), Iron (57.3%), and bicarbonate (77.3%) supplements. Almost all patients come for regular follow-up to renal outpatient department.
6.
Medical Management :
Antihypertensive drugs:
a) Alpha-1 adrenoceptor blocker b) Alpha-2 agonist
c) Calcium channel blockers
d) Angiotensin II receptor antagonist e) Beta blockers
31 25 128 14 87 20.7 16.7 85.3 9.3 58.0
7. Calcium and vitamin D supplements
a) Yes b) No 130 20 86.7 13.3 8. Iron supplements and erythropoietin drugs
a) Yes b) No 86 64 57.3 42.7 9. Bicarbonate supplements
a) Yes b) No 116 34 77.3 22.7 10. Regular follow up
[image:71.595.120.518.130.594.2]59
Table 13: Descriptive statistics on check list for hypertension with renal disease
score among renal patients.
n=150
S.No Mean Standard
deviation
Range
Minimum Maximum
1. 13.98 3.15 6 21
60
Table 14: Distribution of check list responses.
n=150
Checklist
questions
Yes No
Frequency Percentage Frequency Percentage
61
[image:74.595.111.510.112.434.2]62
Figure 4: Distribution of impact of hypertension on renal disease.
n =150
Figure 4 shows that 62.7% of patients had moderate impact, 31.3% of patients had mild impact, and 6% of patients had severe impact of hypertension on renal disease.
31.30%
62.70%
6%
63
Figure 5: Distribution of impression on hypertension among renal patients.
n=150
Figure 5 shows that all patients had hypertension with renal disease, 46.7% of patients had hypertension with cardiac problems. The result implies hypertension has more impact on renal disease as well as in cardiac problems. Renal patients should control their blood pressure to prevent cardiac problems.
0 10 20 30 40 50 60 70 80 90 100
HT&Renal Disease.
HT&Cardiac problems
HT&CNS problems 100
46.7