JOURNAL OFVIROLOGY,
0022-538X/99/$04.0010 Feb. 1999, p. 1630–1636 Vol. 73, No. 2
Copyright © 1999, American Society for Microbiology. All Rights Reserved.
Expression of Epstein-Barr Virus Nuclear Antigen 1 Is
Associated with Enhanced Expression of CD25
in the Hodgkin Cell Line L428
D. KUBE,1,2* M. VOCKERODT,1,2O. WEBER,3K. HELL,4J. WOLF,1B. HAIER,1F. A. GRA¨ SSER,5 N. MU¨ LLER-LANTZSCH,5E. KIEFF,6V. DIEHL,1ANDH. TESCH1
Klinik fu¨r Innere Medizin I,1Zentrum fu¨r Molekulare Medizin der Universita¨t Ko¨ln,2and Institut fu¨r Pathologie
der Universita¨t Ko¨ln,4Cologne, Institut fu¨r Virologie der Universita¨t Homburg, Homburg,5and Bayer AG,
Wuppertal,3Germany, and Department of Medicine and Microbiology and Molecular Genetics,
Harvard Medical School, Boston, Massachusetts6
Received 30 June 1998/Accepted 20 October 1998
Epstein-Barr virus is associated with several human malignancies including Burkitt’s lymphoma, nasopha-ryngeal carcinoma, and Hodgkin’s disease (HD). To examine the effect of Epstein-Barr virus nuclear antigen 1 (EBNA-1) in the pathogenesis of HD, we transfected the gene into the HD cell line L428. EBNA-1 expression
was associated with significantly enhanced CD25 expression (interleukin 2 [IL-2]-receptorachain) in
tran-sient and stably transfected L428 cells but did not affect the expression of IL-2 receptorbandgchains. There
was no up-regulation of the B-cell activation molecules CD23, CD30, CD39, CD40, CD44, CD71, and CD54 (intercellular adhesion molecule 1) or enhanced production of IL-6, IL-10, lymphotoxin alpha, and the soluble form of CD25. Stable EBNA-1-expressing L428 cells were nontumorigenic in SCID mice but showed enhanced lymphoma development in nonobese diabetic-SCID mice compared to mock-transfected cells.
Hodgkin’s disease (HD) is characterized by a disruption of the lymph node architecture with low numbers of Hodgkin and Reed-Sternberg (H-RS) cells surrounded by an abundance of reactive nonmalignant cells (2, 9, 13, 26). This histological pattern of HD is probably due to the production and release of cytokines by H-RS cells which are involved in the biology of HD (19).
In HD, Epstein-Barr virus (EBV) is present in more than 50% of cases and has been suggested to be a critical element in the pathogenesis of the disease (1, 7, 12, 23, 36). Epidemio-logical studies first indicated a link between EBV and HD and showed an increased risk of developing HD in patients with infectious mononucleosis and elevated EBV-VCA titers. More direct evidence came from molecular studies, which demon-strated the presence of EBV sequences and antigens in H-RS cells (2, 12, 33). The latent membrane protein 1 (LMP-1) is detectable in H-RS cells in the absence of the EBV nuclear antigen 2 (EBNA-2), which can transactivate LMP-1 and a subset of cellular genes in B cells (3, 35). Both EBNA-1 and LMP-2A were also found to be expressed in H-RS cells by immunostaining (7, 11, 24).
EBV is involved in the pathogenesis of a number of different human tumors, including immunoblastic B-cell lymphomas of immunocompromised patients, endemic Burkitt’s lymphoma, certain T-cell lymphomas, and nasopharyngeal carcinoma (NPC) (2, 6, 26). All EBV-associated tumor cells carry episo-mal copies of the EBV genome, and the EBER genes (sepiso-mall untranslated nonpolyadenylated nuclear viral RNAs) are abundantly expressed. The precise role of EBV in tumor de-velopment may be different in each disease, and a different expression pattern of viral genes can be observed in the tumor cells. The least complex case involves immunoblastic B-cell
lymphomas, where tumor cell growth appears to be directly EBV driven in a manner analogous to that of the lymphoblas-toid cell lines (LCLs) that arise when EBV infects normal resting B cells in vitro or in the absence of a functional immune system. Other EBV-associated tumors show a more restricted pattern of viral gene expression limited to EBNA-1 in Burkitt’s lymphoma only (known as latency type I) or to EBNA-1, LMP-1, and LMP-2A expression in HD and NPC (defined as latency type II) (26).
EBNA-1 is the only latent protein consistently expressed in all EBV-bearing tumor cells. Previously, it has been shown that a subpopulation of B lymphocytes express EBNA-1 mRNA in the absence of EBNA-2 or LMP-1, suggesting that the expres-sion pattern of EBV genes in lymphoma cells of latency type I is the same as that in normal B cells. This expression pattern reflects a strategy of EBV of persisting in a latent state while being unrecognized by immunosurveillance (5). It has been shown that EBNA-1 does not alter the phenotype of stably transfected BJAB lymphoma cells (35), but transgenic mice expressing EBNA-1 specifically in B cells develop B-cell lym-phomas (39). The role of EBNA-1 in HD is not clear yet.
We analyzed the effects of EBNA-1 on cell morphology, cell surface antigen, cytokine expression, and tumorigenicity in the HD cell line L428. L428 represents a cell line of B-cell origin and is characterized by the expression of many different sur-face antigens such as CD30, CD39, CD40, CD44, CD54 (in-tercellular adhesion molecule 1 [ICAM-1]), CD58 (lymphocyte function-associated antigen 3 [LFA3]), CD70, CD71, CD80 (B7.BB1), and major histocompatibility complex class II mol-ecules. L428 cells are not tumorigenic in immunodeficient nude or SCID mice (9, 34). The cells constitutively express a number of cytokines including tumor necrosis factor alpha, lymphotoxin alpha (LT-a), granulocyte-macrophage colony-stimulating factor, and interleukin 6 (IL-6) (19, 30). Further-more, L428 cells carry rearranged immunoglobulin (Ig) heavy-chain and Ig light-heavy-chain genes. Sequence analysis revealed that the rearranged VH gene (VH5) is characterized by a high * Corresponding author. Present address: Universita¨t Tu¨bingen,
In-stitut fu¨r Tropenmedizin Sektion Humanparasitologie, Wilhelmstrasse 27, D-72074 Tu¨bingen, Germany. Phone: 49 7071 2980 240. Fax: 49 7071 295189. E-mail: [email protected].
1630
on November 9, 2019 by guest
http://jvi.asm.org/
number of somatic mutations. Clonally related, highly mutated rearranged Ig genes have also been detected by single-cell analyses in most cases of primary HD (16). This indicates that the L428 H-RS cell, like primary H-RS cells, has probably undergone a complex maturation and differentiation process within the germinal center, where the transformation process may have occurred. This cell line provides a useful model system for analyzing the effect of EBNA-1 gene expression in HD. Therefore, we transfected the EBNA-1 gene in the HD cell line L428 and selected a number of EBNA-1-positive cell clones.
Transfection of EBNA-1 in L428 cells. To obtain stable
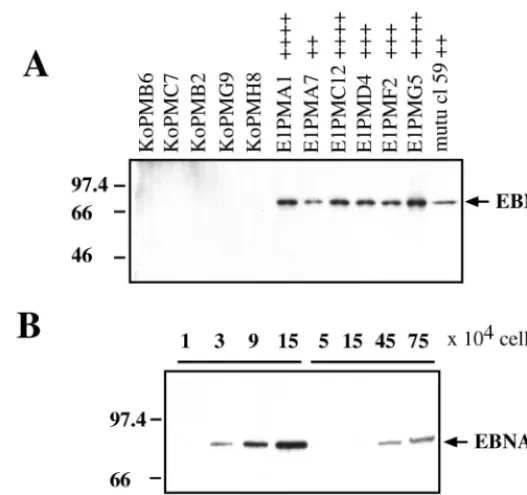
EBNA-1-expressing cells, L428 cells were cotransfected with pSG5 EBNA-1 expression plasmid or pSG5 vector control and a plasmid coding for puromycin-N-acetyltransferase with an electroporator (Easy-Ject electroporator; Eurogentec, Seraing, Belgium). After transfection, cells were grown under puromy-cin selection and 60 resistant clones were analyzed for EBNA-1 expression. A total of 15 independent EBNA-1-positive clones and 12 control clones (pSG5 vector) were included in this analysis from three independent transfection experiments. EBNA-1 expression was detected by immunoblotting with an EBNA-1-specific antibody (11) and the enhanced chemilumi-nescence (ECL) detection kit (Amersham Life Science, Braun-schweig, Germany). As depicted in Fig. 1A, the stably trans-fected L428 clones are characterized by different levels of EBNA-1 expression (indicated by “11” to “1111”), with up to 15-fold-higher levels of EBNA-1 compared to the LCL IARC 304 (Fig. 1B). EBNA-1 was detected over a period of more than 12 months.
To analyze the function of EBNA-1 in HD cells, EBNA-1-expressing and vector control L428 clones derived from inde-pendent transfections were assayed (i) morphologically; (ii) for the expression of B-lymphocyte activation markers (CD23, CD39, CD44, and CD71), the IL-2 receptor (IL-2R) complex
(CD25–IL-2Ra, CD122–IL-2Rb, and p65 gchains), mole-cules of the tumor necrosis factor-nerve growth factor recep-tor-ligand family (CD30 and CD40), and the cell adhesion molecule CD54–ICAM-1 by flow cytometry; (iii) for cytokine expression; and (iv) for tumorigenicity in SCID and nonobese diabetic (NOD)-SCID mice.
Expression of cellular surface antigens. Analysis of cell
[image:2.612.170.434.70.317.2]surface antigens was performed by flow cytometry with the FACScan (Becton Dickinson, Heidelberg, Germany). Values are presented as specific mean linear fluorescence intensities after subtraction of background staining with isotype-matched control. Dead cells were excluded by propidium-iodide stain-ing. The following monoclonal antibodies were used in this study: IgG1 fluorescein isothiocyanate (FITC)-phycoerythrin (PE), IgG2A FITC, anti-CD23-PE–low-affinity Fcεreceptor, anti-CD25-PE–IL-2R a chain, anti-CD54-PE–ICAM-1, and goat anti-mouse Ig-FITC (Becton Dickinson, BDIS, San Jose, Calif.); anti-CD39, anti-CD40-FITC, anti-CD122-PE–IL-2R bchain, and anti-IL-2Rgchain–PE (Pharmingen, San Diego, Calif.); anti-CD44 (R&D Systems, Abingdon, United King-dom); CD30-FITC (Dako, Glostrup, Denmark); anti-CD4-PE and anti-CD71-FITC–transferrin receptor (Immuno-tech, Marseille, France). Table 1 summarizes the results of the surface immunofluorescence analyses of five representative EBNA-1-expressing and vector control-fluorescein isothio-cyanate (FITC)-phycoerythrin (PE), transfected clones. No changes were found in the expression of the B-cell activation markers CD23, CD39, CD44, and CD71 and the cell adhesion molecule CD54. All analyzed clones showed low levels of CD23 and CD39 expression, while CD44, CD54, and CD71 were constitutively expressed at high levels without further significant alterations. CD30 and CD40, characteristic surface antigens in most cases of HD and HD-derived cell lines and constitutively expressed in L428 cells, were not affected by EBNA-1 expression.
FIG. 1. Immunoblot of EBNA-1 expression in L428 cells (A) and LCL 304 (B). The immunoblots were probed with rat anti-EBNA-1 (1H4) monoclonal antibody. (A) Representative vector control (pSG5–pSV-PAC) L428 clones and pSG5-EBNA-1–pSV-PAC-expressing L428 clones are shown. mutu cl59 was used as a positive control. Expression levels of EBNA-1 are indicated by “11” to “1111,” on a scale of one to four plus signs. (B) Comparison of EBNA-1 expression levels in EBNA-1-positive L428 clones and in the EBV-infected LCL IARC 304. Numbers at left indicate molecular mass in kilodaltons.
on November 9, 2019 by guest
http://jvi.asm.org/
Induction of CD25 by EBNA-1.As shown in Table 2, the expression of EBNA-1 is associated with a consistent enhanced CD25 expression, compared with CD25 levels in vector control cells. The CD25 expression level on vector-transfected cells ranged from 0.2 to 2.0 with an average mean fluorescence level
of 1. In the case of EBNA-1-expressing L428 cells, the expres-sion level of CD25 ranged from 0.2 to 33.8. These cell clones could be divided into two subgroups. Five of fifteen EBNA-1-expressing cell clones were characterized by CD25 expression levels which were comparable to that of control vector-trans-fected cells (mean fluorescence, 0.2, 0.9, 1.2, 1.6, and 2.0). However, 10 of 15 EBNA-1-expressing L428 clones showed CD25 expression levels which were higher than those in mock-transfected cells. There was a statistically significant difference between CD25 expression levels in EBNA-1-expressing cells and those in control clones as shown by the Mann-Whitney test (P 5 0.001). One EBNA-1-positive clone (L428E1P MG5) showed a high level of EBNA-1 expression without significant CD25 expression. This could have been due to secondary ef-fects during cell culture. However, the enhanced CD25 surface level correlated in the majority of clones with the level of EBNA-1 expression.
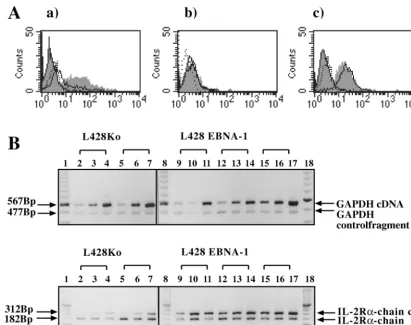
To determine whether L428 cells expressed the high-affinity IL-2R complex consisting of theachain (CD25), thebchain (CD122), and the p65gchain, we performed surface immu-nofluorescence stainings for these antigens. EBNA-1-positive and vector control clones showed low staining for thebchain, while the p65gchain was constitutively expressed in all L428 clones (Fig. 2A). Since the expression of thebchain and the p65 g chain of the IL-2R in L428 cells was not altered by EBNA-1, this further underlined the specific effect of EBNA-1 on CD25 expression. To determine whether the increase on the CD25 surface level was associated with changes in IL-2R a-chain mRNA levels, total cellular RNA from different trans-fected clones was analyzed by semiquantitative reverse tran-scription-PCR (RT-PCR) as previously described (37). L428 cells expressing EBNA-1 contained increased IL-2Ra-chain mRNA levels compared with vector control cells (Fig. 2B).
CD25 activation by EBNA-1 in L428 cells was also analyzed in a transient assay to confirm that the up-regulation of CD25 was EBNA-1 specific. After cotransfection of pMACS 4.1 (which encodes the extracellular domain of CD4 as a selection antigen) and pSG5 or pSG5-EBNA-1, we enriched transfected cells through immunomagnetic separation of CD4-positive cells with a magnetic cell sorting (MACS) system (Miltenyi Biotec, Bergisch Gladbach, Germany). Our results demon-strate that EBNA-1-positive cells express CD25 at up to two-fold-higher levels than do mock-transfected L428 cells (Fig. 3). This upregulation of CD25 by EBNA-1 in L428 cells was max-imal at 120 h after magnetic sorting.
The high levels of CD25 antigen on stable EBNA-1-express-TABLE 1. Surface phenotype of five representative clones of EBNA-1-expressing clones and vector control clonesa
Transfected clone CD23 CD30 CD39 CD40 CD44 CD71 CD54
Control
L428KoP N3 0 231.14 16.41 20.41 43.5 263.76 1,514.48
L428KoP N4 0 201.02 3.19 14.25 33.15 219.41 1,559.77
L428KoP N6 0.16 181.18 0.63 10.97 25.89 220.87 1,684.41
L428KoP 1D11 15.38 247.33 0 36.39 100.55 145.34 1,070.08
L428KoP 2C1 10.21 216 8.15 31.99 57.79 156.89 1,184.35
EBNA-1
L428E1P E1 39 0.55 212.29 2.84 15.53 49.5 191.51 1,523.4
L428E1P F1 40 1.94 217.24 4.46 14.2 37.96 163.72 1,394.7
L428E1P C5 2.63 237.45 3.31 28.91 58.06 175.39 1,317.6
L428E1P G4 11.69 221.44 7.38 44.04 118.31 211.4 1,289.9
L428E1P MF2 6.43 246.69 2.39 36.95 85.32 245.3 884.71
[image:3.612.52.551.79.219.2]aExpression of different surface antigens on transfected L428 cells was analyzed by flow cytometry. The data are presented as mean channel numbers for fluorescence intensity of one representative experiment of five. The mean fluorescence was calculated by using Becton Dickinson FACScan software.
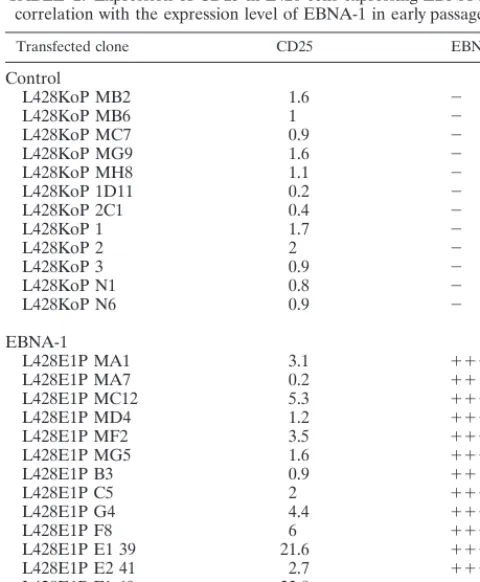
TABLE 2. Expression of CD25 in L428 cells expressing EBNA-1 in correlation with the expression level of EBNA-1 in early passagesa
Transfected clone CD25 EBNA-1
Control
L428KoP MB2 1.6 2
L428KoP MB6 1 2
L428KoP MC7 0.9 2
L428KoP MG9 1.6 2
L428KoP MH8 1.1 2
L428KoP 1D11 0.2 2
L428KoP 2C1 0.4 2
L428KoP 1 1.7 2
L428KoP 2 2 2
L428KoP 3 0.9 2
L428KoP N1 0.8 2
L428KoP N6 0.9 2
EBNA-1
L428E1P MA1 3.1 1111
L428E1P MA7 0.2 11
L428E1P MC12 5.3 1111
L428E1P MD4 1.2 111
L428E1P MF2 3.5 111
L428E1P MG5 1.6 1111
L428E1P B3 0.9 11
L428E1P C5 2 111
L428E1P G4 4.4 1111
L428E1P F8 6 111
L428E1P E1 39 21.6 1111
L428E1P E2 41 2.7 111
L428E1P F1 40 33.8 1111
L428E1P F2 42 9.9 1111
L428E1P F4 43 14.1 1111
aExpression of CD25 antigens on EBNA-1- or vector control-transfected L428 cells was analyzed by flow cytometry. The CD25 data are presented as mean fluorescence intensities of one representative experiment of five. The mean fluorescence was calculated by using the Becton Dickinson FACScan software. The expression level of EBNA-1 detected by ECL-Western blot staining was defined as no expression (2), low expression (11), high expression (111), or very high expression (1111), on a scale of one to four plus signs. To test whether the two groups (controls and EBNA-1 positive) differed in their CD25 expression, a Mann-Whitney test was performed (P50.001).
1632 NOTES J. VIROL.
on November 9, 2019 by guest
http://jvi.asm.org/
[image:3.612.53.293.361.652.2]ing cells were lost during prolonged cultivation of transfected cells even when the EBNA-1 expression was unchanged in these clones and the cells were grown under permanent selec-tion (Table 3). Therefore, increased CD25 levels in
[image:4.612.95.506.66.391.2]short-time-cultivated stably EBNA-1-expressing cells might reflect a high activation status of these cells. The loss of enhanced CD25 expression suggests a selection process in cell culture which may be directed against the expression of EBNA-1-induced genes. Another possibility is an enhanced shedding of CD25. It has been reported elsewhere that CD25 can be shed from the cell surface and can be detected in serum of HD patients and NPC patients (10, 15). Therefore, we analyzed soluble CD25 in
FIG. 2. Expression of IL-2R molecules in L428 cells expressing EBNA-1. (A) Surface phenotype analysis of L428 clones for CD25–IL-2Rachain (a), CD122–IL-2R
bchain (b), and IL-2Rgchain (c). EBNA-1-expressing L428 cells or vector control cells were stained with isotype controls and corresponding PE-conjugated antibodies directed against CD25, CD122, and IL-2gchain. Vector control cells were stained with isotype control (dashed outline and no shading) or with specific antibody (solid outline and no shading). EBNA-1-expressing clones were stained with isotype control (solid outline with shading) or with specific antibody (shading and no outline). In this analysis, the clones L428KoP N6 and L428E1P F1 were used. (B) Seminquantitative RT-PCR of total RNA isolated from L428 cells expressing EBNA-1 or vector-transfected control cells. RNA was reverse transcribed, and defined increasing amounts of cDNA were amplified with both glyceraldehyde-3-phosphate dehydrogenase (GAPDH)-specific oligonucleotides to normalize the amount of cDNA and IL-2Ra-chain-specific oligonucleotides. In both reactions, a control vector at fixed amounts carrying synthetic binding sites for glyceraldehyde-3-phosphate dehydrogenase–IL-2Ra-chain oligonucleotides was included (37). For this analysis, clones L428KoP N1, L428KoP N6, L428E1P F1, L428E1P E1, and L428E1P F4 were used (see also Table 2).
[image:4.612.72.275.533.680.2]FIG. 3. Expression of CD25 on the cell surface of transient-transfected L428 cells with EBNA-1 (shaded bars) or vector control (unshaded bars) and pMACS4.1 after MACS separation. The fraction of CD25-positive cells was evaluated 24, 96, and 120 h after MACS separation. A representative experiment of three independent transfection experiments and MACS enrichments is shown.
TABLE 3. Expression of CD25 on L428 cells expressing EBNA-1 in different cell culture passagesa
Transfected clone CD25 expression at passage:
Early Intermediate Late
L428E1P E1 39 21.6 12.5 2.4
L428E1P E2 41 2.7 2.4 2.2
L428E1P F1 40 33.8 16 1.7
L428E1P F2 42 9.9 6.9 2.1
L428E1P F4 43 14.1 8.8 0.7
aExpression of CD25 antigens on EBNA-1-expressing L428 clones was ana-lyzed by flow cytometry. The data are presented as mean channel numbers for fluorescence intensity of one representative experiment of five. The mean fluo-rescence was calculated by using the Becton Dickinson FACScan software. Early passage, 8 to 10 weeks after transfection; intermediate passage, 10 to 20 weeks after transfection; late passage, later than 6 months.
on November 9, 2019 by guest
http://jvi.asm.org/
[image:4.612.312.551.595.677.2]cell culture supernatants by enzyme-linked immunosorbent as-say (Amersham Life Science). No soluble CD25 was detected in the supernatants of EBNA-1-positive cells, revealing that the activation of CD25 by EBNA-1 and following subse-quent decrease of surface CD25 was not associated with increased levels of soluble CD25 in the supernatants (data not shown).
This EBNA-1-associated up-regulation of CD25 implies the possibility of IL-2 binding to L428 cells expressing this EBV gene and activating them. To analyze whether IL-2 can
pref-erentially stimulate EBNA-1-positive L428 cells, the cells were incubated with and without recombinant human IL-2 (100 U/ml) (Gibco Life Technologies) for up to 96 h. [3H]thymidine incorporation revealed no effect of IL-2 on the proliferation of EBNA-1-positive or -negative L428 cells, while freshly isolated T cells proliferated after addition of IL-2 (data not shown). Since the IL-2Rbchain was expressed at low levels in all L428 cell clones analyzed, the effect of IL-2 on the EBNA-1-express-ing L428 cells is probably mediated only as a low-affinity signal (14, 19), so that signals of IL-2 are possibly nonmitogenic.
FIG. 4. Lymphoma in NOD-SCID mice developed within 5 weeks after injection of EBNA-1-expressing L428 cells (L428E1P F1). (a) Lymphoma developed in the pancreas of a NOD-SCID mouse. The infiltrate has a sharp border towards the pancreas (magnification,3100). (b) Tissue sections were stained for expression of the HD-associated antigen CD30, showing a strong expression on the cell surface (magnification,3600).
1634 NOTES J. VIROL.
on November 9, 2019 by guest
http://jvi.asm.org/
Cytokine activation by EBNA-1.It has been shown that HD cell lines express a large number of cytokines (14, 19, 29, 30). To investigate whether EBNA-1 can influence cytokine expres-sion, we analyzed the expression of IL-6, IL-10, and LT-aby semiquantitative RT-PCR and enzyme-linked immunosorbent assay. In some but not all EBNA-1-positive clones (5 of 15), enhanced production of IL-6 was detected (800 pg/ml within 48 h compared to 150 pg/ml produced by the control cells), which reveals no direct involvement of EBNA-1. No significant changes were observed for IL-10 (negative) and LT-a (un-changed high-level expression), which are induced by EBV in Burkitt’s lymphoma (14, 20).
Enhanced lymphoma growth by L428 cells transfected with
EBNA-1 in mice.The parental cell line L428 is nontumorigenic
in SCID mice (34). To test the influence of EBNA-1 on the tumorigenicity of L428 cells, 107cells of EBNA-1 and control transfected L428 cells were injected intraperitoneally into five SCID mice. Mice were sacrificed after 10 weeks. No tumor growth was detected at this time and even when the mice were kept for longer times. However, with NOD-SCID mice 5 of 15 animals developed lymphomas within 5 weeks when EBNA-1-positive cells were inoculated, whereas with vector control-transfected L428 cells no lymphoma development was ob-served (0 of 15 animals analyzed). In addition, L428 cells expressing LMP-1 (0 of 5 animals analyzed) or EBNA-2 (0 of 5 animals analyzed) did not cause tumor growth in NOD-SCID mice.
The lymphomas that developed from EBNA-1-expressing L428 cells were characterized by a diffuse infiltration in various organs (pancreas, liver, bowel, kidney, skin, and muscle) (Fig. 4a) with characteristics of H-RS cells, and many mitotic and apoptotic cells were present; however, the bystander cell pop-ulation typical for HD was missing due to the absence of T and B cells in the mice. Immunohistochemical examination re-vealed a high CD30 expression on the lymphoma cells (Fig. 4b). Our result indicates that EBNA-1 can promote lymphoma growth in this animal system. The enhanced tumorigenicity of EBNA-1-positive L428 cells is compatible with results ob-tained in a transgenic mouse model where it was shown that the expression of EBNA-1 in B cells induces malignant B-cell lymphomas (39).
These findings suggest that EBNA-1 is able to modulate the expression of surface antigens and to enhance tumorigenicity in H-RS cells. CD25 levels were increased in EBNA-1-express-ing cells, although IL-2 did not affect cell proliferation. Similar findings have been described for B-cell chronic lymphocytic leukemia, where the neoplastic cells expressed only the IL-2R achain (CD25), while thebchain was only weakly expressed in a few cases (8, 17, 32). In addition, the proliferative response of chronic lymphocytic leukemia cells in the presence of even high doses of IL-2 is low (8). The activation of CD25 in ma-lignant cells may have different functions compared to that in T cells, where IL-2 induces proliferation and promotes expres-sion of its own receptor (4, 17). It has been reported elsewhere that direct activation of the protein kinase C or protein kinase A pathway leads to an induction of CD25 in high-density ton-sillar B cells (22). We have shown previously that treatment of L428 cells with phorbol myristate acetate leads to an induction of CD25 antigen expression and reflects a strong activation of these cells (29). Thus, CD25 induction could be a sec-ondary effect caused by EBNA-1 expression in L428 cells by a still-unknown pathway (27). The up-regulation of CD25 by EBNA-1 in L428 cells may have important functional signifi-cance, and the established EBNA-1-expressing L428 cells pro-vide a new tool to analyze this question in more detail. We and others have shown previously that primary H-RS cells regularly
express CD25, which indicates that this molecule might be involved in the biology of HD (31). EBNA-1 is expressed in a high proportion of EBV-positive HD cases in the H-RS cells and may play an important role in the pathogenesis of HD (11, 18, 25). Whether CD25 expression on primary H-RS cells is correlated with the presence of EBNA-1 in these cells has to be investigated.
The observed tumorigenicity of L428 cells after EBNA-1 transfection is compatible with results obtained in a transgenic mouse model where it was shown that the expression of EBNA-1 in B cells induced malignant B-cell lymphomas, fre-quently of follicular-center cell origin (39), demonstrating a tumorigenic potential for EBNA-1. However, the expression level of EBNA-1 detected in L428 cells in vitro was up to 15-fold higher than that in the LCL, suggesting that a high level of EBNA-1 is needed to induce phenotypic changes or tumor growth. In addition, primary H-RS cells and HD cell lines represent in most cases a population of germinal-center B cells with a high degree of preactivation of surface antigens and cytokine expression and thus represent a different status of activation compared to Burkitt’s lymphoma cells. When ex-pressed in Burkitt’s lymphoma, EBNA-1 has no effects on the surface phenotype, while the expression of the recombinase-activating genes RAG1 and RAG2 seems to be associated with EBNA-1 expression in some but not all analyzed Burkitt’s lymphoma lines. In the Burkitt’s-like lymphoma line BJAB or in different LCLs, RAG1 and RAG2 expression was not de-tected (21, 28). Thus, the effects of EBNA-1 are probably different in several cell types, depending on the differentiation stage and the preactivation of the cells (38).
The description of these specific effects of EBNA-1 on HD cells now provides an opportunity to dissect the mechanism by which EBV alters gene expression in HD and thus may con-tribute to the transformation and immune escape mechanisms of the transformed H-RS cells.
We acknowledge J. Franklin for help in the statistical analysis, J. B. Wilson for helpful discussions of the manuscript, and U. Meyer and H. Straub for technical assistance.
This work was supported by the Deutsche Forschungsgemeinschaft by a grant through the Sonderforschungsbereich 502.
REFERENCES
1.Anagnostopoulos, I., H. Herbst, G. Niedobitek, and H. Stein.1989. Demon-stration of monoclonal EBV genomes in Hodgkin’s disease and Ki-1-positive anaplastic large cell lymphoma by combined Southern blot and in situ hy-bridization. Blood74:810–816.
2.Anagnostopoulos, I., M. Hummel, and H. Stein.1996. Epstein-Barr virus and Hodgkin’s disease. Forum. Trends Exp. Clin. Med.6:36–50.
3.Armstrong, A. A., L. M. Weiss, A. Gallagher, D. B. Jones, A. S. Krajewski, B. Angus, G. Brown, A. S. Jack, B. S. Wilkins, D. E. Onions, et al.1992. Criteria for the definition of Epstein-Barr virus association in Hodgkin’s disease. Leukemia6:869–874.
4.Burton, J., and N. E. Kay.1994. Does IL-2 receptor expression and secretion in chronic B-cell leukemia have a role in down-regulation of the immune system? Leukemia8:92–96.
5.Chen, F., J. Z. Zou, L. di Renzo, G. Winberg, L. F. Hu, E. Klein, G. Klein, and I. Ernberg.1995. A subpopulation of normal B cells latently infected with Epstein-Barr virus resembles Burkitt lymphoma cells in expressing EBNA-1 but not EBNA-2 or LMP1. J. Virol.69:3752–3758.
6.Cruchley, A. T., D. M. Williams, G. Niedobitek, and L. S. Young.1997. Epstein-Barr virus: biology and disease. Oral Dis.3(Suppl. 1):156–163. 7.Deacon, E. M., G. Pallesen, G. Niedobitek, J. Crocker, L. Brooks, A. B.
Rickinson, and L. S. Young.1993. Epstein-Barr virus and Hodgkin’s disease: transcriptional analysis of virus latency in the malignant cells. J. Exp. Med.
177:339–349.
8.deTotero, D., C. P. di Francia, A. Cignetti, and R. Foa.1995. The IL-2 receptor complex: expression and function on normal and leukemic B cells. Leukemia9:1425–1431.
9.Diehl, V., H. H. Kirchner, M. Schaadt, C. Fonatsch, H. Stein, J. Gerdes, and C. Boie.1981. Hodgkin’s disease: establishment and characterization of four in vitro cell lines. J. Cancer Res. Clin. Oncol.101:111–124.
10. Gorschluter, M., H. Bohlen, D. Hasenclever, V. Diehl, and H. Tesch.1995.
on November 9, 2019 by guest
http://jvi.asm.org/
Serum cytokine levels correlate with clinical parameters in Hodgkin’s dis-ease. Ann. Oncol.6:477–482.
11.Grasser, F., P. G. Murray, E. Kremmer, K. Klein, K. Remberger, W. Feiden, G. Reynolds, G. Niedobitek, L. S. Young, and L. N. Mueller.1994. Mono-clonal antibodies directed against the Epstein-Barr virus-encoded nuclear antigen 1 (EBNA-1): immunohistologic detection of EBNA-1 in the malig-nant cells of Hodgkin’s disease. Blood84:3792–3978.
12. Herbst, H., F. Dallenbach, M. Hummel, G. Niedobitek, S. Pileri, L. N. Muller, and H. Stein.1991. Epstein-Barr virus latent membrane protein expression in Hodgkin and Reed-Sternberg cells. Proc. Natl. Acad. Sci. USA
88:4766–4770.
13. Herbst, H., T. Raff, and H. Stein.1996. Phenotypic modulation of Hodgkin and Reed-Sternberg cells by Epstein-Barr virus. J. Pathol.179:54–59. 14. Herbst, H., H. D. Foss, J. Samol, I. Araujo, H. Klotzbach, H. Krause, A.
Agathanggelou, G. Niedobitek, and H. Stein.1996. Frequent expression of interleukin-10 by Epstein-Barr virus-harboring tumor cells of Hodgkin’s disease. Blood87:2918–2929.
15. Hsu, M. M., Y. J. Chen, Y. L. Chang, J. Y. Ko, and T. S. Sheen.1995. Soluble interleukin-2 receptor as a clinical parameter for nasopharyngeal carcinoma. Asian Pac. J. Allergy Immunol.13:1–4.
16. Kanzler, H., R. Kuppers, M. L. Hansmann, and K. Rajewsky.1996. Hodgkin and Reed-Sternberg cells in Hodgkin’s disease represent the outgrowth of a dominant tumor clone derived from (crippled) germinal center B cells. J. Exp. Med.184:1495–1505.
17. Karnitz, L. M., and R. T. Abraham.1996. Interleukin-2 receptor signaling mechanisms. Adv. Immunol.61:147–199.
18. Khan, G., and M. A. Naase.1995. Down-regulation of Epstein-Barr virus nuclear antigen 1 in Reed-Sternberg cells of Hodgkin’s disease. J. Clin. Pathol.48:845–848.
19. Klein, S., M. Jucker, V. Diehl, and H. Tesch.1992. Production of multiple cytokines by Hodgkin’s disease derived cell lines. Hematol. Oncol.10:319–329. 20. Klein, S. C., D. Kube, H. Abts, V. Diehl, and H. Tesch.1996. Promotion of IL8, IL10, TNF alpha and TNF beta production by EBV infection. Leuk. Res.20:633–636.
21. Kuhn, H. I., D. R. Sage, L. Stein, H. Groelle, and J. D. Fingeroth.1995. Expression of recombination activating genes (RAG-1 and RAG-2) in Ep-stein-Barr virus-bearing B cells. Blood85:1289–1299.
22. McKay, C. E., and W. Cushley.1996. Induction of CD25 expression in human B lymphocytes by pharmacological activators of cellular signalling pathways. Cytokine8:305–312.
23. Mueller, N.1987. Epidemiologic studies assessing the role of the Epstein-Barr virus in Hodgkin’s disease. Yale J. Biol. Med.60:321–332.
24. Niedobitek, G., E. Kremmer, H. Herbst, L. Whitehead, C. W. Dawson, E. Niedobitek, C. von Ostau, N. Rooney, F. A. Grasser, and L. S. Young.1997. Immunohistochemical detection of the Epstein-Barr virus-encoded latent membrane protein 2A in Hodgkin’s disease and infectious mononucleosis. Blood90:1664–1672.
25. Oudejans, J. J., D. F. Dukers, N. M. Jiwa, A. J. van den Brule, F. A. Grasser, P. C. de Bruin, A. Horstman, W. Vos, J. van Gorp, J. M. Middeldorp, and C. J. Meijer.1996. Expression of Epstein-Barr virus encoded nuclear antigen 1 in benign and malignant tissues harbouring EBV. J. Clin. Pathol.49:897– 902.
26. Rickinson, A., and E. Kieff.1996. Biology of EBV, p. 2397–2446.InB. N. Fields, D. M. Knipe, P. M. Howley, et al. (ed.), Fields virology. Lippincott-Raven, New York, N.Y.
27. Snudden, D. K., J. Hearing, P. R. Smith, F. A. Grasser, and B. E. Griffin.
1994. EBNA-1, the major nuclear antigen of Epstein-Barr virus, resembles ’RGG’ RNA binding proteins. EMBO J.13:4840–4847.
28. Srinivas, S. K., and J. W. Sixbey.1995. Epstein-Barr virus induction of recombinase-activating genes RAG1 and RAG2. J. Virol.69:8155–8158. 29. Tesch, H., M. Jucker, S. Klein, H. Abts, A. Gunther, G. R. Krueger, and V.
Diehl.1992. Hodgkin and Reed-Sternberg cells express interleukin 6 and interleukin 6 receptors. Leuk. Lymphoma7:297–303.
30. Tesch, H., A. C. Feller, M. Jucker, S. Klein, H. Merz, and V. Diehl.1992. Activation of cytokines in Hodgkin’s disease. Ann. Oncol.4:13–16. 31. Tesch, H., A. Gunther, H. Abts, M. Jucker, S. Klein, G. R. Krueger, and V.
Diehl.1993. Expression of interleukin-2R alpha and interleukin-2R beta in Hodgkin’s disease. Am. J. Pathol.142:1714–1720.
32. Tsilivakos, V., A. Tsapis, S. Kakolyris, P. Iliakis, M. Perraki, and V. Geor-goulias.1994. Characterization of interleukin 2 receptors on B-cell chronic lymphocytic leukemia cells. Leukemia8:1571–1578.
33. Vasef, M. A., O. W. Kamel, Y. Y. Chen, L. J. Medeiros, and L. M. Weiss.
1995. Detection of Epstein-Barr virus in multiple sites involved by Hodgkin’s disease. Am. J. Pathol.147:1408–1415.
34. von Kalle, C., J. Wolf, A. Becker, A. Scaer, M. Munck, A. Engert, U. Kapp, C. Fonatsch, D. Komitowski, W. Fe’aux Delacroix, and V. Diehl.1992. Growth of Hodgkin’s cell lines in severly combined immunodeficient mice. Int. J. Cancer52:887–891.
35. Wang, F., C. Gregory, C. Sample, M. Rowe, D. Liebowitz, R. Murray, A. Rickinson, and E. Kieff.1990. Epstein-Barr virus latent membrane protein (LMP1) and nuclear proteins 2 and 3C are effectors of phenotypic changes in B lymphocytes: EBNA-2 and LMP1 cooperatively induce CD23. J. Virol.
64:2309–2318.
36. Weiss, L. M., and K. L. Chang.1992. Molecular biologic studies of Hodgkin’s disease. Semin. Diagn. Pathol.9:272–278.
37. Westermann, F., D. Kube, B. Haier, H. Bohlen, A. Engert, M. Zuehlsdorf, V. Diehl, and H. Tesch.1996. Interleukin 10 inhibits cytokine production of human AML cells. Ann. Oncol.7:397–404.
38. Willerford, D. M., J. Chen, J. A. Ferry, L. Davidson, A. Ma, and F. W. Alt.
1995. Interleukin-2 receptor alpha chain regulates the size and content of the peripheral lymphoid compartment. Immunity3:521–530.
39. Wilson, J. B., J. L. Bell, and A. J. Levine.1996. Expression of Epstein-Barr virus nuclear antigen-1 induces B cell neoplasia in transgenic mice. EMBO J.15:3117–3126.
1636 NOTES J. VIROL.