Rochester Institute of Technology
RIT Scholar Works
Theses
Thesis/Dissertation Collections
2005
Effects of Pace and Stress on Upper-Extremity
Biomechanical Responses in Sign Language
Interpreters
Jin Qin
Follow this and additional works at:
http://scholarworks.rit.edu/theses
This Thesis is brought to you for free and open access by the Thesis/Dissertation Collections at RIT Scholar Works. It has been accepted for inclusion
in Theses by an authorized administrator of RIT Scholar Works. For more information, please contact
.
Recommended Citation
EFFECTS
OF PACE AND STRESS ON
UPPER-EXTREMITY
BIOMECHANICAL RESPONSES
IN SIGN LANGUAGE
INTERPRETERS
By
Jin Qin
A Thesis Submitted
In Partial Fulfillment
of
the
Requirements for
the
Degree
ofMaster
ofScience
in
Industrial
Engineering
Industrial
andSystems
Engineering
Department
Rochester Institute
ofTechnology
Approved by:
Matthew Marshall
Date:
Dr. Matthew Marshall
Thesis Advisor - R.I.T. Dept. of Industrial and System Engineering
Jacqueline Mozrall
Date:
Dr. Jacqueline Mozrall
EFFECTS OF PACE AND STRESS ON
UPPER-EXTREMITY BIOMECHANICAL RESPONSES
IN SIGN LANGUAGE INTERPRETERS
By
Jin Qin
I, Jin Qin, hereby grant permission to the Wallace Memorial Library of the
Rochester Institute of Technology to reproduce this document in whole or in part
that any reproduction will not be for commercial use or profit.
Signature
:
Jin Qin
Acknowledgement
First
andforemost,
I
wantto
expressmy
gratitudeto
my
advisor,
Dr. Matthew
Marshall,
for his
advice, guidance, assistance,
andcontinuing devotion
to this thesis
project.
I
wantto thank
my
committeemember,
Dr. Jacqueline
Mozrall,
for her
supportand
feedback
onmy
work,
andfor
your greatjob
asthe
department
head.
I
also wouldlike
to thank
Dr. Marc
Marschark,
Patricia Sapere
and other researchers atNTID
Department
ofResearch for
their
valuable advice andhelp.
Special
thanks to
my
parentsfor
their
constant support andlove
which gave methe
motivationto
achievemy
goals.Finally
I
wouldlike
to thank
my friends for
their
Abstract
Repetitive
motioninjuries
(RMIs)
aredisorders
ofthe
softtissues
due
to
repeatedexertion and excessive movement of
the
body.
Sign
language interpreters
whohave
to
move
their
fingers, hands,
wrists and armsrepeatedly
are susceptibleto
RMIs.
One
ofthe
major researchvoidsin
the
studiesofRMIs in
signlanguage interpreters is
the
lack
ofquantificationof
biomechanical
exposures.The
objective ofthis
study
wasto
analyzethe
impact
of pace and psychosocial stress of signlanguage
interpreting
onthe
biomechanical
responsesin
a quantitative manner and comparethe
results withthe
industrial high risk benchmarks.
Twelve
professional signlanguage interpreters
participatedin
this
study
with aone-half
hour
interpreting
task.
Biomechanical
variablesin flexion/extension
andradial/ulnar planes of wrist motion
in different
pace and stressconditionsweremeasured.It
wasfound
that
pacehas
a significant positive effect onbilateral biomechanical
responses while a positive stress effect was
found only for
the
left hand.
The
dominant
hand
wassignificantly
morephysically
stressedthan
the
non-dominanthand,
asindicated
by
wristkinetic
variables and other wrist motion variables measuredin
this
study.In
addition,
wristkinetic
variables of signlanguage
interpreting
werefound
similarto
orhigher
than the
high risk industrial benchmarks.
The
results ofthis
study
proved withquantitative
data
that
signlanguage
interpreting
is
ahigh risk job
ofRMIs,
requiring
highly
deviated
wristpositions,
ballistic
wristmovements,
andhighly
repetitive wristmotions.
The
results also shedlight
onhow different factors may influence
the
Table
of
Contents
Title Page
I
Acknowledgement
IV
Abstract
V
List
ofTables
VIII
List
ofFigures
IX
List
ofFormulas
X
Chapter 1 Introduction
1
Chapter 2 Literature Review
3
2.1 RMIs
andits Prevalence
3
2.2 Biomechanical Risk Factors
4
2.3 Psychosocial Risk Factors
9
2.4 Individual Risk Factors
11
Chapter 3 Methods
andProcedures
13
3.1 Experimental Objectives
13
3.2
Experimental Design
13
3.3
Independent
Variables
14
3.3.1 Pace
14
3.3.2 Stress
andArousal
16
3.4
Dependent
Variables
18
3.4.1 Kinetic
Variables
18
3.4.2 Other
Electrogoniometric Measurements
21
3.4.3
Electromyography (EMG)
Measurement
24
3.4.4 Subjective
Rating
ofPerceived
Discomfort
25
3.4.5 Heart Rate
26
3.5 Subjects
27
3.6
Experimental Protocol
28
Chapter 4 Results
31
4. 1 SACL Score
andGroup
Adjustment
31
4.2
Demographic
Data
34
4.3
Electrogoniometric
Data
35
4.3.1 Wrist Motion
35
4.3.2 High Risk Wrist
Motion,
Wrist Pause
andRepetition
48
4.3.3 Differences between
Dominant/Non-dominant Hands
54
4.4
Electromyography
Data
55
4.5 Subjective
Rating
ofPerceived Discomfort
56
4.6 Heart Rate
57
Chapter 5 Discussion
58
5.1
Independent Variables
58
5.2
Wrist
Motion
62
5.2.
1 Mean
Values
62
5.2.2
Minimum,
Maximum
andRange Variables
64
5.2.3
Comparison
ofWrist Motion
withOther Occupations
65
5
.2 .4High
Risk
Wrist
Motion,
Wrist Pause
andRepetition
70
5.3 Other Measurements
75
5.4
Limitations
76
5.5 Future
Research
77
Chapter 6
Conclusion
79
References
81
Appendix
A: Consent Form
87
Appendix B:
Screening
Questionnaire
88
Appendix
C:
Demographic
Data
89
Appendix D:
Stress-Arousal
Checklist
90
Appendix
E: Ratings
ofPerceived
Discomfort
91
List
of
Tables
Table 3.1
Experimental
Design
14
Table 3
.2Benchmark
wristmotion valuesofhigh
riskindustrial job
24
Table 3.3 Number
ofsubjectsreportedache,
painordiscomfort
during
the
last 12
months
27
Table 3.4
Key
to
coding
ofvariablenames30
Table4.1 Average
SACL(SD)
scoresbefore adjusting
31
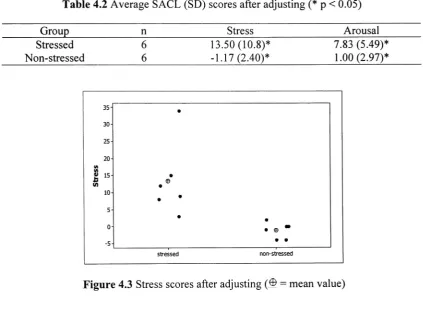
Table 4.2 Average SACL
(SD)
scores afteradjusting
33
Table 4.3 Demographic data
34
Table 4.4 Pearson linear
correlation ofdemographic data
34
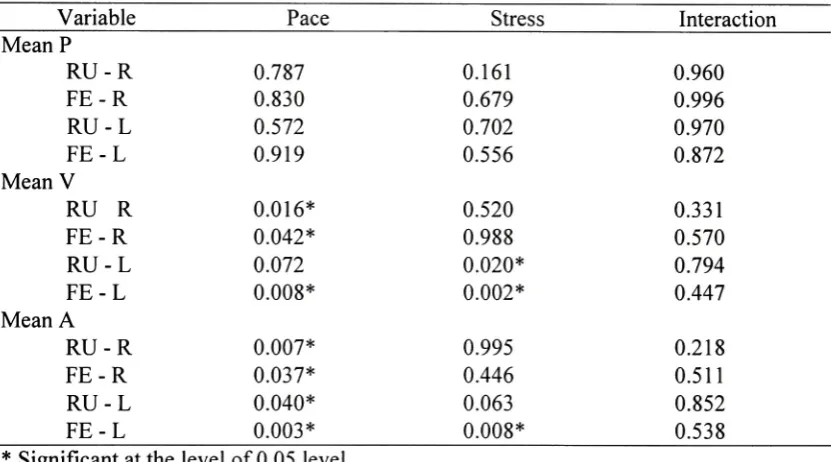
Table 4.5 Significant findings
of mean wrist motion variablesbefore adjusting
36
Table 4.6 Significant findings
of mean wrist motion variables afteradjusting
36
Table 4.7 Increase
of meanvelocity
and accelerationfrom low
to
high
pace/stresslevels
39
Table 4.8
Summary
statisticsofthe
wristposition41
Table
4.9
Summary
statistics ofthe
wristvelocity
42
Table 4.10
Summary
statistics ofthe
wrist acceleration43
Table 4. 1 1
Significant
findings
ofminimum,
maximum and range of wrist motion47
Table 4.12
Wrist
motion range ofSLI
as a percentage ofROM
48
Table
4. 1 3
Summary
statistics ofthe
wristexcursion, pause,
repetition andMPF
50
Table 4.14
Significant
findings
ofrepetition,
pause andhigh risk
motion51
Table 4.15 Comparison
ofthe
left
andthe
right hand kinetic
variables55
Table 4.16
Right Trapezius
EMG
statisticsin different
experimental conditions56
Table 4.17
Average RPD
scorefor
stressedandnon-stressed subjects57
Table
4. 1 8
Average
HR in different
experimentalconditions57
Table 5.1
Comparison
of wrist motion results with otheroccupations66
List
of
Figures
Figure 2. 1 Resultant
reactionforce
as afunction
of wristangle andtendon
force
6
Figure 3
.1 Two
versionsofthe
presentationusedin
the
experiment15
Figure 3.2 Two
planesof wrist movement19
Figure 3.3 Goniometer
attachment19
Figure 3.4 Sign
conventionsfor
wrist positiondata
20
Figure 3.5 Illustration
of wristrepetition,
pause andhigh risk
values22
Figure 3.6 A
typical
power spectra of wrist positionduring
1 1
minutes ofinterpreting
Task
23
Figure 4. 1 Stress
scoresbefore adjusting
32
Figure 4.2 Arousal
scoresbefore adjusting
32
Figure 4.3 Stress
scores afteradjusting
33
Figure 4.4 Arousal
scores afteradjusting
33
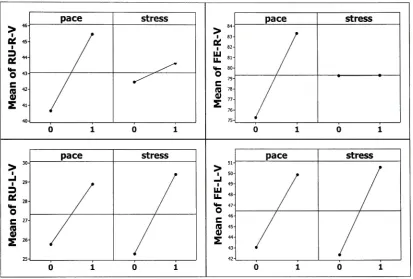
Figure 4.5 Main
effects plotfor
meanvelocity
in different
planes afteradjusting
37
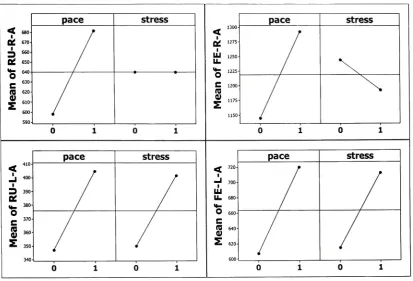
Figure 4.6
Main
effects plotfor
meanaccelerationin different
planes afteradjusting
...38Figure 4.7 Mean
wrist position underdifferent factor
combinations44
Figure
4.8
Range
of wrist position underdifferent factor
combinations44
Figure
4.9 Mean
wristvelocity
underdifferent
factor
combinations45
Figure
4. 10
Range
of wristvelocity
underdifferent
factor
combinations45
Figure
4. 1 1 Mean
wristaccelerationunderdifferent factor
combinations46
Figure 4.12 Range
of wristaccelerationunderdifferent factor
combinations46
Figure 4.13
High
risk
velocity
and accelerationin
the
FE-L
plane52
Figure 4.14
Pause
of wrist motionin different
planes as afunction
ofpacelevel
52
Figure 4.15 Pause
of wrist motionin different
planes as afunction
ofstresslevel
53
Figure 4.16
Repetition
of wrist motionin different
planes as afunction
ofpacelevel
53
Figure 4.17
Repetition
of wrist motionin different
planesas afunction
ofstresslevel...54
Figure 5.1
Negative
correlations of stress andsigning/interpreting
experience59
Figure 5.2 Mean
velocity
ofSLI comparing
to the
industrial benchmarks
68
Figure
5.3 Mean
acceleration ofSLI comparing
to the
industrial benchmarks
68
Figure 5.5 Max/Min
accelerationofSLI comparing
to
the
industrial benchmarks
69
Figure 5.6 Pause for
different
occupations73
Figure 5.7 MPF for
different
occupations73
List
of
Formulas
Formula 3.1 Angular velocity
20
Formula 3.2 Angular
acceleration20
CHAPTER 1
INTRODUCTION
Repetitive
motioninjuries
(RMIs)
such as carpaltunnel
syndromehave
long
been
associated with
adversely affecting
the
industrial
workforce.However,
RMIs
are evenmore prevalent
among
signlanguage interpreters
than
in industrial
workers.The
painand
dysfunction
associatedwithRMIs have lead
to
significantloss
of worktime
for many
interpreters
andforced
some ofthem to
abandonthe
professionentirely.RMIs
threaten
the
health
andlivelihood
ofinterpreters
andhave
contributedto the
national shortage ofinterpreters
despite
anincreased demand
oftheir
services.While
the
physicalintensity
ofinterpreting
is easy
to
appreciate,
whatmay be
overlookedis
the
high
cognitivedemand
placed on
the
interpreter
ashe/she
adaptsto
new subjectcontent,
changesin
speaker'space,
and various psychosocial pressures.Better understanding
ofthe
factors
that
affectthe
development
ofRMIs among interpreters is necessary
to
reducethe
occurrence ofRMIs
andto
develop
effective strategiesfor
signlanguage interpreters
who sufferfrom
the
disorders.
A
considerable amount of workhas been
performedto
investigate
andquantify
exposure
to
RMIs in industrial
workers,
and recent workhas begun
to
evaluatethe
effectof psychosocial
factors
onbiomechanics
ofthe
back in industrial
settings.However,
less
attention
has been
paidto
RMIs
in
signlanguage interpreters.
Research
that
quantifiesthe
biomechanical
parameters of upperextremity
during
interpreting
is very limited
andthere
is
alack
ofliterature studying
the
effect of psychosocial stressonthe
biomechanical
analyze
the
impact
of pace and psychosocial stress ofthe
interpreting
task
onthe
biomechanical
responsesin
a quantitative manner.This
work was alsointended
to
establish
benchmark
values ofbiomechanical
exposures of signlanguage
interpreting,
which can
be
usedto
compareto
previously
establishedthresholds
ofhigh
riskindustrial
CHAPTER
2
LITERATURE REVIEW
2.1 RMIs
andits Prevalence
RMIs
aredisorders
ofthe
softtissues
ofthe
body- mostfrequently
the
tendons
and nerves
-due
to
repeatedexertionand excessive movement ofthe
body
(Rempel
etal.,
1992). These disorders have
alsobeen
referredto
as repetitive straininjuries,
cumulativetrauma
disorders,
repetitive stresssyndrome,
or overuse syndromes.Upper
extremity
RMI
refersto
avariety
ofinflammatory
conditions ofthe
fingers,
hands,
wrists,
arms,
shoulders,
upperback,
and neckincluding
carpaltunnel
syndrome(CTS),
tendinitis,
synovitis, myofascitis,
andtenosynovitis
with symptoms ofpain,
tenderness,
tingling,
swelling, numbness, cramping,
stiffness andloss
offunction.
Unlike instantaneous
trauma,
"repetitive" meansthat the
injuries
are causedby
repeated stress over a period oftime.
Since
the
early 1980s
through
1994,
the
Bureau
ofLabor Statistics
(BLS)
reporteda
tenfold
increase
ofRMIs in
many
segments ofAmerican
industry.
The agency
alsoreported
that
the
median number ofdays away from
workfor CTS
was30,
whichis
evengreater
than
the
median reportedfor back
pain cases(BLS,
1995).
According
to the
data
from
the
Occupational Health Supplement
of1988 National Health Interview
Survey,
among 127
million workers who workedduring
the
12
monthspriorto the survey,
2.0%,
or
2.54
million eitherself-reported or werediagnosed
withCTS,
and0.46%,
or588,000
tendinitis,
synovitis,
ortenosynovitis
by
a physician.Construction,
food
processing,
assembly
and repair servicewere some ofthe
jobs
withhigh
prevalence ofCTS.
RMIs
startedto
be
associated with signlanguage interpreters
aboutfifteen
yearsago
(Stedt,
1990).
At
RIT/NTID,
approximately 45%
ofthe
signlanguage interpreters
were either
totally
disabled from
interpreting
or wereworking
with reducedinterpreting
load because
ofRMI
symptoms(DeCaro
etal,
1992)
in
the
1988-1989
academicyear.In
1990,
60%
ofthe
42
full-time interpreters
atNTID
werediagnosed
with work-relatedtendonitis
(48%)
or nerveentrapmentdisorders (12%).
Similarly,
Stedt
(1990)
found
that
among 40
interpreters,
the
vastmajority
(88%)
reportedthat
they
had
experienced atleast
two
symptoms(such
asnumbness,
tickling,
pin/needlessensation,
andburning
feelings)
associated with
RMIs
at sometime.In
a more recentsurvey
of145
interpreters,
Scheuerle
(2000)
found
that
1 19
(82%)
had
experienceddisabling
pain/discomfortduring
and
following
interpreting.
Investigation
into
the
etiology
ofRMIs
has identified
three
categories of riskfactors
for
these
problems:biomechanical
exposures,
psychosocialstressors,
andindividual
riskfactors (Bongers
etal.,
2002),
which willbe described
individually
in
the
following
sections.2.2
Biomechanical Risk
Factors
Biomechanical
exposuresinclude
factors
such as repetitivemotion,
high
forces,
and
deviation from
neutralbody
alignments(National Research Council
andthe
Institute
of
Medicine,
2001).
National
Institute for Occupational
Safety
andHealth
(NIOSH,
1997)
force,
andposture)
andtheir
relationship
to
CTS.
There
is
evidence of a positiveassociation
between
highly
repetitivejobs
alone orin
combination with otherfactors.
In
addition,
forceful
work wasfound
to
be
positively
associatedwithCTS.
Strong
evidencewas
found
of apositive associationbetween
exposureto
acombination of riskfactors
andCTS.
NIOSH
also reviewed studiesthat
examinedthe
relationship
between
those
riskfactors
andhand/wrist
tendinitis.
Evidence
of an associationbetween any
singleergonomic risk
factor
andhand/wrist
tendinitis
wasfound.
There
is strong
evidencethat
tasks
requiring
a combination of riskfactors
(e.g.,
highly
repetitive,
forceful
exertionsand awkward
postures) increase
risk ofhand/wrist
tendinitis.
It
has been
agreedamong investigators
that the
incidence
ofCTS
is
relatedto
prolonged
forces
placed onthe
median nerveinside
the
carpaltunnel
(Armstrong, 1979;
Rempel
etal.,
1992).
The
tendons
and median nervewrap
aroundthe
carpalbones
andflexor
retinaculummuchlike
a rope wraps around afixed pulley
(Armstrong
andChaffin,
1979).
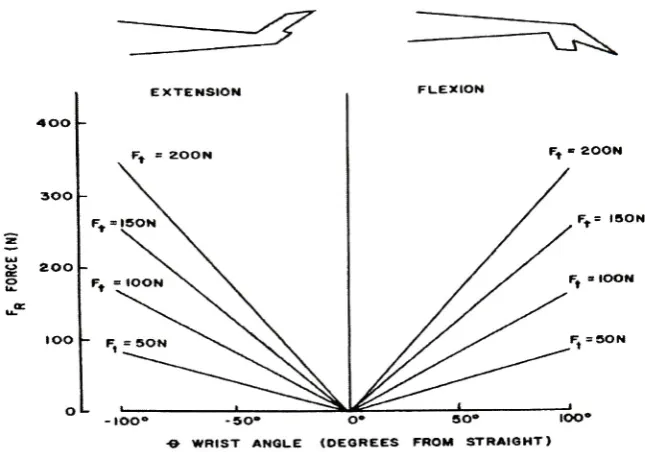
The
total
force
onthe tendons
goesup
asthe
deviation
ofthe
wristincreases
which results
in
greater compressionforce
onthe
median nerve(Figure 2.1).
The
compression
force interferes
with nourishment ofthe
tendon,
synovial membrane andnerve
tissue,
thereby
contributing
to
CTS
andtenosynovitis.
This
modelestablishedthe
relationship
between intra-wrist forces
and wristposition,
which suggeststhat
exertionsof
the
hand
withagreatly
deviated
wrist would resultin
greatertotal
force
onthe
tendons
EXTENSION FLEXION
-IOO" -SO* O* SO* IOO*
- WRIST ANGLE (DEGREES FROM STRAIGHT)
Figure 2.1 Resultant
reactionforce
(Fr),
as modeledby
Armstrong
andChaffin
(1979)
that
is
exertedagainstthe
flexor
tendons
as afunction
of wrist angle andtendon
force (Ft).
Adapted
from Chaffin
etal.(1999).
In
additionto
the
static effects of wristpostures,
dynamic
components such asacceleration and
velocity
have been
shownto
affectthe
intra-wrist forces.
Considering
that
repetitionis
essentially
cyclic angularvelocity
andacceleration,
Schoenmarklin
andMarras
(1990)
developed
adynamic
model ofthe
wristjoint based
onthe
above staticwrist model proposed
by
Armstrong
(1979).
The
dynamic
model analyzesthe
effects ofpeak angular acceleration on
the
resultant reactionforce from
the
wristbones
andligaments.
The
resultantforce
onthe tendons
and median nervefrom
the
carpalbones
and
flexor
retinaculumincreases
whenthe
wristis
acceleratedin
the
flexion/extension
plane.
It
shouldbe
notedthat this
increase in
reactionforce
is due solely
to the
[image:17.526.108.431.45.271.2]case
for
interpreting.
This
analysis could alsobe
appliedin
the
radial/ulnardeviation
plane.
Marras
andSchoenmarklin
(1993)
performed a quantitativestudy in
whichworkers'
three
dimensional
wrist motions were monitored asthey
performed normalwork activities
in
anindustrial
setting.The
wrist motion parametersthat
were monitoredfor
each subject wereposition,
angularvelocity,
and angular acceleration.Descriptive
statistical analysis of
these
measuresindicated
that
generally
the
mean valuesfor
eachvariable were
larger in
magnitudefor
the
group
ofhigh-risk
subjectsthan
that
oftheir
low-risk
counterparts.However,
only
the
velocity
and acceleration parameters resultedin statistically
significantdifferences between
low- andhigh-risk
groups.Jobs
withlow
and
high incidence
ofRMIs
weredetermined from US Occupational
Safety
andHealth
Administration
(OSHA)
200
logs,
which are requiredby
the
US
governmentto
recordoccupational
injuries
andillnesses.
This study demonstrated
the
importance
ofdynamic
components
in assessing RMI
risk.The
mean acceleration values ofhigh
andlow RMI
risk groups serve as
preliminary
benchmarks
for establishing injuries
and safelevels
ofwrist motion
in
industry.
Similar
studieshave
sincebeen
performed on meatprocessing
workers
(Marklin
&
Monroe, 1998),
grocery
store cashiers(Marras &
Marklin, 1995),
and
typists
(Serina
etal.,
1999).
However,
suchbiomechanical study
on signlanguage
interpreting
was notfound in
the
literature. One
ofthe
major voidsin
the
study
ofRMIs
in
signlanguage interpreters is
the
quantificationofthe
kinematics
ofwristmotions andhow
these
motions are relatedto the
riskofRMIs.
The
same methods usedto
evaluatedynamic
wrist motionin
industrial
settings couldbe
usedfor evaluating
signlanguage
Sign
language
interpreting
requireshighly
repetitive wrist activities.It
has been
estimated
that
the
frequency
ofmotionduring interpreting
approaches13,500
motionsduring
a50-minute
session or270
motions per minute(Wisowaty,
1996).
The
meannumber of
fundamental
wrist motions ofindustrial
workers measuredby
Barnes
(1981)
was
25,435 (sd
=12,921)
per eight-hour shift or53
per minute.By
comparison, the
frequency
of motion ofinterpreters is approximately five
times
that
ofindustrial
workers.Silverstein
et al.(1986,
1987)
established repetition as a riskfactor
for CTS
andRMI
overall and
found
that the
risk ofCTS
andRMI
in high
repetitionjobs
was1.9
and3.6
times
greaterthan that
in low
repetitionjobs.
High
repetitionjobs
wasdefined
astasks
having
cycletime
less
than
30
seconds ortasks
in
whichatleast 50%
ofthe
workcycleis
spent
performing
the
samefundamental
movements.Sign
language
interpreting,
whichmeetsall
these
criteria,
caneasily be
classified as ahighly
repetitivejob.
Sign
language
interpreting
is
notonly
highly
repetitive,
but
also requiresinternally
generatedhigh force
and awkward postures ofthe
fingers,
hands
and wrists.All
ofthese
factors lead
to
high incidence
ofRMIs
based
onthe
conclusions ofthe
aforementioned research.
In
aninvestigation
conductedamong
educationalinterpreters
from
RIT/NTID,
DeCaro
et al.(1992)
observed ahigh
occurrence ofRMIs among
signlanguage interpreters working in
a classroom environment andfound
that
certain workbehaviors
were attributedto
those
interpreters
who wereexperiencing RMI
symptoms.The study found
that
interpreters working
with pain exhibitedfewer
restbreaks,
greaternumbers of wrist and
hand
deviations,
greater number of excursionsfrom
a predefinedwork space
(work
envelopeexcursions),
and a more rapid pace offinger
andhand
2.3 Psychosocial Risk Factors
Psychosocial
stressors at workinclude
factors
such ashigh-perceived
workplacestress,
low-perceived
socialsupport,
low-perceived
job
control,
andtime
pressure(Bongers
etal.,
2002;
Huang
etal.,
2003).
Sign language
interpreting
is
notonly
physically
demanding,
but
alsopsychosocial^
stressful withhigh
cognitivedemands.
Stress is
a complex psychological statederiving
from
the
person's cognition appraisal oftheir
adaptationto the
demand
ofthe
(work)
environment(Cox
et al.1983).
It
has been
suggested
(Cox, 1985)
that the
process of(primary)
appraisaltakes
into
account atleast
four factors:
the
demand
onthe
person,
their
individual
characteristics,
skills and generalability
to
meetthose
demands,
andthe
constraintsthat
they
are under whencoping
andthe
support receivedfrom
othersin
coping.Recent
research suggeststhat
workstyle,
orhow
a person respondsto
workdemands,
may be
relatedto
upperextremity
symptoms(Haufler
etal.,
2000).
Bongers
et al.(1993)
reviewedthe
relevantliterature
andfound
that
stress symptoms were often associated with musculoskeletaldisease,
andindicated
that
stress symptoms contributeto the
development
ofthis
disease.
After reviewing 26
studies,
Bongers
et al.(2002)
found
an associationbetween
work-related psychosocialfactors
and adverse upperextremity
symptoms.Clearly,
numerous occupationaldemands
affectthe
overallinterpreting
task that
may
contributeto
interpreter
stress andburnout.
Sign
language
interpreting
is
a high-pressurejob
with alack
of control overthe
working
conditions,
lack
ofpeercohesion,
and
high
volume of work.The
stress ofinterpreting
includes
the
demands
directly
orindirectly
relatedto
the
materialbeing
interpreted,
such as speaker's communicationthe
content,
aswell ashis/her
receptive and expressive skills(Dean,
2001).
In
addition,
as
is
the
casewithmany
occupations,
psychosocialfactors may
affectthe
demands
ofthe
interpreting
task.
These
include factors
relatedto
the
settings whereinterpreting
assignments
take
place,
the
presence of otherparties,
and physical/psychologicalfactors
pertaining
to the
interpreter
alone.The
relationship
between
psychological stress andresulting
biomechanical
responses
has only recently been
addressed withinthe
context ofindustrial
settings.An
experiment was performed
by
Davis
et al.(2002)
to
explorehow
the
interaction
ofspecific psychological
factors (types
of mentalprocessing
and workpacing)
andindividual factors
(personality
andgender)
mightinfluence
the
biomechanical
responseand subsequentspine
loading
above andbeyond
that
resulting from
physical workdesign.
It
wasfound
that
mental stress acted as a catalystfor
the
biomechanical
responses,
resulting in
the
overreacting
ofthe
musculoskeletalsystem,
whichleads
to
increased
spine
loading.
Different
personalities alsolead
to
differences in
spineloading.
These
results
may
help
to
explainthe
contributing factors
of musculoskeletaldisorders
otherthan
physicaldemand.
Compared
to
the
research relatedto
biomechanical
causes ofRMI,
investigation
of
the
relationship
between
psychosocialfactors
andRMI
is
fairly
new.Some
researchers
have
noticedthe
contributing
role psychosocialfactors
may play in
the
development
ofRMIs
in
signlanguage
interpreters.
Recommendations
are madethat
address psychosocial
interventions
to
preventthe
incidence
ofRMI,
such asself-exploration or
self-assessment,
constructivethinking,
reflection, venting,
prayer(NTID,
However,
these
interventions
aremainly focused
onself-adjustment,
ratherthan the
relationship between
interpreters
andthe
demands
oftheir
work.Feuerstein
(1992)
suggested
the
possibility
that
the
high-risk
work style ofinterpreting
many
reflect aheightened
behavioral
reactivity
to
physical and psychosocial stressors at work whichneeds
further
investigation.
Dean
andPollard
(2001)
demonstrated
that
the
combinationof
high demand
andlow decision
control environment putsinterpreters
athigh
riskfor
stress-related
illness, injury,
andburnout.
However,
the
major void of such studiesis
that
the
impact
of psychosocialfactors
wasnot studiesin
relation with physicaldemands
andno quantitativeanalysis
has been
providedto
assessthe
impact
of psychosocialfactors
onbiomechanical
responsesduring
interpreting.
2.4 Individual
Risk Factors
Individual
riskfactors
ofRMIs include
gender, age,
negative stressreactions,
unsatisfactory
leisure time,
and additionaldomestic
workload(Bergqvist
etal.,
1995;
Fredriksson
etal.,
1999).
The
results of asurvey
conductedby
Stedt
(1989)
indicate
that
besides
the
ergonomic riskfactors
(repetition,
force,
anddeviated
posture), age,
gender,
dominant/nondominant
hand,
and amount offinger spelling
alsomay play
a partin RMI
development among interpreters. Risk is higher for interpreters
who arefemale,
olderthan
40,
and/or whohave
smaller wrists orhave had
a previous wristfracture.
Additionally,
Scheuerle
(2000)
concludedfrom
a nationalsurvey
that
pain ordiscomfort
experienced
during interpreting
is
relatedto
training,
workhistory,
and work schedule.This study
also showedthat
pain anddiscomfort commonly
occurnotonly in
the
upperThere
are anumber ofindividual
factors known
to
influence
the
development
ofRMIs. It has been
reportedthat
CTS
is from
two to ten times
more prevalentin females
than
in
males(Phillips,
1967; Phalen, 1972;
Birbeck
&
Beer,
1975).
Similarly,
Armstrong
et al.(1987)
reported ahigher
prevalence oftendinitis
among females.
Tanaka
et al(2001)
reviewedthe
1988
National Health Interview
Survey
andfound
that
bending/twisting
ofthe
hands/wrists
at work andfemale
gender weresignificantly
associated with
reporting
oftendinitis,
synovitis andtenosynovitis.
In Armstrong's
biomechanical
model(Armstrong,
1979),
it is
suggestedthat the
force
applied onthe
tendons
in
carpaltunnel
is negatively
correlated with wristsize,
which atleast partially
explains
why CTS is
more commonfor females
than
males sincefemales
normally
have
smaller wrists.
This
genderdifference is particularly noteworthy for interpreters because
of
the
predominance offemales in
this
occupation.In
studiesofinterpreters
(Stedt, 1990;
DeCaro,
1992; Feuerstein, 1992; Scheuerle,
2000),
the
percentage offemales
rangesfrom
CHAPTER 3
METHODS
AND PROCEDURES
3.1 Experimental Objectives
The
main objective ofthis
study
wasto
analyzethe
impact
of pace andpsychosocial stress on
the
biomechanical
responses of signlanguage interpreters in
aquantitative manner.
This
work also soughtto
establishbenchmark
values ofbiomechanical
exposuresofsignlanguage
interpreting,
which canbe
usedto
compareto
previously
establishedthresholds
ofhigh
risktasks
of other occupations.3.2 Experimental
Design
A
laboratory
experiment wasdesigned
and conductedto
attainthe
statedobjectives.
A
22factorial design
ofthe
experiment was used withstress andpace asthe
two
independent
variables.Pace
ofthe
speaker was chosen as awithin-subjectvariableand psychosocial stress as a
between-subject
variable.A
high
and alow level
weredesigned for
eachindependent
variable.Each
subject was askedto
perform athirty-minute
interpretation
task
which contained afast
paced(high)
and a slow paced(low)
segment of a
thirty-minute,
videotapedlecture.
Subjects
wererandomly divided into
astressed
(high)
or non-stressed(low)
group.The
design
ofthe
experimentis illustrated
in
Table
3.1.
Biomechanical
responsesincluded
wristkinematic
data
measuredby
electrogoniometers and
trapezius
muscleactivity
measuredby
EMG
sensors.Additionally,
heart
rate,
subjectiverating
ofdiscomfort
and psychological state ofstressindependent
variablesaredescribed
further in
the
subsequent sections.Considering
that
fatigue
mighthave
a potential effect overthe
half-hour interpretation
task
onthe
dependent
variables,
half
ofthe
subjectsin
eachgroup interpreted
the
slow segmentbefore
the
fast
segment andthe
order was reversedfor
the
otherhalf in
orderto
counterbalance
that
effect.Table
3.1
Experimental Design
(+
and-denote high
andlow level
ofthe
independent
variablesrespectively)
Factor
Treatment
#
ofReplications
Pace
Stress
low
low
6
high
low
+-6
low
high
-+
6
high
high
+ +6
3.3
Independent Variables
3.3.1 Pace
The
first independent
variable was pace.A
thirty-minute
presentation of aprofessor
talking
aboutindustrial
engineering
andthe
related program atRIT
wasrecorded
before
the
experiment.The
presentation was abrief introduction
ofdifferent
areas associated with
industrial engineering
anddid
notinclude
asignificant amount ofjargon
ortechnical terms
sothat
interpreters
withlittle
or nobackground in engineering
would also understand and
be
ableto
interpret.
The
original presentation was recordedwith
the
professor's normalspeaking
pace.There
was no majorbreak in
the
presentation.The
originaltape
wasthen
digitized
andtwo
new versions were createdusing
videovideo and audiocontentof
the
presentation.Through
trial
anderror,
afast
segment atthe
speed of
115%
and aslow segment atthe
speed of85%
ofthe
original pace were chosenfor
the
experimentbased
onthe
criteriathat there
was adiscernable
change of speedwithout
compromising intelligibility.
Altering
the
speed resultedin
a change of voicepitch with
the
fast
segmenthaving
ahigher
pitch andthe
slow segmenthaving
alower
pitch.
However,
the
changes ofthe
voice pitch were still perceivedto
be
withinthe
normal spectrum of
human
voice.Both
versions ofthe
interpreted
videotapebegan
withfive
minutes ofthe
speaker's regular pace so
that
subjects could get usedto
interpreting
withthe
sensors(described
later)
onhis
orher
arms.For
the
first
version,
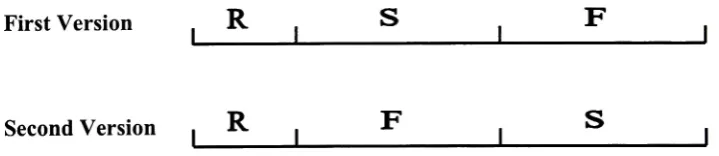
aneleven-minute slow segment(85%
of normalpace)
wasfollowed
by
an eleven-minutefast
segment(115%
of normalpace).
A
one-minute and atwo-minute transition
period wereaddedbefore
and afterthe
slow segment so
that the
change of speed would not seemtoo
abrupt.The
second versionof
the
interpreted
videotape,
usedfor
counterbalancing,
was madeusing
the
sametechnique
exceptthat the
slowandthe
fast
segments were reversed(Figure 3.1).
First Version
,R
.S
F
Second
Version
.R
Figure
3.1 Two
versions ofthe
presentationusedin
the
experimentR
-Regular
pace
S
-Slow
[image:26.526.58.418.461.539.2]3.3.2 Stress
andArousal
The
secondindependent
variable was psychosocial stress.Subjects
wererandomly
assignedto
one oftwo groups,
"stressed"and"non-stressed". Two
interpreting
researchers at
NITD
providedthe
initial input
onhow
to
makeinterpreters feel
stressed.Based
ontheir
knowledge
andexperience,
it
was suggestedthat
significant stress wouldbe induced
by
telling
the
interpreters
that
the
videorecording
oftheir
interpretation
would
be
shown atthe
Registry
ofInterpreters
for
the
Deaf
(RID)
national conference.RID
is
a national organization of professionals who provide signlanguage
interpreting/transliterating
servicesfor deaf
andhard
ofhearing
persons.It
was alsosuggested
that the
presence of personnelfrom
the
Department
ofResearch
atNTID
may
provide an additional stressor.
The Department
ofResearch
atNTID
conducts appliedresearch on
American
Sign Language
that
improves
teaching
andlearning
processes.During
the
experiment,
subjectsin
the
stressedgroup
weretold that
part ofthe
videorecording
wouldbe
shown atboth RID
andHuman Factors
andErgonomics
Society
national conferences and
that
two
peoplefrom NTID Department
ofResearch
wouldbe
present
during
the
experiment.The
non-stressedgroup
was not provided withthe
RID
pretext and no other person was present
during
their
experiment exceptthe
two
investigators.
Instead,
the
non-stressedgroup
wasinformed
that
this
study
wasconducted
only
to
investigate
the
biomechanical
characteristics ofinterpreting
andthe
video
tapes
wouldbe
usedfor further
evaluation.The majority
of studiesexamining
the
occurrence ofpotentially
stressful eventsuse some version of a checklist where
the
stress scoreis simply
the
total
numberofitems
levels in
this
study
were measuredthrough the
use ofthe
Stress-Arousal Checklist
(SACL)
developed
by
Mackay
et al.(1978). The
thirty-item
SACL
consists of adjectivescommonly
usedto
describe
one's psychological experienceto
stress and arousal.The
SACL
wasoriginally
tested
with a sample of undergraduate students(Mackay
etal.,
1978). It
has
sincebeen
utilizedin
avariety
of occupational populationsincluding
pilots(Cooper &
Sloan, 1987),
nurses(Hirosawa,
Hatta &
Yoneda, 1998),
and computerentry
workers
(Shark,
Czaja &
Nair,
1998).
However,
it is
notknown
to
have been
used onsign
language interpreters.
The
factors
ofSACL
arebipolar,
with some adjectivesloading
positively
andsome negatively.
The
30 items
consist of18
items
loading
onthe
stressfactor
and12
items
loading
onthe
arousalfactor. For
the
stresssubscale,
the
positive adjectives wereitems
1-10,
andthe
negativeitems
were11-18
(Appendix D).
The
adjectivefor
the
arousal subscale were: positive =
19-25;
and negative =26-30.
Thayer's
originalasymmetric response scale was used:
'definitely
feel'(++),
'feel
slightly'
(+),
'do
notunderstand or
uncertain'
(?),
and'definitely
do
not feel'(-).
Each
subjectutilizing
the
SACL
rated each adjectivein
terms
ofthe
intensity
ofhis/her feelings.
Positive
adjectives were scored
from
l(-)
to
4(++),
while negative adjectives were scoredfrom
l(++)to4(-).
There
are no reports onthe
reliability
ofthe
SACL (Fischer
&
Corcoran,
1994).
However,
the
SACL
has been
subjectedto
factor
analysesby
several researchersto
investigate
its internal
consistency
(Fischer &
Donatelli, 1987;
Mackay
et al.1978).
Factor
analysishas identified
atwo-factor
structure,
subsequently labeled
stress andincrease
as a consequence of a stressed situationamong different
groups of people(Burrows,
Cox &
Simpson,
1977;
King
etal.,
1983). In
addition, the
SACL has
alsobeen
shown
to
have
concurrentvalidity,
with scorescorrelating
with various psychologicalscores
(Burrows
etal.,
1977).
3.4 Dependent Variables
3.4.1 Kinetic Variables
Two
biaxial
electrogoniometers(SG
65,
Biometrics
Ltd,
Gwent, UK)
were usedto
measurebilateral
wristflexion/extension
(FE)
and radial/ulnar(RU)
deviation (Figure
3.2).
The measuring
range of anglesis
150.
Goniometers
were attachedto the
wristswhile
the
arm rested atthe
subject'sside,
elbowsflexed
90,
wrist straight andhand
pronated
to
minimize crosstalk(Bucholz
andWellman,
1997).
The
distal
endblock ofthe
goniometer was affixedto the
dorsal
surface overthe third
metacarpal withthe
centeraxis of
the
hand
and endblock coincident.While
fully flexing
the
wrist, the
proximalendblockwas affixed
to
the
forearm
sothat
when viewedfrom
the
dorsal
planethe
axesof
the
forearm
and endblock were coincident(Figure 3.3).
Double-sided
adhesivetape
was used
between
the
endblocks andskin,
andsingle sided adhesivetape
was placed overthe
top
ofthe
endblocksto
securethe
sensorsduring long
period oftesting.
Cables
weresecured
properly
to
ensure minimuminterference
withthe
subject's performance.Calibration
ofthe
goniometers occurredbefore data
collection.Zero
angles were setto
present neutral
position,
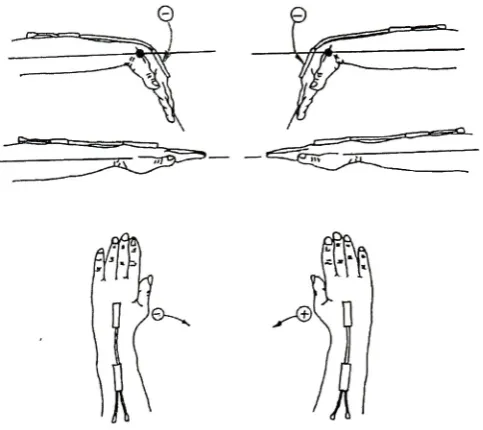
and sign convention wasdifferent
depending
on which side ofdeviation,
while negative angles(-)
denoted
wristflexion
and ulnardeviation for
the
right wrist.
Signs
were oppositefor
the
left
wrist(Figure 3.4).
Radial Ulnar
Flexion
Extension
[image:30.526.133.403.126.323.2]Figure
3.2
Two
planes of wristmovement [image:30.526.184.350.383.606.2]6^
Figure 3.4 Sign
conventionsfor
wrist positiondata
Goniometer data
were collected and analyzedby
DataLINK
data
acquisition systemand management software
(Biometrics
Ltd,
Gwent,
UK).
Data
were collected at50 Hz
continuously for
the thirty-minute
testing
period.All
the
data
weredisplayed
and savedin
alaptop
computer which was connected withthis
system.Joint
angledata from
eachchannel were
filtered
with alow-pass
6th
Butterworth
filter using MATLAB. A
five-hertz (5
Hz)
cut-offfrequency
was usedbased
onthe
frequency
analysis and previousstudies
(Hansson
etal.,
1996;
Serina
etal.,
1999).
This filter
attenuatedthe
higher
frequency
noise whilepreserving
the
integrity
ofthe
wristmotion.After
filtering,
wristpositions were
derived
by
sampling
of angulardata,
andthe
angular velocities andaccelerations were
derived
by
differentiation
and double-differentiation using 3-point
first
ordercentraldifference (Hansson
etal.,
1996).
v,-
=(/>,+,
-/ViV2
x/,
(3.1)
Where p,
=wrist position at sample
/;
v(.=angular
velocity
at samplei;
ai
=angular acceleration at sample
/;
and/.=
sampling
rate.The
absolutevalue ofvelocity
and acceleration were
derived
and usedfor
allfurther
calculations.The
kinematic
wrist motion measuresfor
analysis consisted ofthe
following
statistics
in
the
FE
andRU
planes:Mean,
minimum,
maximumandrange*of wrist angle
Mean,
minimum,
maximumandrange*of wrist
velocity
Mean,
minimum,
maximum andrange*of wrist acceleration
*
range=
maximum
-minimum
The
minimum and maximum wrist positions are extreme wristangles,
andminimum and maximum wrist
velocity
and accelerations are respective peak values ofvelocity
and acceleration with maximum and minimumindicating
different directions
ofchange.
3.4.2 Other
Electrogoniometric Measurements
The
repetitions,
number of wrist motion pause andhigh
risk wrist motion werecalculated
using
the
DataLINK
managementsoftware.Two
different
methods were usedto
evaluate wrist motion repetition.The
number of repetitionsindicates
the
numberofrepeated cycles within a
trace
of wrist positiondata.
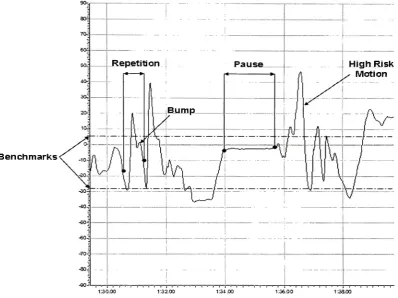
A
repetition was counted when atrace
changeddirection
twice
in
succession.An
example of a repetitionis illustrated in
Figure
3.5. In
orderto
overcomethe
effects ofnoise,
the
changenecessary
to
be
taken
asachangeof
direction
canbe
set asthe
repetitionthreshold
value.The
trace
must reversethreshold
valuewas setat4based
onthe
accuracy
ofthe
goniometer(Biometrics,
2002).
As
illustrated
in Figure
3.5,
the
"bump" onthe
marked repetitiontrace
was notconsideredas a change of
direction because
the
range ofthe
changewas smallerthan
4.
Benchmarks
Figure
3.5 Illustration
of wristrepetition,
pause andhigh
risk valuesMean
powerfrequency
(MPF)
was another measure ofrepetitiveness whichhas
proven useful
for
complex and/orirregular
workfor
whichit is difficult
orimpossible
to
define
repetitivenessbased
on observations(Hansson
etal.,
1996).
Since MPF
is
the
inverse
ofthe
mean cycletime,
it
correspondsto the
establishedinterpretation
ofrepetitiveness as
the
inverse
ofthe
cycletime.
It
was calculatedin
orderto
comparethe
[image:33.526.67.466.153.451.2]spectra of unfiltered position
data
were obtainedusing MATLAB
to
calculateMPF
(Figure 3.6). MPF
was calculatedfor
abandwidth
of0-5
Hz,
as99.5%
ofthe total
powerwas contained
in
this
band for both
wristflexion
anddeviation (Hansson
etal,
1996).
The
formula for calculating MPF is:
(3.3)
Where
f
=frequency
atsamplei
and p=power atsample
i.
s b>
O
TS.
TO
*
_r
c
so
i
o
CI
*o
20
as
ao
i<-10 &
llhfUliifaM
1,-..., ii>,!,,,Frequency (Hz)
Figure 3.6
A
typical
power spectra of wrist positionduring
1 1
minutes ofinterpreting
task
Wrist
motion wasidentified
to
be high
risk whenthe trace
moves over or underthe
marked upper andlower
thresholds.
Wrist
motiondata higher
orlower
than the
marked
benchmark
valueswere counted asillustrated in Figure 3.5. The
upper andlower
limits
were set asthe
maximum and minimumbenchmark
values ofhigh
riskindustrial
jobs
aspresentedin Table 3.2 (Schoenmarklin
andMarras,
1991). Similar
to
repetition,
it
is
possibleto
setthe
minimumtime
allowedfor
ahigh
risk motion-any
movement ofthe trace
over/underfor less
than the
minimumtime
(0.5 sec)
wasignored. The
amountof
the total
time
ofthe trace.
In addition,
the
number of pauses ofthe
wristsduring
interpreting
was calculated.A
pause was counted whenthe
angularvelocity
ofthe
wristwas
below 1.0% for
a continuous period of atleast 0.5
second(Hansson
etal,
1996),
using
the
sametechnique
for calculating high
risk wrist motion.Table 3.2 Benchmark
wrist motion values ofhigh
riskindustrial
job
(Schoenmarklin
andMarras,
1991)
Plane
P(deg)
V(deg/sec)
A(deg/sec2)
Min
Max
Min
Max
Min
Max
RU
FE
-18.96
4.69
-29.08
6.56
-115.1
115.7
-183.7
174.2
-2776
3077
-4927
4471
3.4.3
Electromyography (EMG)
Measurement
Surface EMG
ofthe
uppertrapezius
muscle atthe
right shoulder was obtainedusing bipolar
reusable electrodes(SX230,
Biometrics
Ltd,
Gwent,
UK).
The
electrodeshave
circular active areas with adiameter
of10
mm and aninter-electrode
distance
of20
mm.
Because
ofthe
large input impedance
(>1015ohms),
little
or no skin preparationis
needed,
though
skin was cleaned with alcoholbefore
the
electrodes were applied.Electrodes
were placed abovethe
descending
part ofthe
righttrapezius
musclelateral
ofthe
middle ofthe
line between C7
andthe
acromionin
the
direction
ofthe
musclefibers,
according
to international
guidelines(Mathiassen
etal.,
1995;
Hermens
etal.,
2000). The
electrode andits
cable were affixedto the
skin with double- and single-sided adhesivetape.
A
reference electrode was placed aroundthe
left
anklein
contact withthe
bony
prominence of
the
ankle.EMG data
were recorded at1000 Hz
during
the
entiremeasurements.
EMG
signals werehardware
amplified(1000
gain),
band-pass filtered
(20 Hz
450
Hz)
andAD
converted.The
root-mean-square(RMS)
ofthe
rawdata
wasthen
calculated with a100
mstime
constantusing
the
system software.To
facilitate
comparisonbetween
individuals,
EMG
was normalizedusing
asub-maximal reference
voluntary
contraction(RVC)
test.
The
RVC
was obtained whilethe
subjects were
in
a seatedposition,
holding
the
right arm straight andhorizontal in
90abduction with
the
palmpointing downward.
A
2.5
pounds weight washung
form
the
middleof
the
arm proximalto
the
elbowfor 15
seconds.This
referencetest
wasrepeatedfour
times
with one minute of restin between
each and was performedbefore
the
experiment.
The
averageRVC
value ofthe
middle10
seconds ofthe
four
trials
wascalculated
to
be
the
normalization reference(Mathiassen
etal.,
1995).
The
10th, 50th,
and90th
percentiles of
the
EMG
amplitudedistribution,
meanpower
frequency
(MPF)
ofthe
power spectrum and muscular rest were calculated whichhave been
frequently
usedfor
posthoc
analysis(Hansson, 2000;
Gerard,
2002).
Muscular
rest wasdefined
asthe time
whenRMS
values werebelow 10%
ofRVC for
atleast 1/8
secondasa percentage ofthe
total
duration
ofthe
recording
(Hansson,
2000). A
decrease
ofMPF
has been
usedfor
determining
onset of musclefatigue
(Kumar,
1996).
MPF
was calculatedusing
the
same method asdescribed
in
section3.4.2.
3.4.4
Subjective
Rating
ofPerceived Discomfort
A discomfort survey
was preparedto
monitorsubjects'
perception of
discomfort.
Rating
of perceiveddiscomfort
(RPD)
in
upper extremities was measuredusing
a"nothing
at all"to
10
for
"very,
very
strong."This
scale canbe
usedfor
wholebody
measurement or
for
specificbody
segments.Before
the
work,
the
subjects wereinstructed
onhow
to
ratethe
degree
ofdiscomfort.
Subjects
were askedto
verbally
ratetheir
perceiveddiscomfort
asit
relatedto
four different
areas(hands/fingers,
wrists,
arms/elbows and
shoulders)
onboth
oftheir
upperextremitiesimmediately
after slow andfast
segmentofthe
interpretation
task.
A copy
ofthe
Borg
scaleis included in Appendix
E.
Borg's Scale has been identified
by
many
researchers as a usefultool to
evaluatethe
perceivedexertion ofworkloadin
manual work(Katharyn
etal.,
1994; Resnick,
1995)
andpatient
handling
tasks
(Winkelmolen
etal.,
1994;
Skotte
etal.,
2002).
So
far,
it has
not
been
used on signlanguage interpreters.
3.4.5 Heart Rate
Hear
rate(HR)
was measured withthe
Polar Vantage NV
heart-rate
monitor(Polar Electro Finland).
HR
values were recordedmanually into
anExcel
worksheetevery 15
secondsduring
the
experiment.Mean HR
was calculated afterwards.HR
andHeart
ratevariability have
shown a correlatedrelationship
with psychological arousal andstress
in
previous studies(Thayer, 1970;
Cox
etal.,
1983;
King
etal.,
1983).
HR
has
been
reportedto
rise with other physiologicalindices
ofstress whileHRV
has
typically
been
usedto
indicate
changes of arousal.It
has been implied
that
arousal and stresslevels may
changein
unison,
andtherefore
to
monitor one allowsthe
experimenterto
infer
changesin
the
other.Heart
ratevariability
was not ableto
be
obtainedbecause
the
3.5 Subjects
Subjects included 12 full-time (at least 20 working hours
perweek)
signlanguage
interpreters
from NTID
with atleast 5
years professional experience.Subjects
wererandomly
assignedinto
stressed or non-stressedgroup
with six peoplein
each.The
female/male
ratiosfor
the
stressed andnon-stressedgroup
were4/2
and5/1
respectively.The
averageage,
years ofsigning
andinterpreting
were39.2
(SD=12.1),
21.7
(SD=11.0)
and
14.7
(SD=7.2)
years,
respectively.The
averageworking hours
per week was25.7
(SD=3.9). The
demographic
data
oftwo
stress groups were matched.All
subjects wereright-handed
for interpreting.
Subjects
were screenedusing
the
Nordic Questionnaire
(Kuotinka
etal.,
1987)
for
current upperextremity
musculoskeletaldisorders
andpotential
confounding disorders (Appendix B).
Although
several ofthe
subjectshad
troubles
(ache,
pain,
discomfort)
during
the
last
twelve
months,
all ofthem
werehealthy
and
free
ofache, pain,
anddiscomfort
atthe time
ofthe
experiment.Anyone
whohad
troubles
atthe time
ofthe
experiment would notbe included.
Number
of subjectsreported
troubles
in different
regions of upperextremity
during
the
last
twelve
monthsis
presented
in Table 3.3.
Table 3.3 Number
of subjects reportedache,
pain ordiscomfort
during
the
last 12
monthsHands/Fingers
Wrists
Arms/Elbows
Shoulders
Right
1
2
4
5
3.6 Experimental
Protocol
Subjects
who metthe
prerequisitesin
section3.5
werefirst informed
ofthe
purpose,
methods and experimental procedures usedin
the
study.An
informed
consent,
which was approved
by
RIT
andNTID Institutional Review Board
(IRB)
Committee,
was read and signed
by
each subject(Appendix A). Demographic information
(i.e.,
age,
gender,
sign/interpreting
experience,
working
hours,
etc.)
was collected afterwards.The
demographic
questionnairewasincluded in
the
Appendix C. The
subject wasthen
askedto
put onthe
heart
rate monitor andto
be
seated.EMG
surface electrodes andelectrogoniometers were
then
fastened
to the
subject's righttrapezius
andboth
wrists,
respectively.
All
the
cables were arrangedin
away
that
subjects couldmovetheir
wristsfreely
with minimuminterference. Each
subject wasthen
askedto
fill
outthe
SACL
andRPD
forms.
Following
calibration ofthe equipment,
RVC
EMG data
were collected.A
curtainhanging
from
the
ceiling
was putbetween
the
subject andthe
equipment/investigator
to
minimizepotential psychosocialinfluence
onthe
subject.All
the
subjects were videotaped with a video camera aboutthree
metersin
front
ofthem.
Fo