City, University of London Institutional Repository
Citation
: Tibber, M. S., Kirkbride, J. B., Mutsatsa, S., Harrison, I., Barnes, T. R. E., Joyce,
E. M. and Huddy, V. (2019). Are socioenvironmental factors associated with psychotic symptoms in people with first-episode psychosis? A cross-sectional study of a West London clinical sample. BMJ Open, 9, e030448. doi: 10.1136/bmjopen-2019-030448This is the published version of the paper.
This version of the publication may differ from the final published
version.
Permanent repository link:
http://openaccess.city.ac.uk/id/eprint/22789/Link to published version
: http://dx.doi.org/10.1136/bmjopen-2019-030448
Copyright and reuse:
City Research Online aims to make research
outputs of City, University of London available to a wider audience.
Copyright and Moral Rights remain with the author(s) and/or copyright
holders. URLs from City Research Online may be freely distributed and
linked to.
City Research Online: http://openaccess.city.ac.uk/ publications@city.ac.uk
Are socioenvironmental factors
associated with psychotic symptoms in
people with first-episode psychosis? A
cross-sectional study of a West London
clinical sample
Marc S Tibber,1 James B Kirkbride,2 Stanley Mutsatsa,3 Isobel Harrison,2
Thomas R E Barnes,4 Eileen M Joyce,5 Vyv Huddy6
To cite: Tibber MS, Kirkbride JB, Mutsatsa S, et al. Are socioenvironmental factors associated with psychotic symptoms in people with first-episode psychosis? A cross-sectional study of a West London clinical sample. BMJ Open
2019;9:e030448. doi:10.1136/ bmjopen-2019-030448
►Prepublication history and additional material for this paper are available online. To view these files, please visit the journal online (http:// dx. doi. org/ 10. 1136/ bmjopen- 2019- 030448).
Received 14 March 2019 Revised 06 August 2019 Accepted 19 August 2019
For numbered affiliations see end of article.
Correspondence to Dr Marc S Tibber; m. tibber@ ucl. ac. uk © Author(s) (or their employer(s)) 2019. Re-use permitted under CC BY. Published by BMJ.
AbstrACt
Objectives To determine whether neighbourhood-level socioenvironmental factors including deprivation and inequality predict variance in psychotic symptoms after controlling for individual-level demographics.
Design A cross-sectional design was employed.
setting Data were originally collected from secondary care services within the UK boroughs of Ealing, Hammersmith and Fulham, Wandsworth, Kingston, Richmond, Merton, Sutton and Hounslow as part of the West London First-Episode Psychosis study.
Participants Complete case analyses were undertaken on 319 participants who met the following inclusion criteria: aged 16 years or over, resident in the study’s catchment area, experiencing a first psychotic episode, with fewer than 12 weeks’ exposure to antipsychotic medication and sufficient command of English to facilitate assessment.
Outcome measures Symptom dimension scores, derived from principal component analyses of the Scale for the Assessment of Positive Symptoms and Scale for the Assessment of Negative Symptoms, were regressed on neighbourhood-level predictors, including population density, income deprivation, income inequality, social fragmentation, social cohesion, ethnic density and ethnic fragmentation, using multilevel regression. While age, gender and socioeconomic status were included as individual-level covariates, data on participant ethnicity were not available.
results Higher income inequality was associated with lower negative symptom scores (coefficient=−1.66, 95% CI −2.86 to –0.46, p<0.01) and higher levels of ethnic segregation were associated with lower positive symptom scores (coefficient=−2.32, 95% CI −4.17 to –0.48, p=0.01) after adjustment for covariates.
Conclusions These findings provide further evidence that particular characteristics of the environment may be linked to specific symptom clusters in psychosis. Longitudinal studies are required to begin to tease apart the underlying mechanisms involved as well as the causal direction of such associations.
bACkgrOunD
Epidemiological studies exploring geograph-ical variation in the incidence of psychotic disorders have highlighted various charac-teristics of environments that are typically associated with an increased risk including high population density,1 urbanicity,2 income
deprivation,3 income inequality1 4 5 and low
social cohesion.6 More recently, researchers
have begun to investigate whether such risk factors are associated not with the incidence
of psychosis, but with the severity of psychosis symptoms or symptom cluster scores. Underlying this approach is the notion that exposure to particular types of adverse envi-ronments and experiences may be causally linked to the development or exacerbation of specific psychological symptoms.7 For
example, it has been suggested that densely populated, deprived, inner-city areas may be causally associated with the develop-ment and expression of positive symptoms, for example, paranoid delusions and hallu-cinations.8 9 It has been hypothesised that
strengths and limitations of this study
► This study goes beyond incidence/prevalence-level research to explore the environmental predictors of psychosis at the resolution of symptoms and symp-tom clusters.
► This symptom-level approach has the potential to further our understanding of underlying aetiological mechanisms and is in line with current develop-ments in clinical and research practice.
► The study uses a multilevel analysis approach that is perfectly suited to the nested/hierarchical structure of the data.
► The main limitation of the study is its cross-sectional design, which precludes inferences about causality.
on October 4, 2019 by guest. Protected by copyright.
Open access
this association may be mediated, at least in part, by the increased sense of disempowerment, victimisation and social alienation that (arguably) characterise such neighbourhoods.10–12
To date only a handful of studies have used an epidemi-ological approach to explore the association between socio-environmental adversity and specific psychosis symptoms or symptom clusters. While these studies have typically reported associations between indices of environmental adversity and some form of positive symptom expression, associations with specific symptom items were not consistent across studies. For example, while Oher et al13 reported a significant
associ-ation between neighbourhood-level populassoci-ation density and hallucinations but not paranoia in first-episode psychosis (FEP), Wickham et al14 found an inverse pattern of
associ-ations with neighbourhood-level deprivation in the general population: the most deprived neighbourhoods were associ-ated with increased paranoia but not hallucinations. In addi-tion, reported associations between socioenvironmental adversity and symptom severity in these studies were not restricted to positive symptoms; associations were also seen with depressive symptoms.13 14 (See also Johnson et al15 and
Newbury et al.16)
It is unclear whether this variation—or arguably discrep-ancy—in findings is due to small effect sizes/chance, or instead, methodological differences between studies. For example, the studies described were undertaken on different population samples (clinical vs non-clinical) at different levels of analysis (within a country at the level of neighbourhoods vs across countries) using distinct indices of socioenvironmental adversity (urbanicity, deprivation and/or inequality) and different symptom measures.13 14
Nonetheless, the possibility that specific symptom clus-ters may be linked to defined socioenvironmental risk factors suggests value in moving away from studies of diagnostic incidence towards a focus on the predictors of psychotic symptoms and symptom clusters. By virtue of their greater specificity symptom-level analyses of this kind may be more informative as to the underlying aeti-ological mechanisms involved, as well as potential targets for intervention.
In a recent study of the symptom dimensions under-lying psychotic disorders in a FEP cohort in West London we have shown that symptoms were best characterised by positive, negative and disorganisation syndromes.17
Here, we examined the extent to which these three symptom dimensions were predicted by neighbour-hood-level socioenvironmental factors, including indices of deprivation, inequality and social capital. Given the extant literature in the field13–16 we predicted that at the
syndrome level, indices of socioenvironmental adversity would be associated with higher levels of positive symp-toms. Further, given the findings reported by Oher et al13
in their FEP sample (which most closely matches our own), at an item level of analysis we predicted that socio-environmental adversity would predict hallucinations, but not paranoia.
MethODs setting
Cross-sectional data were originally collected as part of the prospective West London First-Episode Psychosis (WLFEP) study.18 19 Participants presented to secondary
care services within the boroughs of Ealing, Hammer-smith and Fulham, Wandsworth, Kingston, Richmond, Merton, Sutton and Hounslow, between 1998 and 2006. Ethical approval was obtained from local ethics commit-tees of all boroughs included and written informed consent was obtained (RREC 3006). The study was there-fore undertaken in accordance with the ethical standards defined in the 1964 Declaration of Helsinki and subse-quent amendments therein.
Participants
Participants included for participation were aged 16 years or over, experiencing a first psychotic episode, had received fewer than 12 weeks’ antipsychotic medication and spoke sufficient English to facilitate assessment. Potential participants were screened using the WHO Psychosis Screen20 and diagnosed according to Diagnostic
and Statistical Manual of Mental Disorders (DSM)-III21
and DSM-IV criteria22 by two psychiatric research nurses
using the diagnostic module of the Diagnostic Interview for Psychosis.23 See Tibber et al17 and Huddy et al24 for full
details.
Data collection
Information was obtained, with informed consent, from participants’ clinical records and clinical inter-view. Data gathered included basic demographics and symptom scores as well as performance on a number of clinical, cognitive and neuropsychological assessments. All researchers involved in data collection received training to a high standard in the administration of these measures. All data presented were gathered at baseline/ initial recruitment to the study.
Measures
Symptom dimension scores
Each participant’s symptoms were characterised by three symptom dimension scores, which captured the severity of their positive, negative and disorganisation symptoms. These were derived from a second-order principal compo-nent analysis of participants’ individual item scores on the Scale for the Assessment of Positive Symptoms (SAPS) and the revised version of the Scale for the Assessment of Negative Symptoms (SANS)25; see Tibber et al17 and
Peralta and Cuesta26 for further details.
Individual-level covariates
Basic demographic information including age, gender and place of residence was gathered. Ethnicity data were not recorded. In addition, participants were assigned to one of five socioeconomic categories based on their occu-pation using the National Statistics Socio-Economic Clas-sification (NS-SEC) system.27
on October 4, 2019 by guest. Protected by copyright.
http://bmjopen.bmj.com/
Neighbourhood-level exposures
Each participant’s postcode was used to identify their small area neighbourhood, based on the Census Area Statistics (CAS) ward in which they lived at first contact using databases produced by the Office for National Statistics (ONS).28 For each ward—henceforth referred to
as a neighbourhood—a number of indices of urbanicity, deprivation, inequality and social capital were identified; unless specified otherwise, all these data were obtained from the 2001 census.28
Following the work of others,29 population density
(measured in people per hectare) was used as a proxy for urbanicity.
Two indices of deprivation were included in the study: (1) ID: the percentage of individuals who were living in a household with an income of less than 60% of the median, and (2) the Index of Multiple Deprivation (IMD), an aggregate measure of deprivation which comprised 37 indicators, obtained from the English Indices of Depri-vation (2004). Since these data were available for nested geographical areas smaller than the CAS ward—lower layer super output areas (LSOA)—neighbourhood level indices were calculated as the sum of composite LSOA values, weighted by their population size, as described previously.1
In addition, it was also possible to derive indices of
inequality, that is, the dispersion of deprivation. For both the ID and IMD, a corresponding Gini coefficient was calculated for each neighbourhood (GINI-ID and GINI-IMD), based on the distribution of deprivation across its composite LSOAs, as described previously.1
A Gini coefficient of zero represents perfect equality, whereas Gini coefficients approaching 1 indicate maximum inequality.
To calculate a Social Fragmentation Index (SFI), a composite of four separate 2001 census measures (Z-transformed and summed) was used, as described previously30 31: (1) the percentage of people aged 16
years or over and single; (2) the percentage of house-holds that were single occupancy; (3) the percentage of households that were rented; and (4) the percentage of people who were mobile in the 12 months prior to the census date. As a proxy for social cohesion, voter turnout during the 2002 local elections (percentage of the electorate who cast valid ballots) was obtained for each neighbourhood32 as described previously: Social
Cohesion Index (SCI).6 13
Ethnic segregation was estimated using the Index of Dissimilarity (IDS).6 IDS was calculated at the
neighbour-hood level, measuring the extent to which white and black/minority/ethnic (BME) populations were segre-gated across lower output areas (LSOAs) within each neighbourhood (IDS-BME). IDS scores ranged from 0 (no segregation) to 1 (total segregation). In addition, BME ethnic density (DEN-BME) was calculated as the proportion of BME individuals relative to the total popu-lation in each neighbourhood.
statistical analyses
To determine the neighbourhood-level predictors of psychotic symptoms, symptom dimension scores were regressed on predictors using multilevel linear regres-sion. Prior to regression symptom dimension scores were transformed to minimise skew, using an optimal transfor-mation (square root, cube root, logarithmic or inverse transformations) on the basis of which minimised skew to the greatest extent. The data were then Z-transformed to have a mean of 0 and SD of 1, with extreme outliers (>3Z) discarded.
For all regression analyses a null multilevel model was run first to determine the proportion of variance explained by neighbourhood-level random effects. Basic demographic information (age at assessment, sex and NS-SEC) was then added as potential a priori confounders with neighbourhood-level predictors added subsequently using forward stepwise selection. These were only retained/added to the multivariable model if they significantly improved its fit (p<0.05; likelihood ratio test). NS-SEC and sex were coded as categorical variables, with ‘unemployed’ and ‘male’ set as reference levels.
To explore associations at the item-level participants’ responses on the persecutory delusions (SAPS-D1) and (global) hallucinations (SAPS-H7) items of the SAPS were also regressed on predictors. Since the distribution of participants’ responses on these items could not be normalised through transformation they were recoded as binary variables, with scores of 0–2 coded as absent to mild and scores of 3–5 coded as moderate to severe, and analyses undertaken using multilevel logistic regression.
Regression analyses were undertaken using Stata (V.14; StataCorp, College Station, TX).
Patient and public involvement
Patients and public were not involved in the design or analysis of this study.
Data availability
Data from this study are not openly available. The combi-nation of demographic, socioeconomic and geographic information, measured at a fine scale, coupled with the relative low incidence of psychosis would risk compro-mising participant anonymity.
results sample
Unfortunately, information as to the number of potential participants who were evaluated, screened and eventu-ally excluded was not routinely recorded throughout the study. Nonetheless, of the 379 participants for whom data were originally collected, 34 (8.97%) were discarded due to inappropriate residency: no fixed abode (n=5), incom-plete postcode information (n=4) or resident beyond the study’s catchment area (n=25). Of the remaining 345, complete symptom data were available for 335 partici-pants (97.10%). Following transformation to minimise
on October 4, 2019 by guest. Protected by copyright.
Open access
Table 1 Demographic and clinical characteristics of the study sample
Variable Level n (%) Median IQR
Age – – 24.16 20–30.23
Gender Male 210 (65.83) – –
Female 109 (34.17) – –
NS-SEC Managerial and professional 17 (5.33) – –
Intermediate occupations 21 (6.58) – –
Routine and manual 50 (15.67) – –
Unemployed 182 (57.05) – –
Students 49 (15.36) – –
Diagnosis Schizophrenia 195 (61.13) – –
Schizophreniform disorder 40 (12.54) – –
Brief psychotic disorder 3 (0.94) – –
Delusional disorder 3 (0.94) – –
Schizoaffective disorder 42 (13.17) – –
Bipolar disorder 20 (6.27) – –
Major depression with psychotic features 10 (3.13) – –
Not recorded 6 (1.88) – –
DUP – – 12 4–44
SAPS total – – 32 23–45
SANS total – – 18 7–34
Statistics provided include the number and percentage of cases (n/%), the median and the IQR. Age refers to age at assessment.
DUP, duration of untreated psychosis (in weeks); NS-SEC, National Statistics Socio-Economic Classification system; SANS, Scales for the Assessment of Negative Symptoms (global scores); SAPS, Scales for the Assessment of Positive Symptoms (global scores).
skew, eight outlying symptom component scores were removed. With respect to basic demographics, seven data points were not coded at the time of data collection: age (n=2), gender (n=2) and occupation (n=3). Further, voter turnout (SCI) was not available for three neighbourhoods due to the existence of a single, unopposed representative. Taken together, these exclusions resulted in a complete core data set of 319 participants, representing 84.17% of the original sample (see table 1). Within this sample the median age was 24.16 years (IQR=20–30.23), 65.83% were male, 57.05% were unemployed and 75.55% experienced non-affective psychosis. The median SAPS and SANS total global scores were 32 (IQR=23–45) and 18 (IQR=7–34), respectively. Table 1 also shows the duration of untreated psychosis (DUP, measured in weeks) in order to facilitate comparison with other studies (median=12; IQR=4–44). While DUP was not included as an a priori confounder (since there is previous evidence this is not associated with neighbourhood-level factors in London33), rerunning
our primary analyses with its inclusion did not impact on the findings (data available from authors). Participants retained in the analyses did not differ from the original data set on any of the individual or neighbourhood-level variables (data available upon request).
neighbourhood data
Data included were distributed across 113 neighbour-hoods from 14 boroughs. The median number of LSOAs
per neighbourhood was 7 (IQR=6–8) and the median number of participants per neighbourhood was 2 (IQR=1–4). In order to characterise the neighbourhoods further the pattern of associations between key measures (see online supplementary table 1) was explored. Spear-man’s correlations (see online supplementary table 2) indicated that, at a corrected alpha of 0.002 (corrected for 21 comparisons), the more deprived neighbourhoods (high IMD) were significantly more densely populated (p<0.001), less unequal (p<0.001), more socially frag-mented (p<0.001), less socially cohesive (p<0.001) and characterised by higher ethnic segregation (p<0.01) and a higher density of ethnic minorities (p<0.001). Further, more unequal neighbourhoods were significantly less densely populated (p<0.001), less deprived (p<0.001), less socially fragmented (p<0.001), more socially cohesive (p<0.001) and had a lower density of ethnic minorities (p<0.001).
Multilevel modelling of symptom components and symptom scores
Fixed effects
Analyses undertaken while controlling for age, gender and social class (χ2
(7)=24.25, p=0.001) indicated that inequality
(GINI-ID) was significantly associated with negative symp-toms (table 2 and online supplementary table 3): higher inequality was associated with less severe symptoms (coef-ficient=−1.54, 95% CI −2.76 to –0.33, p=0.01). This effect
on October 4, 2019 by guest. Protected by copyright.
http://bmjopen.bmj.com/
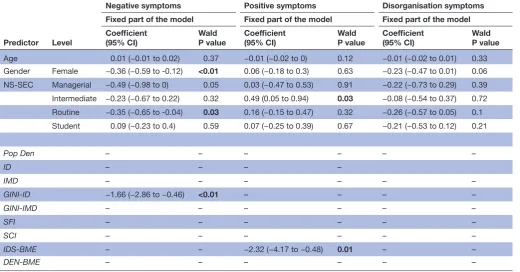
Table 2 Multilevel modelling of symptom components (summary)
Predictor Level
Negative symptoms Positive symptoms Disorganisation symptoms Fixed part of the model Fixed part of the model Fixed part of the model Coefficient
(95% CI) WaldP value Coefficient(95% CI) WaldP value Coefficient(95% CI) WaldP value
Age 0.01 (−0.01 to 0.02) 0.37 −0.01 (−0.02 to 0) 0.12 −0.01 (−0.02 to 0.01) 0.33 Gender Female −0.36 (−0.59 to -0.12) <0.01 0.06 (−0.18 to 0.3) 0.63 −0.23 (−0.47 to 0.01) 0.06 NS-SEC Managerial −0.49 (−0.98 to 0) 0.05 0.03 (−0.47 to 0.53) 0.91 −0.22 (−0.73 to 0.29) 0.39 Intermediate −0.23 (−0.67 to 0.22) 0.32 0.49 (0.05 to 0.94) 0.03 −0.08 (−0.54 to 0.37) 0.72 Routine −0.35 (−0.65 to -0.04) 0.03 0.16 (−0.15 to 0.47) 0.32 −0.26 (−0.57 to 0.05) 0.1 Student 0.09 (−0.23 to 0.4) 0.59 0.07 (−0.25 to 0.39) 0.67 −0.21 (−0.53 to 0.12) 0.21
Pop Den – – – – – –
ID – – – –
IMD – – – – – –
GINI-ID −1.66 (−2.86 to −0.46) <0.01 – – – –
GINI-IMD – – – – – –
SFI – – – – – –
SCI – – – – – –
IDS-BME – – −2.32 (−4.17 to −0.48) 0.01 – –
DEN-BME – – – – – –
Individual symptom dimensions derived from second-order principal component analysis were regressed on predictor variables using multilevel regression analyses. Data reported are from multivariate models that were run while controlling for basic demographic information (age, gender and NS-SEC) and other symptoms (eg, negative and disorganisation symptoms for the positive symptoms). Neighbourhood-level variables are in italics. Significant variables are in bold.
BME, black/minority/ethnic; DEN-BME, BME ethnic density (people per hectare); GINI, Gini coefficient; GINI-ID, Gini coefficient based on index of deprivation; GINI-IMD, Gini coefficient based on index of multiple deprivation; ID, index of deprivation; IDS, index of dissimilarity; IDS-BME, index of dissimilarity for BME versus white populations; IMD, index of multiple deprivation; NS-SEC, National Statistics Socio-Economic Classification system; Pop Den, population density; SCI, social cohesion index; SFI, social fragmentation index.
persisted after further control for other (positive and disorganisation) symptoms (coefficient=−1.66, 95% CI −2.86 to –0.46, p<0.01) as well as absolute deprivation, that is, ID or IMD (coefficient=−2.06, 95% CI −3.32 to –0.8, p<0.01; coefficient=−2.06, 95% CI −3.32 to –0.8, p<0.01). Further, ethnic segregation (IDS-BME) was asso-ciated with positive symptoms after controlling for basic demographics: higher segregation of ethnic minorities was associated with less severe positive symptoms (coef-ficient=−2.36, 95% CI −4.2 to –0.52, p=0.01; table 2 and online supplementary table 4). This effect also persisted after controlling for other symptoms (coefficient=−2.32, 95% CI −4.17 to –0.48, p=0.01) as well as absolute depriva-tion, that is, ID or IMD (coefficient=−2.2, 95% CI −4.09 to –0.32, p=0.02; coefficient=−2.17, 95% CI −4.07 to –0.28, p=0.03). However, no significant neighbourhood-level predictors were found for disorganisation symptoms
(table 2 and online supplementary table 5). Nor did
any neighbourhood-level predictor predict significant variance in paranoid delusions or global hallucinations (symptom-level analyses; online supplementary table 6).
Random effects
Neighbourhood-level random effects did not explain significant levels of variance in symptom dimension
or individual symptom scores, either before or after controlling for demographic variables: negative symp-toms (<0.001%), positive sympsymp-toms (<0.001%), disorgan-isation symptoms (1.45%), paranoid delusions (5.35%) or global hallucinations (<0.001%) (all p>0.05).
DisCussiOn
Fixed effects analyses revealed that each symptom dimen-sion (positive, negative and disorganisation) was associ-ated with a distinct pattern of neighbourhood-level risk factors; thus, higher levels of inequality were associated with lower negative symptoms, and greater ethnic segre-gation was associated with lower positive symptoms. However, contrary to our primary hypotheses, there was no evidence to suggest that the positive symptoms of psychosis were elevated in areas scoring highly on classical indicators of environmental adversity or socioeconomic deprivation (eg, population density, ID or inequality), either at the level of the symptom cluster, or with respect to persecutory delusions or hallucinations specifically.
Nonetheless, the finding that participants living in neighbourhoods characterised by highly segregated BME communities exhibited less severe positive symptoms is interesting, since the IDS speaks to the richness of the
on October 4, 2019 by guest. Protected by copyright.
Open access
social environment. Thus, while a high IDS indicates high segregation between populations, it implies reduced fragmentation within a given ethnic group, that is, a high potential for bonding social capital,34 35 with
poten-tial protective effects against the positive symptoms of psychosis.36 This is consistent with a previous study
under-taken in South East London, which reported a lower inci-dence of psychosis in areas characterised by higher (BME) ethnic segregation,6 as well as research showing that the
risk of psychosis diminishes as the proportion of one’s own ethnic group increases within a neighbourhood.36–39
The finding that participants living in neighbourhoods characterised by higher inequality (GINI-ID) exhibited less severe negative symptoms is inconsistent with the income inequality hypothesis,40 which posits that highly
unequal neighbourhoods are characterised by poorer health outcomes. However, the empirical findings on the association between income inequality and mental health are not clear cut. A recent qualitative synthesis identified 27 relevant studies that explored this issue,41
nine of which met inclusion criteria for a meta-analysis; of these, only one found a positive association between higher inequality and poorer mental health, while six reported mixed results, and two found no significant effects. The authors concluded that the extant literature in the field is characterised by small effect sizes and a high level of heterogeneity in findings. See also Wilkinson and Pickett42 and Tibber.43
The association between inequality and psychosis— rather than mental health in general—is also not clear cut. For example, while no association was seen between income inequality and psychotic symptoms in a study of FEP undertaken in South East London and Nottingham-shire,13 links between inequality and psychosis incidence
or prevalence have been shown using sample sizes compa-rable to our own.1 4 44 It is not inconceivable, however,
that inequality and/or deprivation might be character-ised by relatively independent (or even inverted) patterns of association with psychosis incidence and psychotic symptom severity. For example, one might imagine how in a wealthy neighbourhood, in which health and social services are well resourced (for detection as well as treat-ment), the recorded incidence of psychosis might be elevated but the severity of symptoms in those individuals reduced.
Another potential explanation for the unexpected finding of an association between higher inequality and lower negative symptom scores resides in the sociopo-litical geography of the West London region examined. According to the social capital hypothesis45 areas that are
relatively more unequal, that is, defined by a higher Gini coefficient, tend to have worse health outcomes because they are characterised by lower levels of interpersonal trust and a lack of a sense of shared community (ie, low social capital and high social fragmentation). Thus, poor social cohesion/social capital is thought to mediate the negative effects of inequality on health.46 However, within
the WLFEP data set the inverse was true (table 2): more
unequal neighbourhoods were in fact more socially cohe-sive, characterised by extremes of affluence (rather than deprivation) and a relative abundance of social capital. Although a direct association was not seen between social cohesion and psychotic symptoms in our study, it is possible that more sensitive indices of social capital, or measures that tap into different facets of this complex construct,47 might uncover such an association.48
Finally, the reported association between higher inequality and lower negative symptoms might be explained by the mixed neighbourhood hypothesis (MNH).49–51 According to the MNH, the mixing of
indi-viduals from different socioeconomic backgrounds within areas of high inequality may be protective against cultures of crime, substance use, joblessness and a lack of social opportunity that can become endemic to areas of homog-enous deprivation. Further, the wealthy may also bring higher investment in local infrastructure and resources. Arguably, however, despite considerable political interest in the area, particularly in the USA, reviews of the litera-ture have typically failed to find convincing evidence for the MNH17 41 or the benefits of mixed housing schemes
that are linked to the theory.52
With respect to the limitations of the study, there are several. First, its cross-sectional design precludes infer-ences about causality. Second, the use of national census data from a single time point (2001) in conjunction with participant data collected across a broad temporal window (1998–2006) is likely to have increased measure-ment error, and therefore, potentially reduced the chance of finding a significant effect (inflation of type II error). Nonetheless, this could not be avoided since national census data are only collected every 10 years.
With respect to the variables available for analysis, while ethnicity was controlled for at the ward level, individu-al-level ethnicity was not collected. Consequently, indi-vidual-level ethnicity may have confounded some of the effects of ward-level indices, particularly those relating directly to ethnicity, for example, the effect of ethnic segregation on positive symptoms. Thus, there is ample evidence that the incidence of psychotic disorders is elevated in migrant and minority ethnic populations, an effect that seems to persist even after controlling for indi-vidual-level socioeconomic status.53 Further, psychotic
symptoms may also be elevated in individuals from these populations.54 However, there is evidence to suggest
that ethnicity does not predict differences in psychosis symptom dimension scores; see Oher et al13 for example.
The use of voter turnout as a proxy for social cohesion has some limitations. While there is evidence to suggest that voter turnout does correlate with self-reported inter-personal and societal trust, for example,55 social cohesion
is a complex and multifaceted construct, and as such, is unlikely to be fully captured by a sole crude measure, that is, it may have limited content validity; see Orford.35
Second, voter turnout, by definition, cannot represent individuals who are denied access to the electoral role, for example, individuals under the voting age (<16 years),
on October 4, 2019 by guest. Protected by copyright.
http://bmjopen.bmj.com/
non-citizen migrants, refugees and asylum seekers. This is particularly relevant to the field of psychosis research, since migrant groups have an elevated risk of experi-encing psychotic symptoms; see Siegler56 for a review. Despite these limitations, however, voter turnout has been highlighted as a headline measure of civic and political participation by the Organisation for Economic Co-oper-ation and Development (OECD), has been included in the ONS’ National Well-being Wheel of Measures and, further, has been put forward as a sustainable develop-ment indicator by the Eurostat/OECD/United Nations Economic Commission for Europe (UNECE) Task Force on Measuring Sustainable Development; see Bryan and Jenkins57 for further details.
Finally, since our sample was characterised by relatively few participants per neighbourhood we were likely under-powered to detect random effects, particularly in view of the fact that estimates of random effects are compara-tively unreliable and biased towards underestimation.58
Nonetheless, consistent with our a priori aims, neigh-bourhood covariates (ie, fixed effects) were still modelled and significant associations found.
In conclusion, the findings reported contribute to a growing body of evidence that highlights the importance of social and socioeconomic factors in the expression of psychosis symptoms. Further, they suggest that at least some of the association between psychosis and the envi-ronment may be operating at the level of symptoms, with specific environmental predictors linked to specific symp-toms or symptom clusters. Arguably, this lends support to current calls in both clinical59 and research60 practice for dimension-based models of psychosis,61–63 a debate
that is also echoed more broadly in the field of general psychopathology.63 64 Finally, the findings also highlight
the need for longitudinal research that can begin to eluci-date the underlying mechanisms that link the environ-ment to symptom expression, in addition to establishing the direction of causality.
Author affiliations
1Department of Clinical, Educational and Health Psychology, University College
London, London, UK
2Division of Psychiatry, University College London, London, UK 3School of Health Sciences, City, University of London, London, UK 4Division of Psychiatry, Imperial College London, London, UK
5UCL Queen Square Institute of Neurology, University College London, London, UK 6Clinical Psychology Unit, Department of Psychology, University of Sheffield,
Sheffield, UK
Contributors EJ and TREB designed and oversaw the West London First-Episode Psychosis (WLFEP) study. SM, IH and VH tested the participants. VH and MST designed the current study. MST undertook all analyses and wrote the manuscript. JK provided advice and support on statistical analyses. All authors commented on and contributed to the final version of the manuscript.
Funding The West London First-Episode Psychosis study was funded by a Wellcome Trust Programme grant to EJ, TREB, Maria Ron and Gareth Barker (Grant No 064607/Z/01/Z). JK was supported by a Sir Henry Dale Fellowship, jointly funded by the Wellcome Trust and the Royal Society (Grant No 101272/Z/13/Z). EJ and JK were supported by the National Institute for Health Research University College London Hospitals Biomedical Research Centre.
Competing interests None declared.
Patient consent for publication Not required.
ethics approval Ethical approval was obtained from local ethics committees of all boroughs included (RREC 3006).
Provenance and peer review Not commissioned; externally peer reviewed. Data availability statement No data are available.
Open access This is an open access article distributed in accordance with the Creative Commons Attribution 4.0 Unported (CC BY 4.0) license, which permits others to copy, redistribute, remix, transform and build upon this work for any purpose, provided the original work is properly cited, a link to the licence is given, and indication of whether changes were made. See: https:// creativecommons. org/ licenses/ by/ 4. 0/.
reFerenCes
1. Kirkbride JB, Jones PB, Ullrich S, et al. Social deprivation, inequality, and the neighborhood-level incidence of psychotic syndromes in East London. Schizophr Bull 2014;40:169–80.
2. Heinz A, Deserno L, Reininghaus U. Urbanicity, social adversity and psychosis. World Psychiatry 2013;12:187–97.
3. O'Donoghue B, Roche E, Lane A. Neighbourhood level social deprivation and the risk of psychotic disorders: a systematic review.
Soc Psychiatry Psychiatr Epidemiol 2016;51:941–50.
4. Burns JK, Esterhuizen T. Poverty, inequality and the treated incidence of first-episode psychosis: an ecological study from South Africa. Soc Psychiatry Psychiatr Epidemiol 2008;43:331–5.
5. Burns JK, Tomita A, Kapadia AS. Income inequality and schizophrenia: increased schizophrenia incidence in countries with high levels of income inequality. Int J Soc Psychiatry 2014;60:185–96.
6. Kirkbride JB, Morgan C, Fearon P, et al. Neighbourhood-level effects on psychoses: re-examining the role of context. Psychol Med 2007;37:1413–25.
7. Bentall RP, de Sousa P, Varese F, et al. From adversity to psychosis: pathways and mechanisms from specific adversities to specific symptoms. Soc Psychiatry Psychiatr Epidemiol 2014;49:1011–22. 8. Ellett L, Freeman D, Garety PA. The psychological effect of an
urban environment on individuals with persecutory delusions: the Camberwell walk study. Schizophr Res 2008;99:77–84.
9. Veling W, Pot-Kolder R, Counotte J, et al. Environmental social stress, paranoia and psychosis liability: a virtual reality study.
Schizophr Bull 2016;42:1363–71.
10. Bentall RP, Corcoran R, Howard R, et al. Persecutory delusions: a review and theoretical integration. Clin Psychol Rev
2001;21:1143–92.
11. Freeman D, Garety PA, Kuipers E, et al. A cognitive model of persecutory delusions. Br J Clin Psychol 2002;41:331–47.
12. Mirowsky J, Ross CE. Paranoia and the structure of powerlessness.
Am Sociol Rev 1983;48:228–39.
13. Oher FJ, Demjaha A, Jackson D, et al. The effect of the environment on symptom dimensions in the first episode of psychosis: a multilevel study. Psychol Med 2014;44:2419–30.
14. Wickham S, Taylor P, Shevlin M, et al. The impact of social deprivation on paranoia, hallucinations, mania and depression: the role of discrimination social support, stress and trust. PLoS One 2014;9:e105140.
15. Johnson SL, Wibbels E, Wilkinson R. Economic inequality is related to cross-national prevalence of psychotic symptoms. Soc Psychiatry
Psychiatr Epidemiol 2015;50:1799–807.
16. Newbury J, Arseneault L, Caspi A, et al. Why are children in urban neighborhoods at increased risk for psychotic symptoms? findings from a UK longitudinal cohort study. Schizophr Bull 2016;42:1372–83.
17. Tibber MS, Kirkbride JB, Joyce EM, et al. The component structure of the scales for the assessment of positive and negative symptoms in first-episode psychosis and its dependence on variations in analytic methods. Psychiatry Res 2018;270:869–79.
18. Barnes TR, Hutton SB, Chapman MJ, et al. West London first-episode study of schizophrenia. Clinical correlates of duration of untreated psychosis. Br J Psychiatry 2000;177:207–11.
19. Joyce EM, Hutton SB, Mutsatsa SH, et al. Cognitive heterogeneity in first-episode schizophrenia. Br J Psychiatry 2005;187:516–22. 20. Jablensky A, Sartorius N, Ernberg G, et al. Schizophrenia:
manifestations, incidence and course in different cultures. A world Health organization ten-country study. Psychol Med Monogr Suppl 1992;20:1–97.
on October 4, 2019 by guest. Protected by copyright.
Open access
21. American Psychiatric Association. Diagnostic and statistical manual of mental disorders. 3rd edn. Washington, DC: American Psychiatric Association, 1980.
22. American Psychiatric Association. Diagnostic and statistical manual of mental disorders. 4th edn. Washington, DC: American Psychiatric Association, 2000.
23. Castle DJ, Jablensky A, McGrath JJ, et al. The diagnostic interview for psychoses (DIP): development, reliability and applications.
Psychol Med 2006;36:69–80.
24. Huddy VC, Hodgson TL, Kapasi M, et al. Gaze strategies during planning in first-episode psychosis. J Abnorm Psychol 2007;116:589–98.
25. Andreasen N. Methods for assessing positive and negative symptoms. In: Andreasen N, ed. Schizophrenia : Positive and Negative Symptoms and Syndromes. Modern Problems in Pharmacopsychiatry. Basel: Karger, 1990: 73–85.
26. Peralta V, Cuesta MJ. Dimensional structure of psychotic symptoms: an item-level analysis of SAPS and SANS symptoms in psychotic disorders. Schizophr Res 1999;38:13–26.
27. Rose D, Pevalin D. The National statistics socio-economic classification: origins, development and use. Norwich, 2005. 28. Office for National Statistics. Nomis - official labour market statistics
- 2001 census data. Available: https://www. nomisweb. co. uk 29. Kaymaz N, Krabbendam L, de Graaf R, et al. Evidence that the
urban environment specifically impacts on the psychotic but not the affective dimension of bipolar disorder. Soc Psychiatry Psychiatr
Epidemiol 2006;41:679–85.
30. Congdon P. Suicide and parasuicide in London: a Small-area study.
Urban Stud 1996;33:137–58.
31. Allardyce J, Gilmour H, Atkinson J, et al. Social fragmentation, deprivation and urbanicity: relation to first-admission rates for psychoses. Br J Psychiatry 2005;187:401–6.
32. Rallings C, Thrasher M. Local elections Handbook 2002. Plymouth, 2002. Available: http://www. electionscentre. co. uk/? page_ id= 3684 33. Kirkbride JB, Lunn DJ, Morgan C, et al. Examining evidence for
neighbourhood variation in the duration of untreated psychosis.
Health Place 2010;16:219–25.
34. Becares L, Nazroo J. Social capital, ethnic density and mental health among ethnic minority people in England: a mixed-methods study.
Ethn Health 2013;18:544–62.
35. Orford J. Two Concepts for Understanding Inequalities by Position and Place - social capital and sense of community. In: Community Psychology - Challenges, Controversies and Emerging Consensus. Chichester: John Wiley & Sons Ltd, 2008: 163–81.
36. Das-Munshi J, Bécares L, Boydell JE, et al. Ethnic density as a buffer for psychotic experiences: findings from a national survey (EMPIRIC).
Br J Psychiatry 2012;201:282–90.
37. Boydell J, van Os J, McKenzie K, et al. Incidence of schizophrenia in ethnic minorities in London: ecological study into interactions with environment. BMJ 2001;323:1336–8.
38. Schofield P, Thygesen M, Das-Munshi J, et al. Ethnic density, urbanicity and psychosis risk for migrant groups - A population cohort study. Schizophr Res 2017;190:82–7.
39. Veling W, Susser E, van Os J, et al. Ethnic density of neighborhoods and incidence of psychotic disorders among immigrants. Am J
Psychiatry 2008;165:66–73.
40. Wilkinson RG, Pickett K. The Spirit Level. London: The Penguin Group, 2009.
41. Ribeiro WS, Bauer A, Andrade MCR, et al. Income inequality and mental illness-related morbidity and resilience: a systematic review and meta-analysis. Lancet Psychiatry 2017;4:554–62.
42. Wilkinson R, Pickett K. The Inner Level - How More Equal Societies Reduce Stress, Restore Sanity and Improve Everyone’s Wellbeing. 1st edn. St Ives: Penguin Random House, 2018.
43. Tibber M. Individual- and neighbourhood-level predictors of psychotic symptom dimensions in West London, 2017. Available: http:// discovery. ucl. ac. uk/ 1575465/
44. Boydell J, van Os J, McKenzie K, et al. The association of inequality with the incidence of schizophrenia–an ecological study. Soc
Psychiatry Psychiatr Epidemiol 2004;39:597–9.
45. McKenzie K, Whitley R, Weich S. Social capital and mental health. Br
J Psychiatry 2002;181:280–3.
46. Kragten N, Rözer J. The income inequality hypothesis revisited: assessing the hypothesis using four methodological approaches.
Soc Indic Res 2017;131:1015–33.
47. Clough-Gorr KM, Egger M, Spoerri A. A Swiss paradox? Higher income inequality of municipalities is associated with lower mortality in Switzerland. Eur J Epidemiol 2015;30:627–36.
48. Manley D, VanHam M, Doherty J. Social mixing as a cure for negative neighbourhood effects: evidence based policy or urban myth? In: Bridge G, Butler T, Lees L, eds. Mixed communities: gentrification by stealth? Bristol: The Policy Press, 2012: 1–17.
49. Musterd S, Andersson R. Housing mix, social mix, and social opportunities. Urban Aff Rev Thousand Oaks Calif 2005;40:761–90.
50. Ostendorf W, Musterd S, De Vos S. Social mix and the neighbourhood effect. policy Ambitions and empirical evidence.
Hous Stud 2001;16:371–80.
51. Melis G, Marra G, Gelormino E. Housing and Social Mix - Equity Action, 2013. Available: http://www. health- inequalities. eu/ wp- content/ uploads/ 2016/ 05/ Literature- Review- housing_ social- mix- final. pdf
52. Kirkbride J, Errazuriz A, Croudace T, et al. Systematic review of the incidence and prevalence of schizophrenia and other psychoses in England. London, England, 2012. Available: http://www. psychiatry. cam. ac. uk/ files/ 2014/ 05/ Final- report- v1. 05- Jan- 12. pdf
53. King M, Nazroo J, Weich S, et al. Psychotic symptoms in the general population of England. Soc Psychiatry Psychiatr Epidemiol 2005;40:375–81.
54. Arora M, Mendoza MA, Kim H. A cross-national study of the effects of social capital on voter Turnout. In: Midwest Political Science Association Annual Conference, 2016: 1–23.
55. Parrett NS, Mason OJ. Refugees and psychosis: a review of the literature. Psychosis 2010;2:111–21.
56. Siegler V. Measuring social capital in the UK, 2014.
57. Bryan ML, Jenkins SP. Multilevel modelling of country effects: a cautionary tale. Eur Sociol Rev 2016;32:3–22.
58. Parker GF. DSM-5 and psychotic and mood disorders. J Am Acad
Psychiatry Law 2014;42:182–90.
59. Morris SE, Cuthbert BN. Research domain criteria: cognitive systems, neural circuits, and dimensions of behavior. Dialogues Clin
Neurosci 2012;14:29–37.
60. Allardyce J, McCreadie RG, Morrison G, et al. Do symptom dimensions or categorical diagnoses best discriminate between known risk factors for psychosis? Soc Psychiatry Psychiatr Epidemiol 2007;42:429–37.
61. Van Os J, Gilvarry C, Bale R, et al. A comparison of the utility of dimensional and categorical representations of psychosis. UK700 group. Psychol Med 1999;29:595–606.
62. VAN Os J. The transdiagnostic dimension of psychosis: implications for psychiatric nosology and research. Shanghai Arch Psychiatry 2015;27:82–6.
63. Lahey BB, Zald DH, Perkins SF, et al. Measuring the hierarchical General factor model of psychopathology in young adults. Int J
Methods Psychiatr Res 2018;27:e1593.
64. Kotov R, Krueger RF, Watson D. A paradigm shift in psychiatric classification: the hierarchical taxonomy of psychopathology (HiTOP). World Psychiatry 2018;17:24–5.
on October 4, 2019 by guest. Protected by copyright.
http://bmjopen.bmj.com/