PROCEEDINGS OF MOSES2019 CONFERENCE 2ND INTERNATIONAL CONFERENCE ON MODELLING AND OPTIMISATION OF SHIP ENERGY SYSTEMS 8-10 MAY 2019, GLASGOW, SCOTLAND, UNITED KINGDOM
MOSES2019-02001
Power Hardware in the Loop Platform for Flywheel Energy
Storage System Testing for Electric Ship Power System
Applications
A Downie
a*, A Avras
a, K Jennett
aand F Coffele
aaUniversity of Strathclyde, Glasgow, United Kingdom * [email protected]
Abstract
The UK MoD and Power Networks Demonstration Centre (PNDC) have worked collaboratively to de-risk the integration of power system architecture into future and legacy naval platforms This is being achieved through the development of a 540kVA Power Hardware in the Loop (PHIL) testing facility as part of a project arrangement with the US called “The Advanced Electrical Power and Propulsion Systems Development Project.” The two key components of the PHIL system are: (1) A real time digital simulator system that is capable of simulating naval electrical systems in real time; and (2) A programmable power converter, a uniquely modular solution that can be re-configured for AC and DC output, which is used as the link between simulation and real hardware under test.
The PHIL testbed has been used to investigate a 360kW modular flywheel system developed by GKN. This project involved interfacing the real flywheel to a simulated ship electrical power system. This paper discusses how the PHIL test facility was configured for flywheel testing and the associated challenges, learnings and opportunities from this test setup. This paper also reports on one of the tests that was completed as part of this test program. In this test the FESS is operating in real time connected to a ship power system simulation. The results reported in this paper are particularly significant in that they demonstrate how a real piece of hardware can be tested as part of a ship power system without the need for a full ship demonstrator. This form of testing supports rapid resolution of hardware to ship integration challenges, control methodologies, and power system management schemes for de-risking new systems. This testing is prior to the hardware being connected to any potential full-scale shore based ship demonstrator or being installed directly on-board a ship power system where it could adversely impact ship operation.
Keywords: Power Hardware in the Loop, Real Time, Flywheel, Shipboard Power System.
1
INTRODUCTION
This project involved a productive collaboration of industry, academia, UK MoD and US DoD. The flywheel developed by GKN was first tested by the U.S. Navy's Electric Ships Office (PMS 320) at Florida State University Center for Advanced Power Systems (FSU CAPS) prior to it being returned to the PNDC for verification and further testing as part of the UK MoD research program. Though not reported within the scope of this paper the test schedule completed at FSU CAPS was repeated at PNDC and the results were compared to validate the PHIL test capabilities at both facilities for ship power system energy storage solutions. The Advanced Electrical Power and Propulsion Systems Development Project supported the development of the platform that was later used for the testing reported in this paper.
The purpose of this paper is to report on how the PHIL platform developed at PNDC (and reported on in [1]) has been configured for testing of a 1.8MJ, 360kW Flywheel Energy Storage System (FESS). PHIL testing of the Flywheel Energy Storage System (FESS) in a simulated naval power system platform facilitates and
de-risks the connection of the flywheel to a real naval power system platform. Problems and opportunities identified during testing can then be considered and implemented when connecting to a real world ship power system. As discussed in [2] the future of naval platforms is likely to include a number of new pieces of equipment that can be generically described as ‘high-power pulse loads’. These loads can determinately impact the power system of naval platforms. The FESS is one type of energy storage solution that can be used to supply the pulse load while maintaining standard operation of the existing shipboard power generation equipment. The FESS (as a technology) also has several attributes that help with sporadic high power pulse types of loads including: high power density, low maintenance required between uses, self-contained, modular, etc. These attributes are discussed in detail within [2].
testing of the FESS. Section 4 of this paper demonstrates how the FESS behaves in the context of the ship power system model and PHIL test platform. The case study presented in section 3 and 4 is based on testing completed at FSU CAPS and was repeated at PNDC for validation purposes. Due to the classified nature of much of the research there is limited information on a typical load profiles for some of these new ‘high-power pulse loads’ being implemented in naval power systems. However, the scenario presented was developed based on discussion with the MOD and from their feedback can be considered representative of a notional future pulse based naval load.
2
PHIL FESS TESTING
This section of the paper reports on how the PHIL platform has been configured for testing of the FESS system. In Figure 1, the component parts of the PHIL test platform have been illustrated. This diagram gives a high level overview of the major components of the test apparatus and the device under test:
The RTDS where the ship power system is modelled and the FESS is monitored and controlled;
The Triphase programmable power converter that interfaces the simulated system in the RTDS with the real world Device Under Test (DUT) FESS;
[image:2.595.367.489.234.384.2] The transformer that supplies the Triphase; The device under test i.e. the GKN FESS.
Figure 1. PHIL system overview
In the PHIL test setup, the RTDS simulates the power system and also issues control, protection and voltage setpoints to the Triphase. The RTDS also interfaces directly with the FESS control system for remote monitoring and control. Monitoring includes: state of charge; warning of FESS error conditions; and control for specifying the current output setpoint.
2.1 Baseline PHIL TEST Platform
This section introduces the PHIL system that was used during this project. The two components of the system are the Real Time Digital Simulator (RTDS) and the Triphase programmable power converter. The RTDS is the simulation component of the system where the naval electrical system is modelled in real time. The Triphase is the programmable power converter that interfaces the simulated naval power system to the real world hardware under test.
2.1.1 Real Time Digital Simulator Introduction
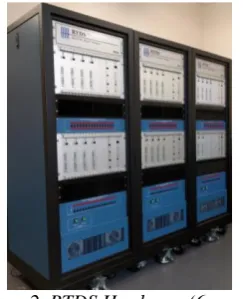
The RTDS can solve a power system model in real time. In this case real time means the voltage and current are calculated at every node (at intersections of power system blocks) in the simulation after short time intervals. 50 μs is typical for power system simulation but small time step simulation is also possible where a simplified power system model can be solved much more quickly (at 1-4 μs). Small time step mode wasn’t used for this project but is often using for modelling fast switching of power electronics. The RTDS hardware, shown in Figure 2, interfaces to power system modelling software called RSCAD. This software is where the model is configured, run and visualised.
Figure 2. RTDS Hardware (6x racks)
The PNDC RTDS system has 6 racks over 3 cubicles, adding supplementary RTDS cubicles allows more complex simulations (where increasing numbers of nodes) can be modelled.
2.1.2 Triphase Programmable Power Converter
The Triphase platform (designed and developed for PNDC) is a configurable AC and DC controllable power supply that implements six 90 kVA power converters (summing to a total of 540 kVA). The Triphase system can be configured to operate both in AC and DC modes of operation. For this project the Triphase was operating in 2-wire DC voltage source mode. In this mode the left and right sides of the system are interfaced in series to give a voltage range of up to 1300Vdc. This configuration was chosen for two reasons:
1. This mode gives the necessary operating voltage for FESS nominal operation i.e. 750V. If the Triphase system was operating in parallel (instead of series) the upper voltage limit would be 650Vdc and this would be insufficient for operating the FESS.
2. The FESS operates as a current source so the Triphase was configured to operate as a voltage source (so the two systems can interface). The control system that operates the real time simulator specifies the operational setpoints to both the Triphase and FESS. In a demonstration test the power system simulation specifies the voltage setpoint of the Triphase. The control system defines the current setpoint to the FESS (depending on the scenario that is being tested).
Triphase in DC mode
Modelled Shipboard Power
System
1.2 MVA Supply Transformer
GKN 3.5 MJ FESS RTDS cubicles
Device Under Test Triphase 750 VDC
11kV
The FESS operates in conjunction with the simulated loads and generators.
The minimum acceptable performance limits of the Triphase system are listed below (in nearly all cases the Triphase operates to a higher specification):
1. 1% precision (of the full-scale) during steady state condition
2. 1ms step response
3. 4o phase delay during steady state condition for
AC applications
[image:3.595.58.273.228.359.2]The six cabinet Triphase configuration is shown in Figure 3.
Figure 3. Triphase platform
2.1.3 The 3.5 MJ FESS
In comparison to other energy storage technologies flywheels can be considered as having an operating range somewhere between capacitor and chemical cell technologies. Flywheels typically have higher power than chemical cells and a longer operational period than capacitor technologies. The flywheel reported in this paper is acting as an ‘energy storage magazine’ [3] attempting to balance energy demand on a ship power system platform, the flywheel tested at PNDC is shown in Figure 4.
[image:3.595.67.270.613.761.2]The GKN FESS has been developed through several phases and the unit tested at PNDC (and reported in this paper) is a 360kW, 3.5 MJ system (3 × Mk 4 flywheels). This FESS has three individual flywheel pods (as shown in the Figure 4). Each pod is self-supporting with respect to control, vacuum, cooling, and a power converter interface. This independence means the FESS system can continue to operate if an individual pod fails or is shut down and removed for maintenance [2].
Figure 4. FESS system tested at PNDC
2.1.4 PHIL System
The PNDC PHIL system interfaces the RTDS platform over a dedicated fibre link to the Triphase system for real time measurement and control. The single direct fibre optic link between the RTDS hardware and the real-time target of the Triphase is made possible by utilising a scalable, lightweight, high data-rate, link-layer serial protocol known as Aurora. This removes the need for signal routing through intermediary steps such as Digital Analogue Conversion (DAC) and Analogue Digital Conversion (ADC) and therefore does not encounter the subsequent propagation delays associated with these steps. Another advantage is that the integrity of the signal is not impacted by electrical noise.
The PHIL configuration enables AC and DC power systems to be modelled in RTDS and interfaced to the Triphase. For example, a power system can be simulated in RTDS and interfaced to a real piece of hardware (like an energy storage system). This capability facilitates end to end testing to examine the interaction between the simulated system and the hardware ‘in the loop’. The shipboard power system is modelled in the RTDS environment and interfaces to the Triphase system using fibre communication. The Triphase can be fed a setpoint from a DC/AC node in simulation and the output from simulation is supplied to the device under test. The Triphase is effectively acting as a ‘bridge’ between the simulation and the real world hardware where the measured node value in simulation defines the output from the Triphase hardware.
2.2 Simulation Model Configuration
The RTDS simulation model has two components: (1) an electrical system model that represents the ship power system and (2) a control system model that controls the demand and generation within the power system
2.2.1 Ship Electrical System Model
Figure 5. Ship electrical system model
2.2.2 Control System Model
The control system of the model is an Energy Management System (EMS) that sets the load dispatch profile depending on the scenario under investigation. The EMS also manages the generation dispatch i.e. the current contribution from: the AC network (via the AFE AC-DC converter), the flywheel, and the battery. The high level functional objective of the EMS is to limit the impact on the AC network. To achieve this design-objective the EMS attempts to set the contribution of the AFE (i.e. AC supply) up to the AFE current contribution limit for the scenario under investigation. The EMS then attempts to maintain this setpoint for the duration of the scenario. The EMS supplies the remaining load demand and variation in demand by dispatching the DC flywheel and battery energy store.
2.3 Monitoring & Control
There are three layers of monitoring within this test system:
FESS monitoring & control: The FESS manufacturer supplied a bespoke Human Machine Interface (HMI) for monitoring and controlling the FESS system. A subset of these control and monitoring variables was interfaced to the EMS system to allow measurement and associated control actions to be implemented within the real time model. This subset of control actions included measured components including: SOC, FESS pod voltage, flywheel speed, etc. and control components included the FESS current setpoint and associated initialisation commands. The FESS was operated as a current source within this test setup i.e. the EMS control gives the FESS a current setpoint.
Triphase monitoring & control: The Triphase system has internal monitoring via voltage and current transducers. These voltage and current measurements were also sent to the EMS for monitoring and control actions within the real time model. When operating as an interface point in PHIL mode the Triphase voltage setpoint is controlled directly from the power system model. The Triphase was operating as a voltage setpoint within this test setup i.e. the power system model and EMS defines the Triphase voltage setpoint.
RTDS monitoring and control: The RTDS power system model enabled monitoring and control of all power system components within the ship power system simulation. This included voltage and current at all power system nodes; as well as status information (e.g. SOC) of modelled power system components.
2.4 FESS Interface to PHL Platform
[image:4.595.60.270.56.225.2] [image:4.595.317.535.212.405.2]The 3.5 MJ FESS device tested requires the following external connections and these are shown in Figure 6:
440 Vac auxiliary electrical supply for internal battery backup storage
24 Vdc electrical supply for control system 750 Vdc electrical connection (DC bus
connection to Triphase)
Water cooling circuit for heat exchanger CAN-Bus to FESS HMI software
Figure 6. FESS interfaces to PNDC test platform
The electrical connection to the simulated ship power system (simulated in RTDS) is via the 750 V DC Triphase bus. The control connection between the FESS and the EMS is implemented via the RTDS input/output cards. All of the other connections: AC auxiliary power, cooling, FESS HMI and DC supply are specific requirements of the FESS and are not inherent components of the PHIL platform.
2.4.1 Control Implementation
Control of the FESS current setpoint from the RTDS is activated by setting the FESS HMI to allow external control. The charging and discharging of the FESS can then be manipulated from controls in the RSCAD runtime in real-time by a test engineer, by activating a preprogramed script for a set test scenario, or directly referenced from an electrical node during the simulation.
2.4.2 Power Transfer
The transfer of power between the Triphase and the FESS is bi-directional. When the FESS is controlled to charge current is drawn from the Triphase power supply and when controlled to discharge, the direction of power flow is reversed.
3
PHIL SIMULATION SCENARIO
This section presents one of the test scenarios completed during this project. The scenario reported is titled “Augmented Distribution Branch with Periodic
Cooling Circuit
Triphase
FESS
RTDS
FESS HMI
Auxiliary Power
Control Circuit Supply
3 Phase 440 V AC 24 V DC
750 V DC
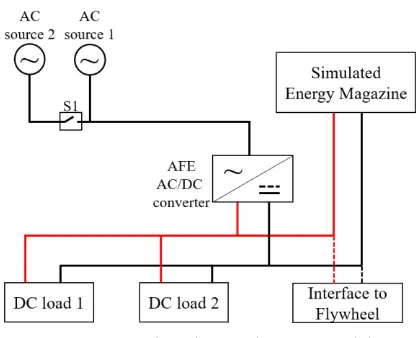
Load Pulsations”. This test scenario evaluates the FESS behaviour when operating in conjunction with a simulated energy magazine concept supplying a single periodically pulsing DC load. The energy magazine contains the FESS in parallel with a simulated Li-Ion battery. The real-time Li-Ion battery model that was implemented for the purposes of this test is based on a standard RTDS library battery model being controlled from the EMS. In this test the simulated DC load is supplied both from the stored energy of the FESS, through the AC ship power system via the AFE, and through power drawn from the simulated Li-Ion battery. The load characteristics for this demonstration are representative of a notional future pulse based naval load such as a Directed Energy Weapon. For the purposes of this test the AFE is not intended to be bi-directional, it is solely suppling power from the AC side of the network to the DC side. The EMS has been configured to let the FESS charge between pulsed load demands, this enables the FESS to recover a portion of SOC and subsequently be able to supply the pulsed load for longer than if it wasn’t allowed to recharge.
3.1 Test Scenario Configuration
[image:5.595.322.521.238.462.2]The relevant initial parameters for this scenario setup are shown in Table 1 and Table 2. The AFE lower current limit is referenced from the DC side, where a negative current at the AFE translates to a power transfer from the DC side to the AC side. The FESS has a feed forward control signal derived from the pulsed load profile. The feedforward control is configured to compensate for the delay in the FESS response to a setpoint control signal.
Table 1. Relevant parameters at start of tests
Test Parameter Value
FESS initial SOC 90 %
AFE lower current limit 0 kA
Battery initial SOC 90 %
[image:5.595.57.280.456.606.2]DC bus voltage 750 V
Table 2. Pulsed DC load settings
DC Load Parameters Value
Power rating 150 kW
Pulse Frequency 0.1 Hz
Duty cycle 50 %
Power ramp rate 2 MW/s
The scenario is split into three different iterations, each modifying the AFE current limit and the duration of the applied DC pulsed load, as tabulated in Table 3.
Table 3. Values of directional AFE current and duration of applied pulsed load per scenario test Test stage AFE current limit (kA) Duration (s)
Test 1 0.025 40
Test 2 0.05 65
Test 3 0.075 120
The increase in the AFE limit corresponds to an increase in AFE contribution to both the pulsed load
demand and also the rate at which the FESS recharges between load pulses.
4
SIMULATION RESULTS AND
ANALYSIS
4.1 Test 1
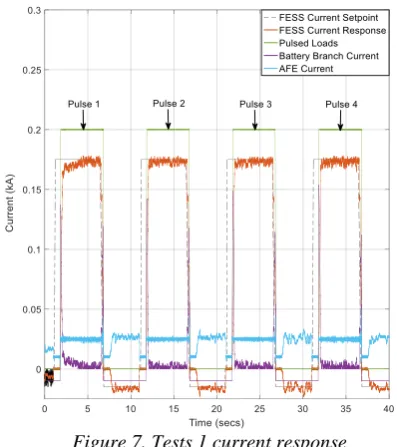
Plotted results from test 1 are shown in Figure 7. In Figure 7, four load pulses (annotated on the graph) of five second duration are applied over the test 40 second window duration. As discussed within previous sections of this paper, this load profile can be considered representative of a notional future pulse load (based on feedback from the MOD).
Figure 7. Tests 1 current response
In the graph the following signals are plotted: current setpoint (control signal to the FESS), FESS Current Response (measured current injection from the FESS), the Pulsed Loads current, the Battery Branch Current and the AFE current. In Figure 7 it can be observed that the same pulse is repeated four times. A single pulse (pulse 2) has been plotted in Figure 8.
Figure 8. Simulation scenario single pulse
[image:5.595.320.539.560.732.2]absorbing) and Charging (FESS is absorbing current). The portion of the test with the most interaction between the AFE, battery, FESS and load are during the ramp up and ramp down within the Discharge periods. To support the following description two periods are shown in isolation in Figure 9 and Figure 10.
Figure 9. Rising edge of discharge period
In Figure 9 the rising edge of the discharge period is shown. The delay between the setpoint and the FESS response is a result of the feedforward control system implemented in the RTDS. This control system compensates for the slow response of the FESS i.e. because the FESS has a known delay of approximately 0.5 s, the FESS setpoint control signal is sent 0.5 s in advance of when the FESS current injection is required. This delay was identified during the test programme and the feed forward control was implemented in the RTDS control during commissioning of the test setup as a temporary fix to improve the response. GKN were also notified and have since updated the associated control system to improve the speed of the FESS response.
The pulse load starts at 11.77 s and ramps up to 200 A within 0.08 s. The FESS immediately starts to inject more current to supply the load, however, because it responds slower than the load ramp both the simulated AFE and battery are also controlled to ramp up to compensate. The AFE ramps up at the same rate as the load and is capped at the “Directional current limit from AC to DC side of the AFE converter” for this test.
When the AFE reaches the current limit of 25 A, the battery starts to supply current proportional to the load current demand that is not being fulfilled by the FESS, so that the load demand is always being met.
As the FESS supply continues to ramp up the supply from the battery transitions from increasing contribution to decreasing and begins to ramp down. It can be observed from the graph that the battery is controlled to ramp down with a profile that is inversely proportional to the FESS current ramping up.
When the FESS reaches full current output (175 A), 0.4 s after beginning to inject current, the battery
[image:6.595.58.279.137.349.2]continues to inject current to compensate for variability in the FESS supply.
Figure 10. Falling edge of discharge period
The load pulse is maintained until 16.77 s as shown in Figure 10 and is then controlled to ramp down. The FESS is slower to react than the simulated load so to ensure that the FESS does not inject current when the load is off the control signal to ramp down the FESS output is sent at 16.43 s. This means the control signal is preceding the actual load reduction (feed forward control).
As with the ramp up period the FESS response lags the control signal, in this case by approximately 0.1s. The FESS response does not follow the control ramp but instead turns off in a stepped response. The battery is controlled to compensate inversely to the FESS response, stepping inversely proportional to ensure current injection balances current demand.
It can be observed that on the final step the FESS undershoots, absorbing current before returning to idle operation. At this time the AFE and battery are both controlled to inject more current temporarily to balance the current demand and supply.
After the FESS undershoots it returns to idle mode (i.e. neither injecting or absorbing current). The FESS responds to the charge control signal in 0.7 s.
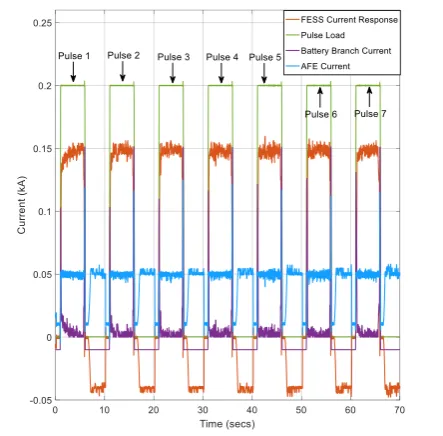
4.2 Test 2
The resultant graphs from test 2 are shown in Figure 11 and Figure 12. The test is a repeat of test 1 but over a 65 second window instead of 40 seconds and with a “Directional current limit from AC to DC side of AFE converter” of 50 A instead of 25 A. This means the AFE supplies more current during the Discharge and Charge periods resulting in the FESS supplying 150 A to the load and charging at 40 A.
Figure 11. Test 2 current response
[image:7.595.325.521.93.311.2]Both the reduction in supply during discharge and the higher charge current mean the FESS effectively depletes it’s SOC at a slower rate. A comparison of the SOC of the FESS between test 2 and test 1 is shown in Figure 12.
Figure 12. Test 2 SOC response
It can be observed that the SOC in test 1 decreases faster than the SOC in test 2. In this case there are 7 pulses and the characteristics of each individual pulse are the same as in test 1.
4.3 Test 3
The graphs from test 3 are shown in Figure 13. This is a repeat of test 1 and 2 but over a 130 s window and with a “Directional current limit from AC to DC side of AFE converter” of 75 A. This means the AFE supplies more current during the Discharge and Charge periods resulting in the FESS supplying 125 A to the load and charging at 65 A. Both the reduction in supply during
discharge and the higher charge current mean the FESS depletes the SOC at a slower rate.
Figure 13. Test 3 current response
In this test it can be observed that the FESS reaches a critically low SOC at 103 s and the battery has to begin supplying more current to meet the demand. This is more clearly illustrated in Figure 14.
Figure 14. Test 3 SOC response
It can be observed that when the FESS reaches a SOC of 20% the battery begins supplying more current to compensate for the reduced FESS input, the battery therefore begins to discharge at a faster rate. In this case there are 12 pulses and the characteristics of each individual pulse is the same as in tests 1 and 2.
5
CONCLUSIONS
[image:7.595.57.279.370.594.2] [image:7.595.323.520.395.613.2]platform. This scenario involved applying a single pulsing DC load over three increasing tests durations and evaluating how the FESS responded. A summary of the findings from this test are listed below:
1. The testing supported the initial hypothesis that the rotational energy storage system of the FESS does not react quickly enough to supply the pulse load (when operated in isolation). The FESS is slower to respond than the load and there is a persistent delay between the control input to the FESS and the response. Also due to the nature of FESS system the FESS does not maintain a steady response during Discharge or Charge periods i.e. there is a noise component on the FESS response.
2. The battery control has been designed to compensate for the non-ideal FESS response in that when the combined AFE and FESS current contribution is less than the load the battery contributes the deficit. This suggests either a similar component to the battery would be required in a real ship power system or the limits on the AFE current contribution would need to be reduced.
3. If the AFE control was designed to compensate for the FESS response, instead of the battery fulfilling this role, then it could have a greater impact on the operation of the rest of the ship power system. As the sudden ramps in power that would be required by the AFE would create unwanted short term demands on the ships diesel generators.
The FESS was not specifically designed for pulse load demand but instead represents an advanced rotational energy storage device intended for shipboard applications. For this test the FESS represented an energy storage system of opportunity that could be used to explore RTDS capabilities and allow the demonstration of a FESS in a notional shipboard power system.
6
FUTURE WORK
Further testing of the FESS system as part of the PNDC PHIL platform is planned for the 2019 PNDC MOD research program. The following list contains both scheduled and aspirational future work. This builds on the testing that has already been completed.
The testing of an updated version of the GKN FESS system. The FESS system tested within this project is presently being updated to improve the speed of response to a control setpoint. The FESS will be re-tested at PNDC after the upgrade to evaluate the improvement in the system response. Using the information gained from the PHIL
testing to better inform the development of a virtual FESS model that can be used in future naval platform power system studies.
Utilising a more comprehensive AC ship power system model including typical ship power systems components. This would facilitate an understanding of how critical ship loads could be impacted by different power system scenarios and opportunities/risks of operating the FESS as part of the system.
APPENDIX A – ABBREVIATIONS
AC Alternating Current
ADC Analogue Digital Conversion AFE Active Front End
DAC Digital Analogue Conversion DC Direct Current
DUT Device under test
EMS Energy Management System FESS Flywheel Energy Storage System FSU CAPS Florida State University Center for
Advanced Power Systems GKN Guest, Keen and Nettlefolds HMI Human Machine Interface MOD Ministry of Defence
PHIL Power Hardware in the Loop
PNDC Power Networks Demonstration Centre
RTDS Real Time Digital Simulator SEM Simulated Energy Magazine SOC State of Charge
References
[1] K. I. Jennett, F. Coffele, and S. Lewinton, “Testing
Integration of Naval Electrical Engineering Systems at the Power Networks Demonstration Centre.” Enging As A Weapon VII International Symposium, Brunel Square, Bristol, UK. 20-21 June, 2017.
[2] A. Tate and T. Rumney, “Taking the Dragon(Fire) to
sea: UK MOD efforts to de-risk the integration of Laser DEW.” Engine as a Weapon International Symposium VII, Brunel Square, Bristol, UK. 20-21 June, pp. 1–9, 2017.
[3] K. I. Jennett, “The next stage of naval electrical