Designing an optimised supply network for
sustainable conversion of waste agricultural
plastics into higher value products
Athanasios Rentizelasa, *, Agnessa Shpakovaa , Ondřej Mašekb
a Department of Design Manufacture and Engineering Management, University of Strathclyde, 75 Montrose Street, G1 1XJ, Glasgow, United Kingdom
b UK Biochar Research Centre, School of GeoScience, University of Edinburgh, Crew Building, King’s Buildings, EH9 3FF, Edinburgh, United Kingdom
* Corresponding author. E-mail: [email protected]; Tel: +44 (0)141 548 2374.
E-mail addresses: [email protected] (A. Rentizelas),
Abstract
Agricultural plastics are currently characterised by a predominantly linear take-make-dispose value chain, thus being a major stream of waste that contributes to significant environmental and economic issues. Therefore, policy makers have recently indicated the adoption of circular economy approaches as the way forward for plastics. This study addresses the problem of agricultural plastic waste as a major stream of landfilled waste by assessing the potential for recycling the plastic into higher value products through pyrolysis and by optimally designing the respective supply network to support this process. A Mixed Integer Linear Programming (MILP) model is developed to optimise the end-to-end supply network design, from the waste generation stage up to the end consumer of the produced material. The model is supported by experimental results on the pyrolysis performance for contaminated plastic samples. The model is applied in a case study of the Scottish agricultural sector to showcase its potential in assessing the feasibility and financial viability in addition to the positive environmental impact on agricultural plastic waste supply networks. The results demonstrate the potential of using the pyrolysis technology for agricultural plastic waste recycling as an example of a circular economy approach and the benefits of using the developed model for decision making purposes, as well as the potential for waste reduction and the implications for farmers’ operations.
1. Introduction
Plastic materials are commonly used in agriculture, primarily for the purpose of plant/soil coverage, but can also be applied for fumigation, irrigation, or silage (Espí et al., 2006). Scotland is home to over 1500 small and large farms, which due to a relatively cold climate utilise a substantial amount of plastic in order to create warmer microclimate or stretch the harvesting period on colder months of the year. Scottish farms use various types of plastic, commonly being used in polytunnels, to extend the production season and increase productivity, mulching, to maintain humidity and prevent weeds from growing, and silage, to store grains and straw during the winter. They usually have to pay a fee for disposing waste plastics and transporting it to the landfill or other disposal facilities. The plastic waste has to be removed promptly from the fields to facilitate other agricultural operations.
Agricultural plastics are a major waste stream in Scotland, with an estimated volume of around 20 000 t per year going to a landfill or incineration facilities (ZeroWasteScotland, 2015). This landfilled or incinerated plastics volume constitutes 81% of the total volume of agricultural plastics used yearly in Scotland and is a much higher proportion that the average in the rest of Europe. In the European Union (EU) demand for plastic constitutes a fifth of the global demand (PlasticsEurope, 2015) and amounted to 25.8 Mt in 2015, of which 5% was used in agriculture (European Commision, 2018).
The usage of plastic in the fields is also related to the topic of sustainable agriculture. Plastic covers may reduce the energy consumption and the need in fertilisers and pesticides, which are often discussed as having a negative impact on the soil health and environment within the industrial agriculture sector (Horrigan et al., 2002). But without established downstream supply networks and recycling practices, plastic pollution effects might counterbalance the benefits. The issues of plastic recycling are rarely discussed in the sustainable agriculture literature, as it is mostly focused on more pressing issues, such as water and land usage efficiency and decreasing biodiversity (Altieri, 2018). However, EU included waste management in the agenda as an important component of integrated farming, an approach that aims to promote sustainable practices in agriculture (EISA, 2012). This study contributes to this conversation and expands the field of sustainable agriculture by considering the plastic waste management aspect.
There are existing technologies to process plastic waste into products that can be used in other sectors (Al-Salem, 2009a). However, the existing studies on supply chain (SC) optimisation focus on the recycling of either agricultural biomass (Banasik et al., 2017; Dunnett et al., 2008; ten Kate et al., 2017) or plastic in other sectors (Bing et al., 2015; Ohnishi et al., 2018). The limited existing plastic recycling practices in the agricultural sector might be due to the lack of robust models that would help practitioners to design the supply network in an optimal way. Optimising the design of such a system can make it financially viable and harvest environmental benefits, if certain design constraints and challenges are met, including remoteness of dispersed farm locations, seasonality in plastic waste availability, and contamination of the material with soil that may require additional processing.
In addition to that, the existing technological solutions are largely focused on the domestic plastic waste recycling, separated from municipal solid waste (Ohnishi et al., 2018), and the applicability in the agricultural setting needs to be tested. Various options for thermochemical processing of solid wastes exist, including incineration, gasification and pyrolysis (Haig et al., 2015). Commercial facilities for processing of waste materials have been used predominantly for material volume reduction and energy recovery, where incineration and gasification offer some advantages (Lopez et al., 2017). However, pyrolysis can be used to obtain a range of co-products (composition depends on feedstock and pyrolysis process conditions used), including solids (e.g., polyethylene (PE) wax, char, etc.), liquids (oils and tars), and combustible gases (Miandad et al., 2016). Due to its better suitability for recovery of value-added products alongside recovery of energy, pyrolysis was adopted as the technology of choice for this study.
principles of circular economy in agricultural operations by creating useful products from a current waste stream.
The rest of this paper is structured as follows: firstly, it provides a literature review on existing technological solutions for plastic recycling and related optimisation models on SC design in Section 2. Then, in Section 3, it discusses methodological considerations for the pyrolysis experiments and in Section 4 the proposed SC optimisation model is presented. In Section 5 the case study is presented followed by results of the model application and the sensitivity analysis. The results are discussed synthetically in section 6. Finally, section 7 presents the conclusions of this study.
2. Literature review
2.1 Review of supply chain models
The developed model is intended to design the SC for upgrading agricultural plastic waste to higher value products, in a circular economy perspective. Therefore, the literature review was initially focused on the intersection of these two areas. The search for “agricultural plastic waste supply chain” in Google Scholar and Scopus produced little result and was mostly dedicated to the reuse of plastic in order to reduce food waste (Singh et al., 2016). If plastic and agricultural waste are searched separately, with regards to the former the studies mainly address the design of reverse SC for plastics recycling (Bing et al., 2015; Sheriff et al., 2017), SC on the conceptual level, like scenario planning or system design of waste-to-energy SC in urban environment (Kinobe et al., 2015; Ohnishi et al., 2018; Santibañez-Aguilar et al., 2013), technological aspects of waste recycling with the focus on broader spectrum of waste (Mekonnen et al., 2014) or new ways of disposing plastic waste, such as incorporating in concrete (Sharma and Bansal, 2016).
A substantial number of literature reviews have already categorised existing biomass supply chain optimisation models (Table A2 in the Appendix). Therefore, this study might benefit from a review of the past reviews too to understand the current state of the field and work that has already been done. Existing reviews classify models by a number of parameters, of which the most frequent ones are decision level being strategic, tactical or operational (An et al., 2011; Awudu and Zhang, 2012; De Meyer et al., 2014; Ghaderi et al., 2016; Iakovou et al., 2010; Sharma et al., 2013), methods used in optimisation (Awudu and Zhang, 2012; De Meyer et al., 2014; Mafakheri and Nasiri, 2014; Shabani et al., 2013; Sharma et al., 2013), stages of SC (Bekkering et al., 2010; Mafakheri and Nasiri, 2014; Mirkouei et al., 2017) and barriers / constraints (Bravo et al., 2012; Mafakheri and Nasiri, 2014) or uncertainty (Awudu and Zhang, 2012; Ghaderi et al., 2016).
On the strategic level the models are designed to examine facilities’ parameters, such as location of storage, pre-treatment or processing facility (De Meyer et al., 2014; Sharifzadeh et al., 2015; Walther et al., 2012), technology in use (Giarola et al., 2011; You et al., 2012), or capacity of the facility (You and Wang, 2011). Other types of strategic decisions are focused on the input and the output of the SC, e.g. types (De Meyer et al., 2014) and quantity (Bowling et al., 2011; Papapostolou et al., 2011) of biomass to be processed, and types (Kim et al., 2011) and quantity of final products (Zamboni et al., 2009). Other models optimise variables that are usually included as constraints, e.g. demand for a final product (Huang et al., 2010) or financial risks (Dal Mas et al., 2010). Most of the models employ a Mixed Integer Linear Programming (MILP) method; Few researchers use Mixed Integer Non-Linear Programming (Corsano et al., 2011) or a hybrid of genetic algorithms and sequential quadratic programming (Rentizelas and Tatsiopoulos, 2010) for strategic decision making. The majority of the models aim at maximising the economic performance, e.g. maximising NPV (Rentizelas et al., 2009; Walther et al., 2012) or minimising costs (Aksoy et al., 2011; Dunnett et al., 2008), but a few also incorporate environmental criteria, such as greenhouse gas emissions converted into the equivalent monetary value (Giarola et al., 2011; Zamboni et al., 2009), and even social objectives, such as maximising the number of jobs created (You et al., 2012).
2010). In the context of this research the environmental impact of any solution will be an improvement compared to the baseline scenario. Therefore, environmental parameters should not constrain the system.
Many models combine decision support on both the strategic and tactical decision levels (Aksoy et al., 2011; Bowling et al., 2011; Corsano et al., 2011; Sharifzadeh et al., 2015), but fewer models focus on the tactical level exclusively (Akgul et al., 2012; Zamboni et al., 2011), using predominantly MILP method. On the operational level the types of decisions are similar to the ones on the tactical level, but on a different time horizon, with the exception of scheduling problems that are specific to the operational level only. Tactical and operational decision parameters include inventory levels (Rentizelas and Tatsiopoulos, 2010; You and Wang, 2011), the flow of inventory (Corsano et al., 2011; Sharifzadeh et al., 2015) and transportation logistics (Giarola et al., 2011; Huang et al., 2010), and can be, and quite often should be, incorporated in the model, if the model aims at evaluating and optimising the economic viability of the system and environmental impact on the surrounding environment. And since most of the tactical decisions are merged with the strategic ones, the objectives of the models similarly mostly aim at estimating the economic viability of the system with environmental parameters embedded in some of them. The models focused on tactical decisions also only aim at minimising the costs, but the costs are calculated on a shorter term (Akgul et al., 2012; Zamboni et al., 2011).
A lot of the constraints on the tactical decision level are difficult to separate from the strategic level. For instance, in order to optimise the location of production facilities one needs to estimate production rates (Rentizelas et al., 2009; Zamboni et al., 2011), yield (Dal Mas et al., 2010; Huang et al., 2010), operation costs (You and Wang, 2011), storage capacity (Papapostolou et al., 2011) and inventory (Rentizelas and Tatsiopoulos, 2010; You and Wang, 2011). It also requires to take transportation logistics into account, if the model is built for up- or down-stream SC, e.g. transportation costs (You and Wang, 2011) or capacity (Papapostolou et al., 2011). All these parameters are required to estimate the economic viability of the system in this study. Apart from that, the models typically include logical constraints, such as mass balance (Freppaz et al., 2004; Huang et al., 2010) and non-negative range of parameters (Rentizelas and Tatsiopoulos, 2010), and these constraints were also considered in this study.
The model in this study is primarily designed to support strategic decisions, more specifically to choose a suitable location for the processing facilities. However, it also supports tactical decisions by suggesting production levels at each facility and the associated material flows in and out of each facility, in order to estimate the economic viability of the system. The environmental impact of the system is of less concern, since the feedstock is taken from plastic waste which would end up in the landfill otherwise. Therefore it makes this case an example of a zero waste production system with a positive environmental impact.
of SC, the majority of models either take the whole SC into account, or are designed to optimise the upstream part of it, as it has a wider range of decisions to be made, such as sources of feedstock, storage, pre-treatment, and transportation of materials until they reach production facilities, as opposed to the downstream SC, where the final product is expected to get to the customer directly from the conversion facilities (De Meyer et al., 2014). The models that focus on the downstream related issues, are mostly concerned with demand (Dal Mas et al., 2010). The midstream part of SC is often treated as a black box, but some models explicitly focus on operational aspects of production (Zamboni et al., 2009). In this study the technology of pyrolysis is new to the market (UK farmers), therefore, due to its novelty the whole SC (upstream and downstream) is considered in the optimisation model.
As was mentioned before, the majority of models are built for cellulosic residue-based biomass-to-biofuel SC, primarily second and third generation of biofuels, and a substantial number of models look at the food crops to biofuel SC or biomass processing in other areas of application (e.g. building heating) (Yue et al., 2014). But these types of feedstock are only a fraction of feedstock potentially available for energy generation, and some researchers have acknowledged other types of waste that could also be considered, such as plastic. However, only a few SC optimisation models focus on alternative sources for bioenergy and biofuel (Banasik et al., 2017). This paper suggests a different perspective on the waste recycling, where plastic is not viewed as a waste that needs to be recycled, but rather as a source for other types of product – raw materials, energy or fuel. In order to understand the specifics of the SC network design, it is necessary to review the technology aspects of plastic recycling first.
2.2 Review of plastic recycling and processing technologies
Recycling of plastics is limited at the moment. In the European Union (EU) alone 29.7% of post-consumer plastics are recycled, 31% are sent to landfill (European Commision, 2018) and 39.5% are used for energy recovery (PlasticsEurope, 2015). Although the amount of plastic sent to landfill has been on a downward trend in the EU in the past decade, the situation is far from satisfactory and varies significantly among EU member states. It is interesting to note that several EU countries have banned plastics from landfills, and therefore alternative ways to dispose them have been sought. To avoid landfilling of waste plastics and to maximise their value, different valorisation options have been proposed. These can be grouped into four categories, as follows:
Secondary (mechanical) recycling is the conversion of plastic waste into plastic products via mechanical means (Kartalis et al., 2000). This option is only suitable for single-polymer plastic. The quality of mechanically recycled plastics and resulting products is the main concern, as a number of degradation processes can affect the recycling process and resulting products (Al-Salem, 2009b; Basfar and Ali, 2006; Kowalska et al., 2002). Using residual agricultural plastics to make eco-composites through mechanical recycling has also been investigated in the literature (González-Sánchez et al., 2014; Martínez Urreaga et al., 2015)
Tertiary (chemical) recycling is the conversion of polymers to either monomers (monomer recycling) (Yoshioka et al., 2004) or useful petrochemicals (feedstock recycling) by thermal depolymerisation (Al-Salem et al., 2010). Process such as pyrolysis, gasification, and steam or catalytic cracking fall into this category of recycling technologies. Decomposition by pyrolysis can produce monomer units that can be recycled as feedstock for production of new polymers or fuels. Two options exist in terms of available pyrolysis technologies. In the so-called fast pyrolysis, small particles of plastics are converted to liquid products by rapid exposure to heat (high heating rate, 10’s-100’s K/s), often in a fluidised bed reactor. The second option is so-called slow pyrolysis where particles of plastic are gradually heated (heating rate <1-2 K/s) to the pyrolysis temperature in a fixed or moving bed reactor. The choice of technology depends on the type of plastics to be processed, scale and desired products (Al-Salem et al., 2017). Thermal decomposition by gasification yields hydrocarbon gases and hydrogen that can be used as fuels or chemical feedstock (Malkow, 2004).
Quaternary (energy recovery) recycling. Due to their hydrocarbon nature, waste plastics have a high calorific value compared to other wastes, and therefore they are suitable as high quality fuel. Incineration of plastics reduces its volumes by 90-99% and produces mainly water and carbon dioxide as gaseous products, and small amounts of solid residue. However, combustion of plastics also generates volatile organic compounds (VOCs), smoke (particulate matter), particulate-bound heavy metals, polycyclic aromatic hydrocarbons (PAHs), polychlorinated dibenzofurans (PCDFs) and dioxins, and therefore a considerable treatment of the flue gases is necessary (Al-Salem et al., 2010).
In this work, the tertiary recycling of agricultural plastics was explored, as potentially the most promising option, due to its ability to recycle some of the material back into the plastics production process and its flexibility to produce a variety of end products, compared to just energy recovery.
3. Pyrolysis laboratory experiments
the remaining solids were combusted, leaving behind only ash. The results of this analysis are summarized in Table 1.
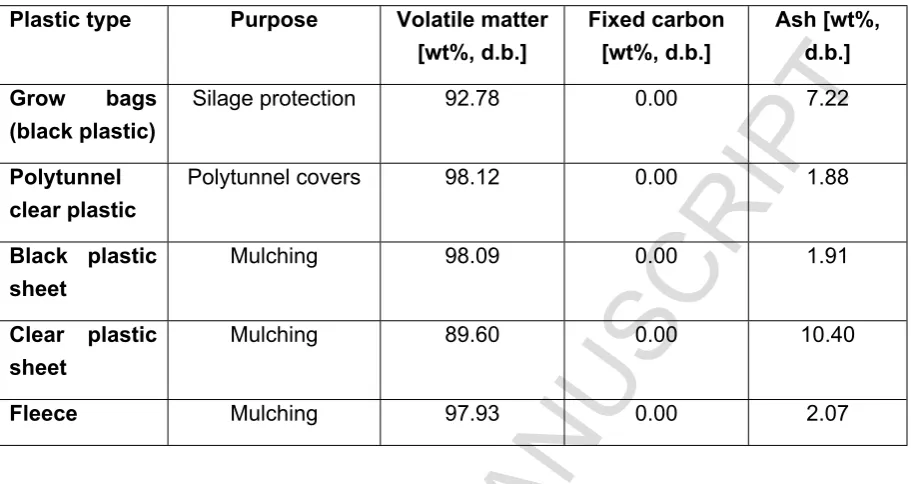
Table 1. Proximate analysis of farm plastics, showing amount of volatile matter, fixed carbon and ash on dry feedstock weight basis.
[image:10.595.73.529.141.383.2]Plastic type Purpose Volatile matter
[wt%, d.b.]
Fixed carbon [wt%, d.b.]
Ash [wt%, d.b.]
Grow bags
(black plastic)
Silage protection 92.78 0.00 7.22
Polytunnel clear plastic
Polytunnel covers 98.12 0.00 1.88
Black plastic sheet
Mulching 98.09 0.00 1.91
Clear plastic sheet
Mulching 89.60 0.00 10.40
Fleece Mulching 97.93 0.00 2.07
The thermogravimetric analysis results showed that only a small amount of solid residue remained after pyrolysis, and this consisted mainly of inorganic material (ash). The mass loss curves for all the plastic samples demonstrated similar trends with increasing pyrolysis temperature, reaching complete conversion of the plastic by the time temperature reached 500 °C. This temperature was therefore selected for further experiments in a batch laboratory pyrolysis reactor (Stage I).
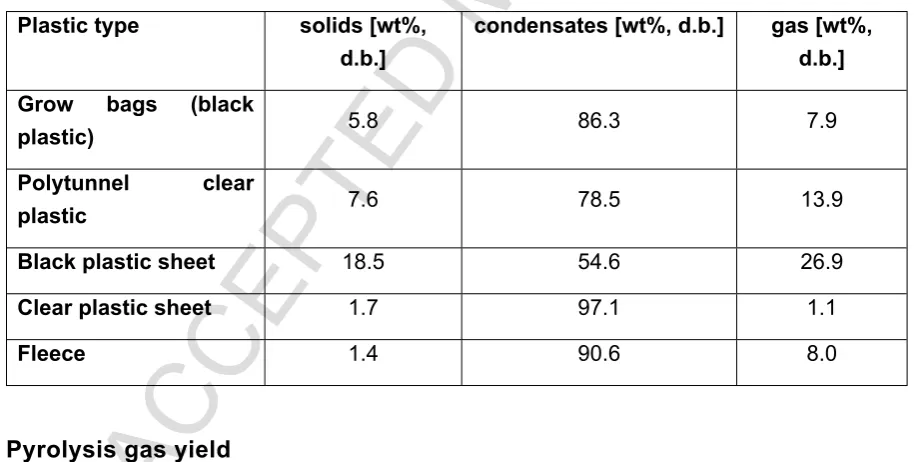
given plastic type only one major product was collected in the condensers in a form of wax deposit. Table 2 summarizes the mass balance of the pyrolysis process at these reaction conditions.
Figure 1. Lab-scale pyrolysis unit at the UK Biochar Research Centre (UKBRC), University of Edinburgh.
Table 2. Yield of product fractions collected during the pyrolysis of agricultural plastics at 500°C in batch fixed-bed reactor.
Plastic type solids [wt%,
d.b.]
condensates [wt%, d.b.] gas [wt%, d.b.]
Grow bags (black
plastic) 5.8 86.3 7.9
Polytunnel clear
plastic 7.6 78.5 13.9
Black plastic sheet 18.5 54.6 26.9
Clear plastic sheet 1.7 97.1 1.1
Fleece 1.4 90.6 8.0
Pyrolysis gas yield
Gas fraction presented only a minor fraction of the products. However, as the product consists of hydrocarbon gases, the heating value of the gas is high (comparable to natural gas), and can therefore be used for partially fulfilling the energy requirements of the process.
Pyrolysis solids yield
[image:11.595.69.527.426.657.2]This material is of very little value, as it does not resemble biochar obtained from pyrolysis of biomass, and therefore should be disposed of. However, attempts to use these solid residues as additive in the production of epoxy composite have been mentioned in the literature (Sogancioglu et al., 2017).
Condensable products yield
[image:12.595.125.285.480.677.2]Only one major product was recovered from the condensation train in form of wax, as shown in Figure 2. This material, Polyethylene Wax (PE wax) has many commercial uses including use as a raw material in candles, packaging, wood and fire logs, plastic additives & lubricants, rubber, adhesives, coatings, cosmetics and polishes. If the quality of the produced PE wax- such as penetration degree and melting point-are similar to the commercially sold products this could be a marketable product and a source of income for farmers.
4. Mathematical formulation of supply network optimisation
model
The lab experiments results formed the basis for the various supply network scenarios, as they revealed that agricultural plastics can be recycled in several different types of end products, some of which are of value to the farmers, while others can be used elsewhere. The details of different scenarios are described in the next section.
The mathematical model of the investigated SC is formulated as a MILP model with an economic objective. This method was chosen because it can identify an absolute optimal solution, and as the literature review demonstrated, this is the mostly widely used method in relevant SC optimisation models. As was mentioned in the literature review, environmental objectives were not considered in the model formulation, because any solution within the context of this study will have a positive environmental impact; as an example of circular economy perspective it is perceived to produce a better environmental outcome compared to the current practice of landfilling agricultural plastic waste. Therefore, the major objective of this model is to prove the economic viability of the proposed solution. The objective is expressed in monetary units as Net Present Value (NPV) and is optimised with the decision variables being the alternative location of the pyrolysis plant(s), the production capacity of each plant and the allocation of suppliers and customers to each plant. The system is supply driven based on the assumption that all the plastic waste generated by the farms included in the network will be recycled, and the products of pyrolysis will be consumed. However, this assumption adds a constraint to the system, since some of the potential products (e.g. heat) have to be consumed at the same location, which bounds the capacity of a potential plant to the maximum heat demand of that location and limits the number of possible plant locations to be considered. Below the elements of the model are presented.
Index sets
C
Set of all the potential customersI
Set of all farmsJ
Set of all plastic typesL
Set of potential locations for pyrolysis plantsM
Set of months in a yearP
Set of all the products of pyrolysisPl
Set of all the plant sizes availableDecision variables
Clocl,c existing link between the plant l ∈ L and the customer c ∈ C (binary)
Floci,l existing link between the farm i ∈ I and the plant l ∈ L (binary)
Locl,pl existing plant l ∈ L of the size/capacity pl ∈ Pl (binary)
Ainb inbound transportation cost (£/year) Alab labour cost (£/year)
Aop operations cost (£/year) Amain maintenance costs (£/year)
Aoutb outbound transportation cost (£/year)
Awh storage cost (£/year)
Cappl processing capacities of potential plant sizes (t/month)
Cdispj cost of disposing 1 t of plastic j ∈ J (£/t)
Convp
conversion coefficient of 1 t of plastic into product p ∈ P (unit product/t plastic)
Dc,p demand of customer c ∈ C for product p ∈ P (units/year)
Df discounting coefficient
Dinbi,l distance between a farm i ∈ I and a plant l ∈ L (km)
Doutbl,c distance between plant l ∈ L and customer c ∈ C (km) Infl inflation rate (%)
Int interest rate (%)
Invest Investments (£)
Invpl Investment costs for one plant of the capacity pl ∈ C (£)
main maintenance yearly cost as a share of investments (%)
Mpli,j mass of plastic j ∈ J generated by the farm i ∈ I a year (t/year)
Pcost operating cost per 1 t of plastic (£/t) Pmonl,m
monthly production - conversion of plastic in plant l ∈ L in month m ∈ M (t/month)
Pricep price of product p ∈ P (£/unit)
Rdisp revenues from saving on plastic disposal (£/year) Rprod revenues from products sales (£/year)
s share of investments returned as subsidies (%) Salec,p sales to customer c ∈ C of product p ∈ P (units/year)
Splj,m
share of plastic j ∈ J supplied by a farm in month m ∈ M compared to total available amount of plastic j in the farm (%)
Sub subsidies (£)
Tcost Plastics transportation cost (£/t*km)
Toutbp cost of transporting 1 unit of end product p ∈ P (£/km)
Wage yearly wage of an engineering technician (£/year) Whcost cost of storing 1 t of plastic (£/t*month)
Whstockm,l amount of plastic left in the plant l at the end of month m (t)
Y investment lifetime (year)
𝑁𝑃𝑉
=𝑀𝑎𝑥
{(𝑅𝑝𝑟𝑜𝑑+𝑅𝑑𝑖𝑠𝑝)∗ 𝐷𝑓 ‒ 𝐼𝑛𝑣𝑒𝑠𝑡+𝑆𝑢𝑏 ‒(𝐴𝑖𝑛𝑏+𝐴𝑤ℎ+𝐴𝑜𝑝+𝐴𝑚𝑎𝑖𝑛+𝐴𝑙𝑎𝑏+𝐴𝑜𝑢𝑡𝑏)∗ 𝐷𝑓} (1 )
Where:
𝐷𝑓=
1‒
(
1 +𝑖𝑛𝑡 ‒ 𝑖𝑛𝑓𝑙 1 +𝑖𝑛𝑓𝑙)
‒ 𝑌
𝑖𝑛𝑡 ‒ 𝑖𝑛𝑓𝑙
(2)
𝐼𝑛𝑣𝑒𝑠𝑡=
∑
𝑙 ∈ 𝐿, 𝑝𝑙 ∈ 𝑃𝑙
𝐼𝑛𝑣𝑝𝑙∗ 𝐿𝑜𝑐𝑙,𝑝𝑙 (3)
𝑆𝑢𝑏=𝑠 ∗ 𝐼𝑛𝑣 (4)
𝐴𝑖𝑛𝑏=𝑇𝑐𝑜𝑠𝑡 ∗
∑
𝑖 ∈ 𝐼,𝑗 ∈ 𝐽, 𝑙 ∈ 𝐿
𝐷𝑖𝑛𝑏𝑖,𝑙∗ 𝑀𝑝𝑙𝑖,𝑗∗ 𝐹𝑙𝑜𝑐𝑖,𝑙 (5)
𝐴𝑤ℎ=𝑊𝐻𝑐𝑜𝑠𝑡 ∗
∑
𝑚 ∈ 𝑀,𝑙 ∈ 𝐿
(𝑊ℎ𝑠𝑡𝑜𝑐𝑘𝑚,𝑙) (6)
𝐴𝑜𝑝=𝑃𝑐𝑜𝑠𝑡 ∗
∑
𝑚 ∈ 𝑀, 𝑙 ∈ 𝐿
𝑃𝑚𝑜𝑛𝑙,𝑚 (7)
est
𝐴𝑚𝑎𝑖𝑛=𝑚𝑎𝑖𝑛 ∗ 𝐼𝑛𝑣 (8)
𝐴𝑜𝑢𝑡𝑏=
∑
𝑐 ∈ 𝐶, p∈ 𝑃, 𝑙 ∈ 𝐿
𝑆𝑎𝑙𝑒𝑐,𝑝∗ 𝑇𝑜𝑢𝑡𝑏𝑝∗ 𝐷𝑜𝑢𝑡𝑏𝑙,𝑐 (9)
𝐴𝑙𝑎𝑏=𝑊𝑎𝑔𝑒 ∗
∑
𝑙 ∈ 𝐿,𝑝𝑙 ∈ 𝑃𝑙
𝐿𝑜𝑐𝑙,𝑝𝑙∗(0.001∗ 𝐶𝑎𝑝𝑝𝑙+ 2.4) (10)
𝑅𝑝𝑟𝑜𝑑=
∑
𝑐 ∈ 𝐶, 𝑝 ∈ 𝑃
𝑃𝑟𝑖𝑐𝑒𝑝∗ 𝑆𝑎𝑙𝑒𝑐,𝑝 (11)
𝑅𝑑𝑖𝑠𝑝=
∑
𝑖 ∈ 𝐼,𝑗 ∈ 𝐽
𝑀𝑝𝑙𝑖,𝑗∗ 𝐶𝑑𝑖𝑠𝑝𝑗 (12)
Of which
If ∑
𝑖 ∈ 𝐼,𝑗 ∈ 𝐽 𝑀𝑝𝑙𝑖,𝑗∗ 𝐹𝑙𝑜𝑐𝑖,𝑙∗ 𝑆𝑝𝑙𝑗,𝑚≥∑𝑝𝑙 ∈ 𝑃𝑙𝐶𝑎𝑝𝑙∗ 𝐿𝑜𝑐𝑙,𝑝𝑙
𝑃𝑚𝑜𝑛𝑙,𝑚=
∑
𝑝𝑙 ∈ 𝑃𝑙
𝐶𝑎𝑝𝑙∗ 𝐿𝑜𝑐𝑙,𝑝𝑙
Else 𝑃𝑚𝑜𝑛𝑙,𝑚=∑
𝑖 ∈ 𝐼,𝑗 ∈ 𝐽 𝑀𝑝𝑙𝑖,𝑗∗ 𝐹𝑙𝑜𝑐𝑖,𝑙∗ 𝑆𝑝𝑙𝑗,𝑚
𝑊ℎ𝑠𝑡𝑜𝑐𝑘𝑚,𝑙=
∑
𝑖 ∈ 𝐼,𝑗 ∈ 𝐽
𝑀𝑝𝑙𝑖,𝑗∗ 𝐹𝑙𝑜𝑐𝑖,𝑙∗ 𝑆𝑝𝑙𝑗,𝑚‒ 𝑃𝑚𝑜𝑛𝑙,𝑚
for all l ∈ L, m = {1}
(13) (14)
(15)
(16)
If 𝑊ℎ𝑠𝑡𝑜𝑐𝑘𝑚 ‒ 1,𝑙+∑
𝑖 ∈ 𝐼,𝑗 ∈ 𝐽 𝑀𝑝𝑙𝑖,𝑗∗ 𝐹𝑙𝑜𝑐𝑖,𝑙∗ 𝑆𝑝𝑙𝑗,𝑚≥∑𝑝𝑙 ∈ 𝑃𝑙𝐶𝑎𝑝𝑙∗ 𝐿𝑜𝑐𝑙,𝑝𝑙
𝑃𝑚𝑜𝑛𝑙,𝑚=∑
𝑝𝑙 ∈ 𝑃𝑙𝐶𝑎𝑝𝑙∗ 𝐿𝑜𝑐𝑙,𝑝𝑙 Else 𝑃𝑚𝑜𝑛𝑙,𝑚=𝑊ℎ𝑠𝑡𝑜𝑐𝑘𝑚 ‒ 1,𝑙+∑
𝑖 ∈ 𝐼,𝑗 ∈ 𝐽 𝑀𝑝𝑙𝑖,𝑗∗ 𝐹𝑙𝑜𝑐𝑖,𝑙∗ 𝑆𝑝𝑙𝑗,𝑚
𝑊ℎ𝑠𝑡𝑜𝑐𝑘𝑚,𝑙=𝑊ℎ𝑠𝑡𝑜𝑐𝑘𝑚 ‒ 1,𝑙+
∑
𝑖 ∈ 𝐼,𝑗 ∈ 𝐽𝑀𝑝𝑙𝑖,𝑗∗ 𝐹𝑙𝑜𝑐𝑖,𝑙∗ 𝑆𝑝𝑙𝑗,𝑚‒ 𝑃𝑚𝑜𝑛𝑙,𝑚
for all l ∈ L, m ∈ {2, 12}
(20)
If ∑
𝑚 ∈ 𝑀,𝑗 ∈ 𝐽,𝑙 ∈ 𝐿𝑃𝑚𝑜𝑛𝑙,𝑚∗ 𝐶𝑜𝑛𝑣𝑝∗ 𝐶𝑙𝑜𝑐𝑙,𝑐<𝐷𝑐,𝑝
𝑆𝑎𝑙𝑒𝑐,𝑝=
∑
𝑚 ∈ 𝑀,𝑙 ∈ 𝐿
𝑃𝑚𝑜𝑛𝑙,𝑚∗ 𝐶𝑜𝑛𝑣𝑝∗ 𝐶𝑙𝑜𝑐𝑙,𝑐
Else 𝑆𝑎𝑙𝑒𝑐,𝑝=𝐷𝑐,𝑝
for all c ∈C,p∈P
(21) (22)
(23)
Subject to
∑
𝑙 ∈ 𝐿
𝐹𝑙𝑜𝑐𝑖,𝑙= 1
for all i ∈ I
(24)
∑
𝑝𝑙 ∈ 𝑃𝑙
𝐿𝑜𝑐𝑙,𝑝𝑙= 1
for all l ∈ L
(25)
∑
𝑝𝑙 ∈ 𝑃𝑙
𝐶𝑎𝑝𝑝𝑙∗ 𝐿𝑜𝑐𝑙, 𝑝𝑙∗10≥
∑
𝑖 ∈ 𝐼, 𝑗 ∈ 𝐽
𝑀𝑝𝑙𝑖,𝑗∗ 𝐹𝑙𝑜𝑐𝑖,𝑙
for all l ∈ L
(26)
∑
𝑙 ∈ 𝐿,𝑚 ∈ 𝑀
𝑃𝑚𝑜𝑛𝑙,𝑚∗ 𝐶𝑜𝑛𝑣𝑝≥
∑
𝑐 ∈ 𝐶
𝑆𝑎𝑙𝑒𝑐,𝑝
for all p ∈ P
(27)
𝑆𝑎𝑙𝑒𝑐,𝑝≤
∑
𝑐 ∈ 𝐶,𝑙 ∈ 𝐿
𝐷𝑐,𝑝∗ 𝐶𝑙𝑜𝑐𝑙,𝑐
for all c ∈ C , p ∈ P
(28)
Locl,pl , Floci,l , Clocl,c – binary for all i ∈ I, l ∈ L, c ∈ C , pl ∈ Pl (29)
The objective function (1) corresponds to the NPV and consists of the annual costs: inbound (5) and outbound (9) transportation costs, storage costs for plastics (6), operational (7), maintenance (8) and labour costs (10), which depend on the capacity through a linearised function, investments (3), subsidies (4), annual revenues from the products produced (11), and savings from not having to dispose the waste (12), where annual costs and revenues are subject to discounting through a coefficient (2).
a customer. Apart from that agricultural plastic waste is characterised by seasonality, therefore, the plant might operate more efficiently on full capacity for several months in a year when the plastic becomes available (14), (18) or recycle the remaining material (15), (19) when the stock is not adequate to operate at full capacity, depending on the stock left at the beginning of each month (13), (17). Two months of the year are reserved for maintenance and breakdowns, which is reflected in the constraint (26). Similarly, storage costs are defined by the stock availability at the end of each month (16), (20).
Production plan requires a mass balance constraint, stating that the total amount of products sold does not exceed the amount of plastic recycled (27). Other constraints bound the number of plants linked to each farm to one (24), and sufficient number of established links between the plant(s) and the customers to sell all the products (28). Logical constraints ensure that the model choses only one capacity for each pyrolysis plant (25), and define that the decision variables, namely, the capacity and the links between farms-plants and plants-customers are binary (29).
5. Case study
The model presented has been applied to three associations of farms in Scotland. In this study five main types of agricultural plastic were analysed, and their purpose is described in Table 1. As was mentioned in the introduction, at the moment plastic waste is usually landfilled or recycled in order to be used in the production again, however the recycling process is very resource-intensive, since it requires large amounts of water to wash the plastic from soil contamination. Recycled materials are shipped abroad for further production, which depletes local economy from potential resources. Based on the results of the pyrolysis lab experiments from plastic samples, it was possible to develop three scenarios: (1) recycled plastic is sold to the industrial consumers of Polyethylene (PE) wax, (2) recycled plastic is further treated through a catalytic reaction, and the resulting liquids are sold as diesel fuel after an additional purification, (3) recycled plastic is further treated in the catalytic reaction with a high percentage of gas received, the liquids are sold as diesel fuel after an additional purification, and the remaining products are converted into heat and electricity in the CHP unit. The scenarios are presented graphically below.
Figure 3. Recycling process of Scenario 1.
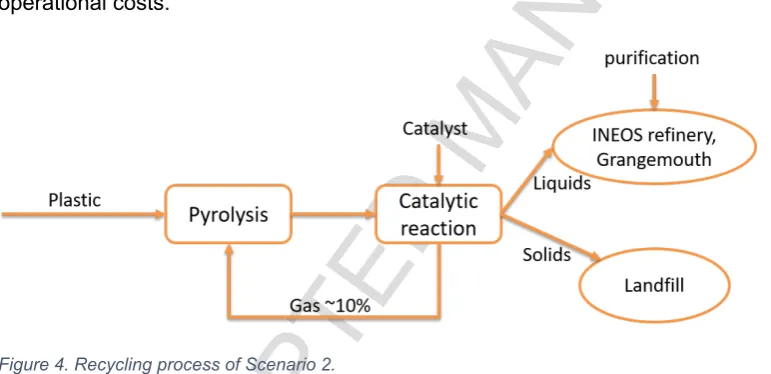
In Scenario 2 (Figure 4) in addition to pyrolysis the plastic is treated with a catalyst, which allows to change composition and quality of the output. In particular, instead of the wax it is possible to extract higher quality liquids, which are similar to diesel in their chemical properties and can be used as a diesel substitute after an additional process of purification. INEOS refinery in Grangemouth has the technical capabilities to do the purification, and the resulting diesel can be sold in the market (Haig et al., 2015). Of the other two products the output of gas is sufficient to run the pyrolysis process and the solids have to be disposed in the landfills. This scenario allows to receive a higher value product, but it also has higher investment and operational costs.
Figure 4. Recycling process of Scenario 2.
[image:18.595.73.459.357.544.2]Figure 5. Recycling process of Scenario 3.
The model was applied for 37 farms in Scotland. The values that were used to run the model were obtained from the lab experiments, aggregated from the interviews with farmers, or adapted from the literature. Each scenario required different assumptions, and differences in parameters’ values for the scenarios are discussed below.
5.1 Input parameters
The model was tested for the period of 20 years, which is estimated to be an average lifetime of the pyrolysis plant (Shackley et al., 2011). Given this period, it is assumed that the investments occur in year 0 and the revenues are received starting from year 1. The discounting coefficient for calculating NPV was based on the inflation rate of 0.7% (an average of the year 2016 in the UK) and the interest rate of 8% (Shackley et al., 2011; Walther et al., 2012).
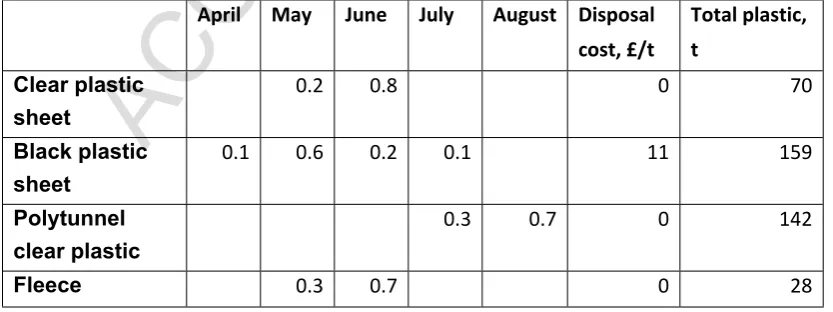
The distances between the farms and potential plant locations, and the plant locations and potential customers were extracted using a GIS system. The amounts of plastic waste per farm and the demand for final products were provided by the farmers’ associations. The seasonality of plastic availability and the costs of transporting and disposing plastic were identified during the interviews with farmers (Table 3).
Table 3. Plastic related parameters: seasonality, current cost of disposing plastic.
April May June July August Disposal cost, £/t
Total plastic, t
Clear plastic sheet
0.2 0.8 0 70
Black plastic sheet
0.1 0.6 0.2 0.1 11 159
Polytunnel clear plastic
0.3 0.7 0 142
[image:19.595.71.488.602.758.2]Grow Bags (Black Plastic)
1 0 134
[image:20.595.73.487.71.106.2]With regards to the final product, plastic is recycled into solids (char), syngas and condensates (wax), which was explained in the previous section. For scenarios 2 and 3 the production process requires a catalyst. Two possible outcomes of the catalytic reaction are presented in Table 7, where catalyst ZSM-5 is used as a reference. However, further experiments would be required to confirm the ratio of outputs with the agricultural plastics.
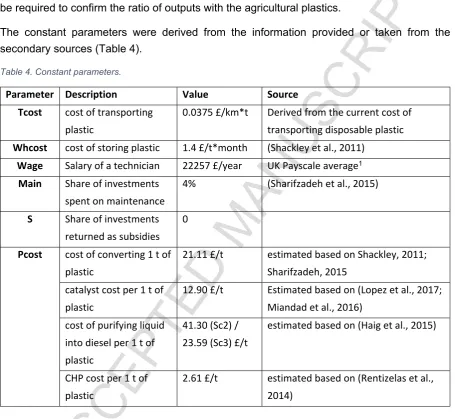
The constant parameters were derived from the information provided or taken from the secondary sources (Table 4).
Table 4. Constant parameters.
Parameter Description Value Source
Tcost cost of transporting plastic
0.0375 £/km*t Derived from the current cost of
transporting disposable plastic
Whcost cost of storing plastic 1.4 £/t*month (Shackley et al., 2011)
Wage Salary of a technician 22257 £/year UK Payscale average1
Main Share of investments
spent on maintenance
4% (Sharifzadeh et al., 2015)
S Share of investments
returned as subsidies 0
cost of converting 1 t of plastic
21.11 £/t estimated based on Shackley, 2011;
Sharifzadeh, 2015 catalyst cost per 1 t of
plastic
12.90 £/t Estimated based on (Lopez et al., 2017;
Miandad et al., 2016) cost of purifying liquid
into diesel per 1 t of plastic
41.30 (Sc2) / 23.59 (Sc3) £/t
estimated based on (Haig et al., 2015)
Pcost
CHP cost per 1 t of plastic
2.61 £/t estimated based on (Rentizelas et al.,
2014)
[image:20.595.72.528.195.614.2]the total annual operating costs of the given plant size and dividing it by the capacity of other plant sizes. However bigger plants will have higher maintenance and labour costs, and although the cost per tonne is likely to be smaller for them due to economies of scale, the total annual costs will certainly be higher than that of the 16 000 t plant; therefore, this approach cannot be used in this study. The value of 40 £/t can be used as a starting point in calculating operating cost which can then be broken down in different components and adjusted in accordance with the capacity. For the given capacity of 16 000 t operating costs amount to 12% of the capital investments (16000t*40£/t/£5.33M), of which 4% account for the maintenance costs (Table 4). If we take the remaining annual costs of 8% and subtract annual labour costs (22257£/person*4persons), the remaining part of operating costs per tonne results in 21.1 £/t. This value is then used as variable costs for a plant of any capacity. The other two parts of the operating costs are calculated as a percentage of the capital costs for maintenance, or as the salary of a required number of technicians for labour costs. This approach seems the most accurate as it considers economy of scale in maintenance and labour costs.
Catalyst costs were based on theZSM-5 catalyst, which can be used for polyethylene plastic. The amount of catalyst required is 8% of the mass of plastic, and can be re-used 6 times (Lopez et al., 2017), therefore, the equivalent amount used equals 1.33% of the mass of plastic. The wholesale prices for this catalyst start from 1500 $/t, which, when recalculated per tonne of plastic amounts to 12.90 £/t of plastic. This part of the operating costs is included in scenarios 2 and 3. Apart from that these scenarios also include the cost of purifying the liquids into diesel of 50 £/t of diesel. This process results in 10% loss in volume (Haig et al., 2015), which is reflected in the conversion coefficients (Table 6). In the two scenarios the amount of output liquids is different, which explains the difference in the operating costs, when the price for purifying the liquids in recalculated into the cost per tonne of plastic.
Finally, CHP operating costs occur only in the scenario 3. The recommended value of operating and maintenance costs is 5.5% of the investment costs (Rentizelas et al., 2014). Since the maintenance costs are calculated separately at the level of 4% for the total investment, the remaining 1.5% specifically for the CHP are recalculated additionally in the model as a percentage of investment costs of a CHP unit per tonne of plastic (Table 4). Investment costs have been referred to in the calculations of the operating costs several times, and the level of investment varies depending on the scenario as well, as is shown below.
The scale factor derived from the two chosen plants equals 0.7, which allowed to identify the provisional investment costs for five chosen capacities (Table 5). The step for chosen sizes is smaller for smaller capacity sizes, because current volumes of plastic are relatively low, and therefore the expected plant size is likely to be small as well. For the minimum capacity the smallest pyrolysis unit available on the market was used – Pyrex 500 with the capacity of 1 000 t per year and the total capital costs of € 508 000.
[image:22.595.85.420.354.482.2]In addition, the investment costs were complemented with the catalyst unit, which allowed to convert the products of pyrolysis into a higher value liquid which could be further purified into diesel, and CHP unit that allows to convert the intermediary products (solids and syngas) into the final products: heat and electricity. In this case, the cost of the catalyst unit was 50% of the pyrolysis unit based on the prior experience of the laboratory. The baseline CHP facility was one of 2000 kWhel output with a cost of £3.4M, and a scale factor of 0.7 was used to approximate the cost for different sizes. As pyrolysis unit consumes part of gas to sustain the process, the final yield is reduced to 51% gas and 1.8% solids. These products are then fed into the CHP unit that is assumed to have a typical 30% electrical and 50% thermal efficiency. Table 5. Investment parameters.
Capacity size, t/year Pyrolysis, k£ CHP unit, k£ Catalyst unit, k£
1000 423 977 211
4000 2022 2580 1011
16000 5330 6809 2665
76000 15841 20266 7920
255500 36976 47355 18488
Table 6 includes final product related parameters: prices, transportation costs and conversion rates. The prices for electricity, heat, diesel and wax were based on the market research. The price for solids is negative and equates the cost of disposing plastic. Electricity and heat do not have transportation costs as they are consumed on the spot, and for the other products the price was calculated based on the transportation costs of plastic (Table 4). With regards to diesel, since it is the unrefined liquid that is transported and the amount of diesel is reduced by 10% after the refining process, transportation costs are considered accordingly. The conversion rates of pyrolysis were presented in the previous part of the report and are used for wax and solids in the scenario 1. The conversion rates for catalyst reaction were taken from the study of Miandad et al. (2016) presented in Table 7, and are used to calculate the amount of diesel in scenarios 2 and 3 (reduced by 10%), solid waste in scenario 2 and CHP output in scenario 3.
fed into the CHP unit. Considering a typical CHP efficiency of 30% electrical and 50% thermal, this leads to output of 1628 kWh electricity and 2713 kWh thermal per tonne of plastic input.
Table 6. Product related parameters: prices, cost of transportation, conversion rates.
Unit Price, £/unit Transport outbound, £/unit*km
Conversion, unit/plastic t
Electricity Kwh 0.15 0 1627.962
Heat Kwh 0.04 0 2713.27
Diesel t 564 0.35 0.74 (Sc2) / 0.42 (Sc3)
Wax t 500 0.31 0.83
[image:23.595.72.498.128.413.2]Solid t -11 0.31 0.0668 (S1) / 0.023 (S2)
Table 7. Results of catalytic reaction. Source: (Miandad et al., 2016).
Catalyst ZSM-5 high in liquid high in gas
Liquid 83% 47.18%
Gas 15% 51.04%
Solid 2.30% 1.78%
The number of staff required was linearised from two sources of real personnel demand: 4 persons for a small capacity of 16 000 t (Shackley et al., 2011) and 18 persons for a large capacity plant of 160 000 t (Svanberg et al., 2013) resulting in the equation (10).
5.2 Results
[image:23.595.72.530.645.754.2]The model was programmed in GAMS optimisation software and run for each scenario. Table 8 presents the results for each scenario, and from the key financial parameters we can see that scenario 1 seems to be the most financially viable with the given demand and volumes of plastic. In Table 8, the Internal Rate of Return (IRR) and Payback Period (PB) were calculated additionally to the NPV. The rest of this section discusses the results of applying the optimisation model in each scenario in more detail.
Table 8. Key economic performance of each scenario.
Annual disposing savings, k£
Annual revenues from sales, k£
Investment, k£
Annual operations costs, k£
NPV, k£ IRR PB
Scenario 1 1.749 220.556 423.333 138.019 505.506 19% 5.02
-Scenario 3 1.749 321.687 1 285.653 194.686 133.190 8% 9.99
Table 9. Amount of plastic recycled per month in t.
Month May June July August September October
Production 100 100 100 100 100 32.972
5.2.1 Scenario 1: Wax as an output
The results of the optimisation model suggest that only one plant of the lowest capacity size (1000 t/year) is built in location 1 of the seven potential locations. The proposed solution can result in a positive investment yield, with NPV equal to £ 505 506 over the course of 20 years, with IRR of 19% and payback period of 5 years. These results prove that the existing technological solution can potentially provide an economically viable system of plastic recycling with the volumes of plastic available. The proposed solution generates annually 442 t of wax, which are suggested to be sold to one customer. 36.6 t of solids need to be disposed in the landfills.
This scenario has relatively low variable costs, of which the highest proportion is allocated to the labour costs and the second highest to the product (outbound) transportation costs (Figure 6).
6% 1%
8%
12%
41%
32% Ainbound
[image:24.595.70.469.352.640.2]Awarehousing Aoperations Amaintenance Alabour Aoutbound
Figure 6. Distribution of annual costs for scenario 1.
The amount of plastic that is generated by 37 farms essentially utilises only half of the pyrolysis plant capacity (Table 9) as the plant operates for less than 6 months per year; therefore, the suggested solution can potentially increase profitability of the system if more farms join this network to spread the capital costs of the pyrolysis on a longer operational time window.
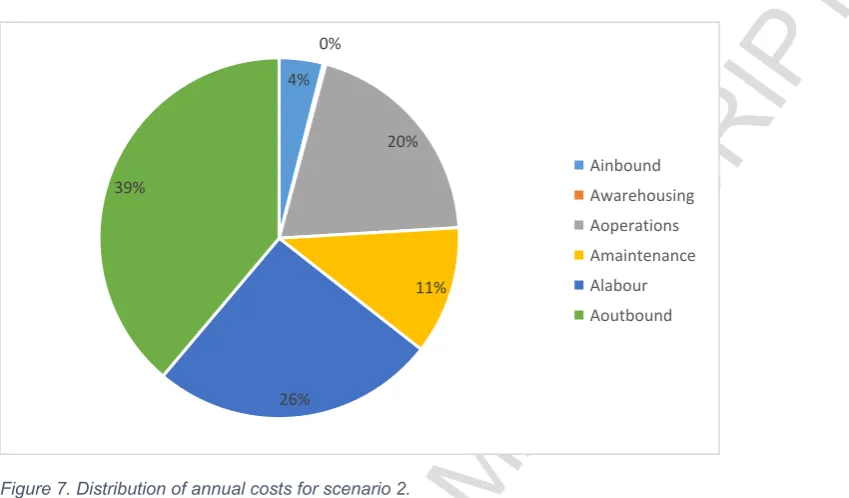
The results of the optimisation model suggest that only one plant of the lowest capacity size (1000 t/year) should be built in location 7 (different from scenario 1). The proposed solution results in a negative investment yield, with an NPV equal to £ -589 174 over the course of 20 years. The suggested plant can produce annually 396 t of diesel, however, the investment costs are too high, and the operation costs are almost equal to the revenues. In this scenario the outbound transportation costs constitute the largest proportion of the variable costs (Figure 7) due to the refinery being located relatively far from any of the potential plants.
4% 0%
20%
11%
26% 39%
[image:25.595.72.497.184.433.2]Ainbound Awarehousing Aoperations Amaintenance Alabour Aoutbound
Figure 7. Distribution of annual costs for scenario 2.
This is the least profitable of the three scenarios and with the given volumes of plastic the only parameter that can lead to this scenario having positive NPV and a reasonable payback period is the increase in diesel price, which is shown in the sensitivity analysis.
5.2.3 Scenario 3: Diesel and CHP as an output
The results of the optimisation model suggest that only one plant of the lowest capacity size (1000 t/year) should be built in location 1 (the same as scenario 1). The proposed solution can result in a positive investment yield, with NPV equal to £ 133 190 over the course of 20 years, IRR of 8% and payback period of 10 years. These results prove that the existing technological solution can potentially provide an economically viable system of plastic recycling with the volumes of plastic available. The proposed solution generates annually 226.3 t of diesel, 867.6 ΜWh of electricity and 1446 MWh of heat. This scenario requires high investment costs, but the value of the end product is high enough to compensate for the initial investment.
4% 0%
15%
26%
29% 26%
[image:26.595.73.498.69.314.2]Ainbound Awarehousing Aoperations Amaintenance Alabour Aoutbound
Figure 8. Distribution of annual costs for scenario 3.
Similar to scenario 1, this scenario has potential for higher profitability if the plant operates in full capacity, with the payback period reduced by almost half, as is shown in the next section.
5.3 Sensitivity analysis
The sensitivity analysis was performed for the parameters that were considered volatile or were based on assumptions. The volatile parameters include the amount of plastic supplied by farms, price of products, interest rates, transportation costs, cost of disposing plastic and salary levels. The parameters based on assumptions include investment, maintenance, operations and transportation costs. Their values vary in the literature, and therefore they need to be included in the sensitivity analysis as well. The value of each of the parameters was changed from -40% to +40% for each of the scenarios, and the impact of each parameters on NPV and Payback period was calculated. Due to space limitations, only the NPV-related results are graphically presented.
The results showed that all three scenarios were most sensitive to the product price, amount of plastic and investment cost, which was an expected outcome, since the price directly affects the revenues, the amount of plastic allows to increase the use of redundant capacity, and investment is heavily influencing costs.
5.3.1 Scenario 1
-40% -30% -20% -10% 0% 10% 20% 30% 40%
-... -... -... 200 ... 400
... 600
... 800
... 1... 1... 1... 1...
[image:27.595.72.518.69.392.2]Plastic mass Investment Price Interest rate Maintenance Production cost Transportation cost Disposable cost Wage
Figure 9. Change in NPV from the volatility of parameters in Scenario 1.
5.3.2 Scenario 2
As was mentioned before, this scenario can potentially become profitable, only if the diesel price increases by more than 24%. If it increases by 40% NPV can reach £ 398 101. As is shown in Figure 10, the variation in any other parameter does not lead to positive results.
-40% -30% -20% -10% 0% 10% 20% 30% 40%
-1... -1... -1... -1... -1... -... -... -... -... 200 ... 400
... 600
...
Plastic mass Investment Price Interest rate Maintenance Production cost Transportation cost Disposable cost Wage
[image:27.595.71.517.452.709.2]5.3.3 Scenario 3
Scenario 3 demonstrates moderate result, but the sensitivity analysis showed that this scenario could have high potential if the amount of plastic or product price were increased, or investment costs could be reduced. For instance, with the amount of plastic increased by 40% NPV results in £1 164 391 (Figure 11). Therefore it could be the second best scenario to consider. However, the baseline option of this scenario is only marginally profitable, and a slight change in price, amount of plastic or investments (by less than 10%) leads to a negative outcome. A more significant increase in wages or maintenance costs can also lead to negative NPV and unreasonable payback period.
-40% -30% -20% -10% 0% 10% 20% 30% 40%
-1 500 000
-1 000 000
- 500 000
500 000
1 000 000
1 500 000
2 000 000
[image:28.595.70.517.218.485.2]Plastic mass Investment Price Interest rate Maintenance Production cost Transportation cost Disposable cost Wage
Figure 11. Change in NPV from the volatility of parameters in Scenario 3.
6. Discussion
The results of lab experiments and supply network modelling have demonstrated that pyrolysis technology can be used for the recycling of agricultural plastics into a high value product, which can be ‘circled’ back to the production, and this solution is economically viable even with small amounts of plastic available. Depending on the pyrolysis-based technological system configuration the economic feasibility can differ significantly, as a result of differences in the composition and quality of co-products. The experimental results showed that PE-wax can be obtained with good yield, and could easily be separated from the gaseous and other liquid co-products. However, in a commercial application, purity of such material and consistency of its properties would be a critical element requiring attention. Appropriate setting of processing conditions would allow for optimisation of yield distribution of co-products, balancing between energy and materials recovery.
industrial PE wax consumers. This scenario is the least technologically complex as it needs only a pyrolysis unit, requires the least investment and has the shortest payback period and the highest IRR. Following the output of the model, it is recommended to build a plant of the smallest capacity available in the market (1000 t/year). With the provided amount of plastic only half of this capacity is used, therefore leaving an opportunity to increase the profitability of this scenario, if the supply of plastic was increased. The second profitable option is scenario 3, in which the output of pyrolysis and catalytic reaction is partially sold for further purification into diesel and partially converted into heat and electricity in a CHP unit. This option has lower IRR and higher payback period due to significantly higher investment costs, but is still attractive, if the amount of plastic collected is increased substantially.
Ultimately the findings of this study suggest that farmers should change the way they operate and consider the used agricultural plastics as a valuable resource and potential source of income rather than as a nuisance and a waste to dispose of. The European Strategy for Plastics in a Circular Economy (European Commision, 2018) emphasises the need for more circular approaches in the plastics lifecycle, in order to not only capture the economic benefits but also to reduce environmental impacts, caused by the current linear take-make-dispose value chain. These impacts include plastic leakage to the sea and land, depletion of the limited fossil feedstocks, CO2 emissions from plastics production and incineration, and microplastics entering the food chain. Therefore, adoption of circular economy principles in managing end-of-life plastics through valorisation solutions has clear sustainability benefits primarily from an environmental but also economic perspective. The review has shown that the literature tends to focus on the environment dimension of sustainability; however, the circular economy approaches can also impact the social dimension of sustainability, for example, through increase in local employment.
This study is aligned with the above principles of circular economy and contributes to the development of sustainable agricultural practices, in that it aims to develop sustainable value chains for end-of-life agricultural plastics by identifying the highest possible valorisation application for a second life, and ‘circling’ the products back in the production stage, while maximising the potential for economic viability of such value chains. The latter is critical since improving the economics of plastics recycling and reuse has been identified as the main barrier and ambition for the ‘New Plastics Economy’ vision (Ellen MacArthur Foundation, 2017) and the European Strategy for Plastics in a Circular Economy (European Commision, 2018). It can thus be concluded that, although this work and the model presented do not explicitly model the impact on the environmental and social dimensions of sustainability, they contribute to sustainable SC design by proposing new SCs that model the adoption of circular economy principles for the agricultural plastic waste, to improve sustainability of the agricultural sector as a system.
6.1 Academic contribution
consisting of facility location and suppliers and customers allocation problem. The issue of upgrading plastic waste to higher-value products in the agricultural sector has not been studied in terms of supply network optimisation up to now, and therefore this study provides academics with new insights into the application of supply network optimisation methods in waste management in the agricultural sector and its specificities. Application of the model entails the development of customised constraints and objectives for the particular context and can be adapted for other cases of reverse SC, such as waste collection and processing, recycling, biomaterials, biofuels etc. As the developed model is scalable, it can potentially be used on a country level. It can also consider the use of different technologies other than pyrolysis, or a different input product mix and conversion factors, but this might require to conduct lab experiments in order to analyse the composition and properties of the output products.
Similarly, the laboratory experiments in this study apply the existing recycling technology in a new context. Testing the pyrolysis of soil-contaminated plastics proved that the mineral matter introduced in the soil fraction was retained in the solid residue after pyrolysis, forming a small amount of high-ash solid. Therefore, it opens up new opportunities for plastic processing technology adoption in academic studies in similar cases of contaminated plastics.
6.2 Contribution to practice
The work provides an example of a win-win situation where the objectives of providing additional income for farmers can be combined with the environmental benefit of diverting a stream of waste from landfilling. It therefore contributes to increasing the value captured by local economies while also adopting circular economy principles in the agricultural sector, leading to more sustainable agricultural operations. SC on re-manufacturing, recycling and waste processing can benefit from the application of the proposed model for decision support in locating a new processing facility and allocating a large number of distributed suppliers and potential customers. The proposed model provides decision making support both at the strategic level (facility location) and the tactical level (allocation of material suppliers and of customers and markets to supply). In addition, the experimental work shows that agricultural plastic residues can be processed without the need for cleaning (removal of soil residues), which is a water intensive process and can be an issue in areas where water is a scarce resource. Thus it has important implications for practical operation of a pyrolysis facility utilising such materials and can become an example of sustainable agriculture practices.
7. Conclusions
positive impact on the environment that stretches beyond the obvious economic benefits. Within this frame, this study aimed at developing a robust method for designing an optimal supply network for processing agricultural plastic waste into commercial products, considering both the upstream plastic waste and the downstream product supply chain, within a circular economy approach. The aim was achieved by developing a bespoke supply network optimisation model that was applied for a specific case study in Scotland, while also providing experimental proof of the potential outputs of pyrolysis technology for agricultural plastic recycling.
This work has demonstrated that more sustainable agricultural operations can lead to a win-win situation by increasing farmers’ income while also diverting a current waste stream from landfilling and using it to create higher value added products as an example of circular economy. The options of using agricultural waste plastics to convert into PE wax or generate heat and electricity for agricultural processing facilities are financially viable, even though the pyrolysis plant is not used in full capacity for the amounts of plastic in the case study. It is therefore apparent that economies of scale will be prominent when involving more farms or sources of similar plastic waste in such a project. But for the scale examined in the case study, conversion of plastics to diesel does not seem to be a viable solution.
Unlike the model, generalisability of the case study results is limited by the context and specific parameters of the Scottish farmers. Therefore, it is important to acknowledge that applying the same model in a different country or for different farm locations could show that other scenarios are more profitable, since the parameters such as transportation costs, distances and the amount of plastics available will differ. However, the model itself is generic and can be used to assess similar problems in various geographical contexts with limited need for adaptation.
Acknowledgements
This research has been performed within the frame of the project ’Recovering value from waste agricultural plastics from the Scottish vegetable and soft fruit industry’, funded by Interface Food & Drink, and led by Angus Growers and Edinburgh Napier University (ENU) in a partnership with Strathclyde University, the University of Edinburgh, Kettle Produce and East of Scotland Growers. The aim of the project is to benefit soft fruit and vegetable industry stakeholders by identifying an alternative disposal route for the waste agricultural plastics providing a potential source for revenue generation and energy cost reduction through the transformation of the waste plastics to value-added products.
References
Akgul, O., Shah, N., Papageorgiou, L.G., 2012. An optimisation framework for a hybrid first/second
generation bioethanol supply chain. Comput. Chem. Eng. 42, 101–114.
doi:10.1016/j.compchemeng.2012.01.012
Aksoy, B., Cullinan, H., Webster, D., Gue, K., Sukumaran, S., Eden, M., Jr, N.S., 2011. Woody Biomass and Mill Waste Utilization Opportunities in Alabama: Transportation Cost Minimization, Optimum Facility Location, Economic Feasibility, and Impact. Environ. Prog. Sustain. Energy 30, 720–733. doi:10.1002/ep
Al-Salem, S.M., 2009a. Establishing an integrated databank for plastic manufacturers and converters in Kuwait. Waste Manag. 29, 479–484.
Al-Salem, S.M., 2009b. Influence of natural and accelerated weathering on various formulations of linear low density polyethylene (LLDPE) films. Mater. Des. 30, 1729–1736.
Al-Salem, S.M., Antelava, A., Constantinou, A., Manos, G., Dutta, A., 2017. A review on thermal and catalytic pyrolysis of plastic solid waste (PSW). J. Environ. Manage. 197, 177–198. doi:10.1016/J.JENVMAN.2017.03.084
Al-Salem, S.M., Lettieri, P., Baeyens, J., 2010. The valorization of plastic solid waste (PSW) by primary to quaternary routes: from re-use to energy and chemicals. Prog. Energy Combust. Sci. 36, 103– 129.
Altieri, M.A., 2018. Agroecology: the science of sustainable agriculture. CRC Press, Boca Raton, Fla.
An, H., Wilhelm, W.E., Searcy, S.W., 2011. Biofuel and petroleum-based fuel supply chain research: A literature review. Biomass and Bioenergy 35, 3763–3774. doi:10.1016/j.biombioe.2011.06.021
Awudu, I., Zhang, J., 2012. Uncertainties and sustainability concepts in biofuel supply chain
management: A review. Renew. Sustain. Energy Rev. 16, 1359–1368.
doi:10.1016/j.rser.2011.10.016
Banasik, A., Kanellopoulos, A., Claassen, G.D.H., Bloemhof-Ruwaard, J.M., van der Vorst, J.G.A.J., 2017. Closing loops in agricultural supply chains using multi-objective optimization: A case study of an industrial mushroom supply chain. Int. J. Prod. Econ. 183, 409–420. doi:10.1016/j.ijpe.2016.08.012
Basfar, A.A., Ali, K.M.I., 2006. Natural weathering test for films of various formulations of low density polyethylene (LDPE) and linear low density polyethylene (LLDPE). Polym. Degrad. Stab. 91, 437– 443.
Bekkering, J., Broekhuis, A.A., van Gemert, W.J.T., 2010. Optimisation of a green gas supply chain - A review. Bioresour. Technol. 101, 450–456. doi:10.1016/j.biortech.2009.08.106
Bing, X., Bloemhof-Ruwaard, J., Chaabane, A., Van Der Vorst, J., 2015. Global reverse supply chain redesign for household plastic waste under the emission trading scheme. J. Clean. Prod. 103, 28– 39. doi:10.1016/j.jclepro.2015.02.019
Bowling, I.M., Ponce-Ortega, J.M., El-Halwagi, M.M., 2011. Facility Location and Supply Chain Optimization for a Biorefinery. Ind. Eng. Chem. Res. 50, 6276–6286. doi:10.1021/ie101921y
Bravo, M.D.L., Naim, M.M., Potter, A., 2012. Key issues of the upstream segment of biofuels supply chain: A qualitative analysis. Logist. Res. 5, 21–31. doi:10.1007/s12159-012-0077-x
Bridgwater, A. V, 2009. Life cycle and techno-economic assessment of the northeast biomass to liquids project.
Cambero, C., Sowlati, T., 2014. Assessment and optimization of forest biomass supply chains from economic, social and environmental perspectives - A review of literature. Renew. Sustain. Energy Rev. 36, 62–73. doi:10.1016/j.rser.2014.04.041