1 2 3 4 5 6 7 8 9 10 11 12 13 14 15 16 17 18 19 20 21 22 23 24 25 26 27 28 29 30 31 32 33 34 35 36 37 38 39 40 41 42 43 44 45 46 47 48 49 50 51 52 53 54 55 56 57 58 59
Advances in 3D imaging and volumetric reconstruction of fluid and melt inclusions by
high resolution X-ray computed tomography
Antonin Richard1,*, Christophe Morlot1, Laura Créon2,3 Nicolas Beaudoin4,5,6, Vladimir S. Balistky7, Svetlana Pentelei1, Vanessa Dyja-Person1, Gaston Giuliani8,9, Isabella Pignatelli1, Hélène Legros1, Jérôme Sterpenich1, Jacques Pironon1
1
Université de Lorraine, CNRS, GeoRessources lab., Boulevard des Aiguillettes B.P. 70239,
F-54506, Vandoeuvre-lès-Nancy, France
2
Centro de Geociencias, Universidad Nacional Autónoma de México, Blvd. Juriquilla No.
3001. Querétaro, 76230, México
3
Géosciences Le Mans, Le Mans Université, UFR Sciences et techniques, avenue Olivier
Messiaen, 72085 Le Mans Cedex 9, France
4
School of Geographical and Earth Sciences, University of Glasgow, Gregory Building,
Lillybank Gardens, G12 8QQ Glasgow, UK
5
Civil & Environmental Engineering, University of Strathclyde, G1 1XJ, Glasgow, UK
6
Laboratoire des Fluides Complexes et leurs Réservoirs-IPRA, E2S-UPPA, Total, CNRS,
Université de Pau et des Pays de l'Adour, UMR5150, Pau, France
7
Institute of Experimental Mineralogy, Russian Academy of Sciences, Chernogolovka,
Moscow oblast, Russia
8
Université Paul Sabatier, GET/IRD, UMR CNRS-IRD-CNES 5563, 14 avenue Edouard
Belin, F-31400 Toulouse, France
9
Université de Lorraine, CRPG UMR 7358 CNRS-UL, BP 20, 54501 Vandoeuvre-lès-Nancy,
France
* Corresponding author email: [email protected] *Revised manuscript with no changes marked
1 2 3 4 5 6 7 8 9 10 11 12 13 14 15 16 17 18 19 20 21 22 23 24 25 26 27 28 29 30 31 32 33 34 35 36 37 38 39 40 41 42 43 44 45 46 47 48 49 50 51 52 53 54 55 56 57 58 59
Abstract
Fluid and melt inclusions are tiny pockets of fluid and melt trapped in natural and
synthetic minerals. Characterizing the 3D distribution of fluid and melt inclusions within
minerals, their shape and the volume fraction of their different phases is crucial for
determining the conditions for crystal growth and paleostress analysis. However, their
relatively small size (typically 5 to 100 μm), complex shape, heterogeneous content, the
opaque nature of some host minerals and projection bias frequently hamper accurate imaging and volumetric reconstruction using conventional microscopic techniques. High resolution ray computed tomography (HRXCT) is a non-destructive method which uses contrasts of
X-ray attenuation in a series of contiguous radiographs with different view angles to reconstruct
the 3D distribution of areas of different densities within a large variety of materials. In this
work, we show the capabilities HRXCT for: (i) imaging the 3D distribution of aqueous and
hydrocarbon-bearing fluid inclusions and silicate melt inclusions in a crystal; (ii)
characterizing the shape of fluid and melt inclusions and (iii) reconstructing the total volume
and the volume of the different phases (liquid, glass, crystal, vapor) of fluid inclusions and
melt inclusions. We have used a variety of hand specimens and chips of transparent and
opaque minerals (olivine, quartz, feldspar, garnet, emerald, wolframite), that we analyzed
using three different HRXCT setups. When a resolution of ~ 1 µm3/voxel is achieved, HRXCT allows identifying > 5 µm fluid inclusions, and the identification and volumetric
reconstruction of the different phases can be carried out with reasonable confidence for
relatively large (> 25 µm) inclusions. Density contrasts are high enough to properly identify:
(i) a silicate melt inclusion, and its different phases (glass, vapor and crystals such as
clinopyroxene and spinel) in an olivine crystal; (ii) aqueous monophase (liquid) and
1 2 3 4 5 6 7 8 9 10 11 12 13 14 15 16 17 18 19 20 21 22 23 24 25 26 27 28 29 30 31 32 33 34 35 36 37 38 39 40 41 42 43 44 45 46 47 48 49 50 51 52 53 54 55 56 57 58 59
emerald, wolframite). In the case of hydrocarbon-bearing fluid inclusions containing two
liquid phases (oil and aqueous solution) and a vapor phase, the two liquid phases could not be
distinguished from each other. Volumetric reconstruction of liquid and vapor phases of
aqueous and hydrocarbon-bearing fluid inclusions show compatible results with independent
calculations using known pressure, temperature, molar volume and composition (P-T-V-x) conditions of trapping or imaging using confocal laser scanning microscopy respectively.
Collectively, our results show that HRXCT is a promising tool for non-destructive
characterization of fluid and melt inclusions.
Keywords
Fluid inclusions; melt inclusions; high resolution X-ray computed tomography; volume;
1 2 3 4 5 6 7 8 9 10 11 12 13 14 15 16 17 18 19 20 21 22 23 24 25 26 27 28 29 30 31 32 33 34 35 36 37 38 39 40 41 42 43 44 45 46 47 48 49 50 51 52 53 54 55 56 57 58 59
1. Introduction
Tiny droplets of fluid and melt are trapped within natural and synthetic minerals as
fluid and melt inclusions which represent invaluable tools to understand crystal growth and
mass transfer in the Earth’s mantle and crust. The 3D distribution of fluid and melt inclusions
within crystals, their shape and the volumetric proportions of their different phases are key
information for the determination of the relationship between crystal growth, deformation and
the nature of the fluids and melts involved (e.g. Roedder, 1984; Frezzotti, 2001; Bodnar and
Student, 2006; Kesler et al., 2013). However, such data are difficult to acquire with good
confidence because optical observation is frequently hampered by perspective and projection
issues. For instance, the estimation of the volumetric fraction of the vapor phase to the entire
inclusion at room temperature (φvap) may be incorrect when deduced from area fractions (Bakker and Diamond, 2006). This led to the development of a series of tools and methods
allowing significant improvement in textural, microstructural, morphological and volumetric
reconstruction of fluid and melt inclusions like for instance the four-axis universal stage
(Tuttle, 1949); relationships between vapor phase diameter, the temperatures of freezing and
liquid-vapor homogenization and the volumetric properties of the fluids in the H2O-NaCl system (Bodnar, 1983), the spindle stage (Anderson and Bodnar, 1993), confocal scanning
laser microscopy (Petford et al., 1995), transmission electron microscopy (Viti and Frezzotti,
2001); AnIma (Lespinasse et al., 2005); second harmonic generation microscopy (Stoller et
al., 2007) and synchrotron-based X-ray fluorescence computed tomography (Cauzid et al.,
2007) and nano X-ray tomography (Yao et al., 2015).
High resolution X-ray computed tomography (HRXCT) is a non-destructive method
which uses contrasts of X-ray attenuation in a series of contiguous radiographs with different
1 2 3 4 5 6 7 8 9 10 11 12 13 14 15 16 17 18 19 20 21 22 23 24 25 26 27 28 29 30 31 32 33 34 35 36 37 38 39 40 41 42 43 44 45 46 47 48 49 50 51 52 53 54 55 56 57 58 59
variety of materials. HRXCT has been increasingly used for characterizing Earth materials
over the past two decades (Ketcham and Carlson, 2001; Cnuddle and Boone, 2013). Among
various examples, HRXCT has been successfully applied to unravel the shape, orientation and
3D distribution of minerals, porosity and cracks in various rocks showing complex textures
like sedimentary rocks (Noiriel, 2015), metamorphic rocks (Sayab et al., 2015), magmatic
rocks (Baker et al., 2012), mantle rocks (Créon et al., 2017), ores (Kyle and Ketcham, 2015)
and extraterrestrial materials (Hanna and Ketcham, 2017).
Since the pioneering study of Nakashima et al. (1997), fluid and melt inclusions have
been the subject of only a few studies by HRXCT even with more recent and powerful
equipment (Kyle et al., 2004; Kyle and Ketcham, 2007a, b, 2008, 2015; Nowecki, 2014;
Pamukcu et al., 2013, 2015; Gaetani et al., 2015; Farley and Horton, 2017). These studies
have shown that HRXCT allows imaging isolated fluid and melt inclusions, fluid inclusion
clusters and trails, as well as discriminating and quantifying different phases within fluid
inclusions and silicate melt inclusions in transparent (e.g. quartz, olivine) and opaque (e.g.
pyrite, pyrrhotite, sphalerite) minerals. Here, in an attempt to provide an overview of the
current capabilities and future perspectives of HRXCT for the study of fluid and melt
inclusions, we show the results of a series of experiments using three HRXCT setups at
Université de Lorraine (France), University of Strathclyde (UK) and Universidad Nacional
Autónoma de México (Mexico). Nine samples containing either aqueous fluid inclusions,
hydrocarbon-bearing fluid inclusions or silicate melt inclusions in transparent (natural and
synthetic quartz, “trapiche” emerald, gem “demantoid” garnet, olivine) and opaque
(wolframite) minerals were analyzed. Both 3D imaging of fluid inclusions distribution within
single crystals and quantitative volumetric reconstruction of the different phases within single
1 2 3 4 5 6 7 8 9 10 11 12 13 14 15 16 17 18 19 20 21 22 23 24 25 26 27 28 29 30 31 32 33 34 35 36 37 38 39 40 41 42 43 44 45 46 47 48 49 50 51 52 53 54 55 56 57 58 59
2. Sample description
The samples were selected to cover some common types of fluid and melt inclusion
compositions found in nature or used as synthetic inclusions, as well as various transparent
and opaque host minerals. The targeted inclusions have all in common to be relatively large
(>25 µm) to event “giant” (~ 5 mm), and display variable shape and infilling. Their
characteristics are provided below and in Table 1.
2.1. Silicate melt inclusions (Sample A)
The volcanic material (Sample A) was collected at Los Humeros volcanic complex
located in the eastern part of the Trans-Mexican Volcanic Belt in Mexico (Table 1). Both the
Trans-Mexican Volcanic Belt and Los Humeros volcanic complex exhibit a large diversity of
alkaline to calk-alkaline volcanism (Gómez-Tuena et al., 2016; Créon et al., 2018). Sample A
was collected in porphyritic lavas from the 8.91 ka post-caldera event (Carrasco-Nuñez et al.,
2018; Dávila-Harris and Carrasco-Núñez, 2014). Sample A contains plagioclase, olivine,
orthopyroxene and clinopyroxene phenocrysts together with large vesicles and a glass matrix.
Olivine phenocrysts are 0.5-2.0 mm large and contain isolated, round silicate melt inclusions
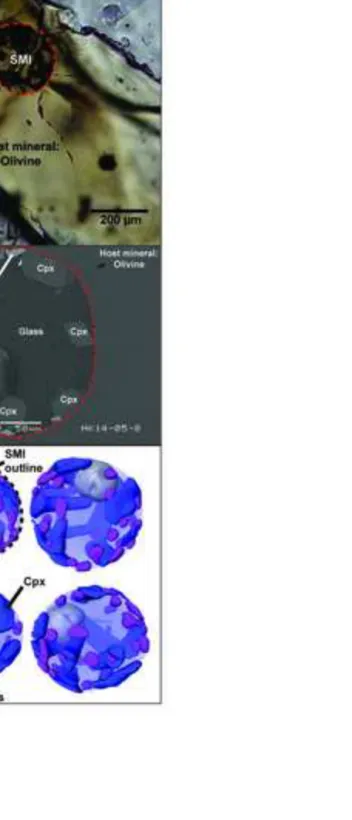
up to 230 µm in diameter, with a vapor bubble (Fig. 1). Euhedral crystals of spinel and
clinoyroxene (as identified by secondary electron microscopy) are observed inside the silicate
melt inclusion (Fig. 1). These crystals nucleated after the trapping of the silicate melt
inclusion. The analyzed material consists of a single olivine phenocryst (1.0 mm large)
1 2 3 4 5 6 7 8 9 10 11 12 13 14 15 16 17 18 19 20 21 22 23 24 25 26 27 28 29 30 31 32 33 34 35 36 37 38 39 40 41 42 43 44 45 46 47 48 49 50 51 52 53 54 55 56 57 58 59
2.2. Aqueous fluid inclusions (Samples B, C, D, E, F)
Sample B consists of water + H2 fluid inclusions trapped in synthetic quartz grown by the hydrothermal temperature gradient method using refractory autoclaves, produced at the
Institute of Experimental Mineralogy, Russian Academy of Sciences (Chernogolovka,
Moscow oblast, Russia) (Table 1). The full experimental procedures for quartz and fluid
inclusion synthesis and characterization are described in Balitsky et al. (2011, 2014, 2015).
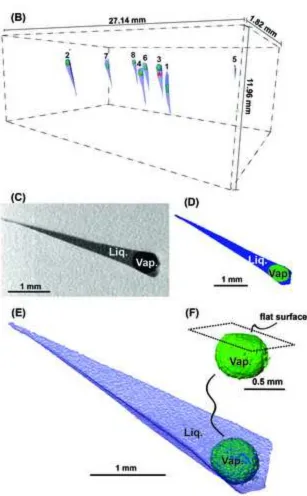
Sample B is a 3×5×2 cm monocrystal showing arrays of elongated and oriented two-phase
(liquid + vapor) aqueous fluid inclusions (Fig. 2). No sectioning was carried out prior to
HRXCT scanning and Sample B was scanned both entirely and on a 1.4×1.4×1.4 mm region
of interest.
Sample C consists of synthetic two-phase liquid + vapor aqueous fluid inclusions
trapped in a natural quartz, produced at the GeoRessources laboratory, Université de Lorraine
(Vandoeuvre-lès-Nancy, France) (Table 1). Fluid inclusion synthesis was conducted
following the procedure exposed in Jacquemet et al. (2014), inspired from the one of Sterner
and Bodnar (1984). A pre-fractured quartz lamella (5×5×1 mm) was used to trap the fluid
inclusions at 600°C-2.0 kbars. The experimental H2O-NaCl solution had a salinity of 7.7 wt. % NaCl. Considering these pressure, temperature, molar volume and composition (P-T-V-x)
conditions for trapping, the expected φvap value was 42 % (Bakker, 2003). After fluid inclusion synthesis, the quartz lamella was doubly polished to reach a 0.4 mm thickness for
optical microscopy and HRXCT analyses. Examination under optical microscope showed the
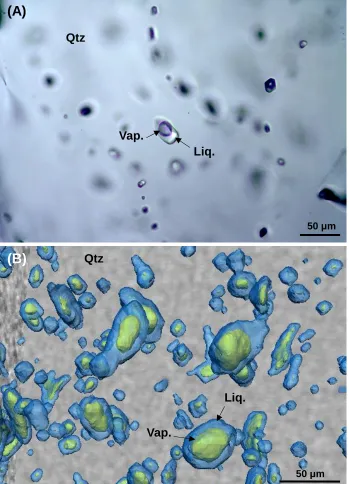
presence of numerous two-phase (liquid + vapor) fluid inclusions (1-100 μm) with apparent
φvap value compatible with the theoretical value of 42 % (Fig. 3).
Sample D was collected from the Antetezambato gem-quality “demantoid” garnet
1 2 3 4 5 6 7 8 9 10 11 12 13 14 15 16 17 18 19 20 21 22 23 24 25 26 27 28 29 30 31 32 33 34 35 36 37 38 39 40 41 42 43 44 45 46 47 48 49 50 51 52 53 54 55 56 57 58 59
deposit is classified as a skarn-type deposit related to Upper Mesozoic to Cenozoic
magmatism affecting the limestones of the Mesozoic Isalo Group (Giuliani et al., 2015 and
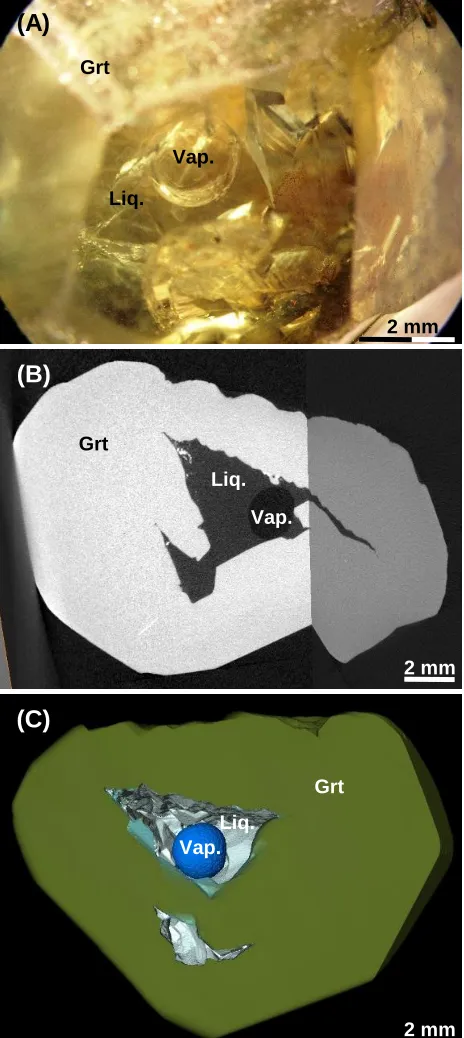
references therein). The greenish gem-quality “demantoid” andradite crystal measures 1.5×0.6
cm and hosts a giant two-phase (liquid + vapor) aqueous fluid inclusion visible to the naked
eye (Fig. 4; Giuliani et al., 2015; Morlot et al., 2016). No sectioning was carried out prior to
HRXCT scanning and Sample D was scanned entirely.
Sample E was collected from the Muzo deposit on the western side of the Eastern
Cordillera Basin, Colombia (sample T12 in Pignatelli et al., 2015) (Table 1). The emerald
deposits are hosted by Lower Cretaceous sedimentary rocks forming two mineralized zones
located on the eastern and western border of the basin, respectively. The emeralds are formed
by interaction between hydrothermal H2O-NaCl-CO2 fluids and black shales. Trapiche emeralds are very rare and are only found in a few deposits from the western emerald zone.
Their occurrence is related to a complex context of fluid pressure variations along faults and
thrusts, affecting the growth of the emerald. On a section perpendicular to the c-axis of the
emerald, the trapiche texture is typified by a central core, six arms, which are
crystallographically equivalent growth sectors, and dendritesbetween the arms and around the
core (Fig. 5). The trapiche emeralds host primary multi-phase (liquid + vapor + halite +
carbonates ± sylvite) aqueous fluid inclusions and large secondary monophase (liquid)
aqueous fluid inclusions studied here, developed parallel to the dislocations in the arms (Fig.
5; Pignatelli et al., 2015). No sectioning was carried out prior to HRXCT scanning and
Sample E was scanned entirely.
Sample F was collected from the Piaotang W-Sn deposit located in the southern
Jiangxi province (SE China) (Table 1). At Piaotang, a buried Jurassic granite shows alteration
by hydrothermal fluids in its upper part. The W-Sn minerals are located within vertical
1 2 3 4 5 6 7 8 9 10 11 12 13 14 15 16 17 18 19 20 21 22 23 24 25 26 27 28 29 30 31 32 33 34 35 36 37 38 39 40 41 42 43 44 45 46 47 48 49 50 51 52 53 54 55 56 57 58 59
metasedimentary country rocks (Legros et al., 2018). Sample F is a three centimeter-long
opaque wolframite crystal with an average formula of Fe0.5Mn0.5WO4. The wolframite hosts primary (5-40 µm) two-phase liquid + vapor aqueous fluid inclusions either isolated or
aligned and elongated along the c-axis as well as secondary inclusions with similar infilling to
primary inclusions (Legros et al., submitted, this volume; Fig. 6). Sulfide veinlets cut the
wolframite crystal parallel and perpendicular to the c-axis. The analyzed material is a chip
(3×4×0.2 mm) of a doubly polished thick section prepared from Sample F.
2.3. Hydrocarbon-bearing fluid inclusions (Samples G, H, I)
Samples G and H consist of hydrocarbon-bearing fluid inclusions trapped in synthetic
quartz, produced at theInstitute of Experimental Mineralogy, Russian Academy of Sciences
(Chernogolovka, Moscow oblast, Russia) (Table 1). Quartz crystals with fluid inclusions were
grown by the hydrothermal temperature gradient method using refractory autoclaves. The full
experimental procedures for quartz and fluid inclusion synthesis and characterization were
described in Balitsky et al. (2011, 2014, 2015). Sample G was synthetized using 7.5 wt. %
Na2CO3 aqueous solution and oil. Sample H was synthetized using 7.0 wt. % Na2CO3 aqueous solution and boghead. Temperature gradients between the top and bottom of the
autoclave were 290/300 °C and 291/347 °C respectively. Sample G shows an elongated (200
μm) fluid inclusion containing a vapor phase, an aqueous solution and oil as seen under
optical microscope using ultraviolet (UV) illumination (Fig. 7). Sample H shows an elongated
(500 μm) fluid inclusion containing a vapor phase, an aqueous solution, oil and solid bitumen
as observed under optical microscope using visible light and UV illumination (Fig. 8). The
analyzed materials were chips (5×5×0.5 mm) of doubly polished thick sections prepared from
1 2 3 4 5 6 7 8 9 10 11 12 13 14 15 16 17 18 19 20 21 22 23 24 25 26 27 28 29 30 31 32 33 34 35 36 37 38 39 40 41 42 43 44 45 46 47 48 49 50 51 52 53 54 55 56 57 58 59
Sample I was collected from a petroleum field whose location and geological settings
are kept confidential (Table 1). Sample I displays authigenic feldspar cements in which an
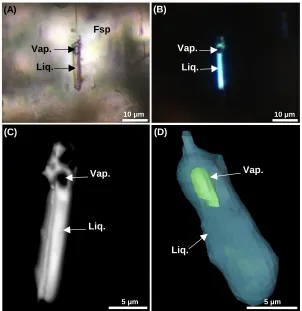
elongated, 25 µm oil-bearing primary fluid inclusion was found (Fig. 9). The inclusion was
analyzed by optical microscope using UV illumination showing that the liquid phase contains
fluorescent oil. Then the inclusion was analyzed by confocal laser scanning microscopy
(Pironon et al., 1998) which allows 3D reconstruction of the inclusion and visualization of the
vapor and liquid oil phases through ImageJ 3D Viewer (Fig. 9), with a spatial resolution lower
than 0.5 µm. By using this method, the calculated φvap value of the fluid inclusion is 10 ± 2 %. The analyzed material was a chip (3×4×0.15 mm) of a doubly polished thick section prepared
from Sample I.
3. Analytical methods
The principles of the method as well as analytical conditions of the three setups used
are described below as well as in Table 1.
3.1. Principles of HRXCT analysis and data processing
HRXCT is a non-destructive and non-invasive method which uses contrasts of X-ray
attenuation (a function of density and atomic number) to reconstruct the 3D distribution of
areas of different densities within a large variety of materials with a resolution down to ~ 1
μm/pixel (px) or 1 μm3
/voxel (vx) (see Ketcham and Carlson, 2001; Cnuddle and Boone,
2013 for more details about the HRXCT data acquisition and processing and application to
Earth materials). The 3D reconstruction is based on a series of contiguous 2D radiographs
1 2 3 4 5 6 7 8 9 10 11 12 13 14 15 16 17 18 19 20 21 22 23 24 25 26 27 28 29 30 31 32 33 34 35 36 37 38 39 40 41 42 43 44 45 46 47 48 49 50 51 52 53 54 55 56 57 58 59
the following experiments, a correction of the ring artifact was done during analysis using
specific filters and beam hardening corrections were carried out with the softwares mentioned
below. Each phase (mineral, glass, liquid, vapor) was separated manually using simple
greyscale threshold tool, by segmentation of the volumes corresponding to the relative density
range of each individual phase. Separation is considered as optimal when the selected range of
gray values selects all the voxels belonging to a phase while it does not select voxels that
belong to a different phase. Such optimal separation is achieved thanks to a strong contrast
between phases (as visible on 2D slices in Fig. 2,4,7,8) and a reduced noise. Then, the volume
of the different phases were calculated by the count of voxels in the different voxel clusters.
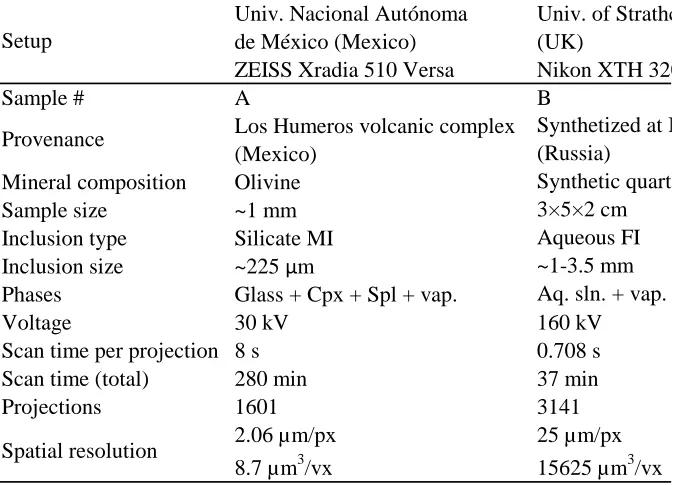
3.2. HRXCT at Universidad Nacional Autónoma de México (Sample A)
Sample A was analyzed through X-ray micro-tomography at the Laboratorio
Universitario de Microtomografía de Rayos X (Centro de Geociencias, Universidad Nacional
Autónoma de México, Querétaro, Mexico) on the ZEISS Xradia 510 Versa instrument (Table
1). The detector was a CCD ANDOR camera, with 1080×1080 px and 32 bits resolution.
Polychromatic tomography with 30 kV radiation was performed on Sample A. The
sample-detector source-sample distances were optimized for a spatial resolution of 2.06 µm/px (8.7
µm3/vx) with magnifications of 4.0×. The 3D images obtained were composed of
885×885×999 vx (elementary image volume) with 32-bit grey-scale resolution. Acquisition
time was 280 min for 1601 projections (8 s per projection) together with around 200 reference
images (blanks). Tomographic volume reconstructions were performed using the ZEISS XRM
1 2 3 4 5 6 7 8 9 10 11 12 13 14 15 16 17 18 19 20 21 22 23 24 25 26 27 28 29 30 31 32 33 34 35 36 37 38 39 40 41 42 43 44 45 46 47 48 49 50 51 52 53 54 55 56 57 58 59
3.3. HRXCT at University of Strathclyde (Sample B)
The HRXCT scans on Sample B were performed at the University of Strathclyde,
Glasgow (UK) using an industrial Nikon XTH 320/225 system, equipped with a 225 kV
X-ray tube, a microfocus multimetal target, and a 2000×2000 px flat panel photodetector (cell
size 0.2×0.2 mm), leading to volumes of 2000×2000×2000 vx (Table 1). Two different scan
conditions were tested on Sample B. One scan of the complete sample (Fig. 2) was performed
using a silver target under an accelerating voltage of 160 kV, 71 µA current corresponding to
a power of 11.4 W, for a spatial resolution of 25 µm/px (15625 µm3/vx). The exposure time for each of the 3141 projections was 0.708 s, leading to a scan time of 37 min (1 frame per
projection). The second scan focusing on a 1.4×1.4×1.4 mm region of interest of the sample
was performed using a silver target under an accelerating voltage of 160 kV, 46 µA current,
corresponding to a power of 7.4 W, for a spatial resolution of 7.7 µm/px (456 µm3/vx). The exposure time for each of the 3141 projections was 1.415 s, leading to a scan time of 75 min
(1 frame per projection). X-ray tube conditions would not saturate photodetector,
consequently no metallic filter was required during the scans. Volume reconstructions were
carried out with CT Pro 3D software. Both 3D dataset were treated using Avizo® 9.2.0, noise
was corrected by using a median filter that uses morphological operators to set the voxels
value to the median for the defined neighborhood (3 px 2D square). After separation of
phases, the remaining selected voxels smaller than 100 connected voxels in 3D were removed
1 2 3 4 5 6 7 8 9 10 11 12 13 14 15 16 17 18 19 20 21 22 23 24 25 26 27 28 29 30 31 32 33 34 35 36 37 38 39 40 41 42 43 44 45 46 47 48 49 50 51 52 53 54 55 56 57 58 59
3.4. HRXCT at Université de Lorraine (Samples C-I)
HRXCT scans of Samples C to I were acquired at the Université de Lorraine,
Vandoeuvre-lès-Nancy (France) with a Phoenix Nanotom S scanner (Table 1). Data
processing was carried out using Avizo® 9.2.0. The detector used was a CCD Hamamatsu,
with 2300×2300 px. For Samples C, D, E, F, G, H and I, the source-sample distance was 12.5,
55, 28, 6, 6, 10 and 10 mm respectively. The accelerating voltage was 100, 115, 100, 90, 90,
110 and 110 kV respectively. The current was 100, 100, 65, 100, 115, 115 and 115 µA
respectively. The following number of projections were carried out: 1500 (as averages of 4
projections of 1000 ms each), 2000 (as averages of 3 projections of 1000 ms each), 2000 (as
averages of 5 projections of 750 ms each), 2000 (as averages of 3 projections of 1250 ms
each), 1500 (as averages of 6 projections of 750 ms each), 1200 (as averages of 6 projections
of 750 ms each) and 1200 (as averages of 6 projections of 750 ms each) respectively. This led
to a scan time of 100, 100, 125, 125, 125, 105 and 105 min. respectively. The spatial
resolution was 1.25 µm/px (1.95 µm3/vx), 1.96 µm/px (7.5 µm3/vx), 3.5 µm/px (42 µm3/vx), 0.77 µm/px (0.45 µm3/vx), 0.77 µm/px (0.45 µm3/vx), 1 µm/px (1 µm3/vx) and 1 µm/px (1 µm3/vx) respectively.
4. Results and discussion
4.1. Identification and 3D distribution of fluid and melt inclusions
For Sample A, the density of the various solid components of the silicate melt
1 2 3 4 5 6 7 8 9 10 11 12 13 14 15 16 17 18 19 20 21 22 23 24 25 26 27 28 29 30 31 32 33 34 35 36 37 38 39 40 41 42 43 44 45 46 47 48 49 50 51 52 53 54 55 56 57 58 59
whole silicate melt inclusion (Fig. 1). Similarly, for Samples B to I, density differences
between the liquid phase of aqueous and/or hydrocarbon-bearing fluid inclusions (d ≈ 1 g.cm -3
and 0.7-1 g.cm-3 respectively), and their host minerals (quartz: d = 2.6 g.cm-3; garnet: d = 3.5-4.3 g.cm-3; emerald: d = 2.7-2.9 g.cm-3; wolframite: d = 7.1-7.5 g.cm-3 and feldspar = 2.6 g.cm-3) are high enough to induce detectable contrasts of X-ray attenuation, as visible on 2D slices (Fig. 2-9). HRXCT 3D reconstructions allow to identify isolated inclusions (Fig.
1,4,5,7-9, Samples A,D,E,G-I) and 2D and 3D fluid inclusion clusters (Fig. 2,3,6, Samples
B,C,F). Based on the analysis of relatively small fluid inclusions and when a resolution of ~ 1
µm3/vx is achieved (Fig. 3,6, Samples C,F) the minimum size of the fluid inclusions that can be clearly identified using HRXCT is about 5 µm in diameter (assuming spherical shape). In
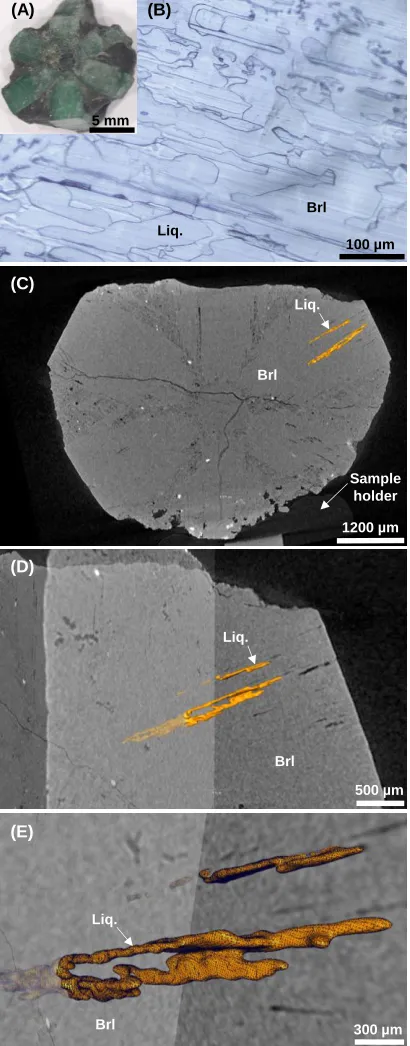
Sample E, HRXCT 3D reconstruction shows that monophase liquid aqueous fluid inclusions
are developed parallel to the dislocations in one of the arms of the trapiche emerald (Fig. 5).
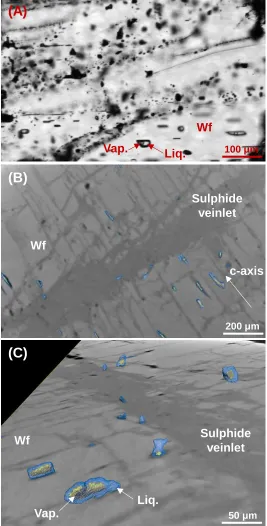
In Sample F, HRXCT 2D and 3D reconstructions show that most fluid inclusions are
elongated perpendicular to the main sulfide veinlet and parallel to the c-axis.
Here, fluid inclusions and silicate melt inclusions were successfully imaged by
HRXCT in both transparent (olivine, natural and synthetic quartz, demantoid garnet,
“trapiche” emerald, feldspar) and opaque (wolframite) minerals. The present results
complement previous studies in which fluid and melt inclusions were imaged by HRXCT in
quartz, olivine, sphalerite, pyrite and pyrrhotite (Nakashima et al., 1997; Kyle et al., 2004;
Kyle and Ketcham, 2007a, b, 2008, 2015; Nowecki, 2014; Pamukcu et al., 2013, 2015;
Gaetani et al., 2015; Farley and Horton, 2017). Common geologic fluids differ in linear X-ray
attenuation coefficient from common minerals by several orders of magnitudes, indicating
that HRXCT is theoretically suitable for identification of fluid inclusions in most natural and
synthetic crystals (Kyle and Ketcham, 2015). HRXCT is therefore a powerful technique for
1 2 3 4 5 6 7 8 9 10 11 12 13 14 15 16 17 18 19 20 21 22 23 24 25 26 27 28 29 30 31 32 33 34 35 36 37 38 39 40 41 42 43 44 45 46 47 48 49 50 51 52 53 54 55 56 57 58 59
minerals, including: (i) opaque minerals for which observation of inclusions needs access to
an infrared camera and sometimes are not even for suited for infrared cameras (Lüders, 2017);
(ii) fragile minerals (e.g. carbonate, gypsum) subjected to fluid inclusion stretching during
sample preparation (Bourdet and Pironon, 2008) and (iii) gemstones for which the presence of
fluid inclusions impacts their commercial value (Giuliani et al., 2014). HRXCT reconstruction
could be a prerequisite before any sectioning of the sample or destructive analysis, for
example before laser ablation - inductively coupled plasma - mass spectrometry analysis (to
locate fluid inclusions to be ablated in opaque minerals; Kouzmanov and Pettke, 2010; Colin
et al., 2013), or crushing (to evaluate the volume of fluid that can be extracted for further
elemental of isotopic analysis; Nowecki, 2014). HRXCT reconstruction could help defining
the relationships between the inclusions and their host crystals and their primary or secondary
origin if the orientation of the crystal is known (Roedder, 1984). Finally, 3D mapping of fluid
inclusion planes by HRXCT could be of great help for microtectonic characterization and
paleostress analysis (Nakashima et al., 1997; Lespinasse et al., 2005).
4.2. Identification of the different phases within fluid and melt inclusions
For Sample A, the respective densities of the different phases within the silicate melt
inclusion (vapor bubble, glass, clinopyroxene and spinel) are sufficiently contrasted to allow
proper thresholding and labelling, and to reconstruct the complex distribution of the vapor
bubble and the solids within the glass matrix (Fig. 1). The multiple clinopyroxene and spinel
crystals are mostly located close to the walls of the inclusion or close to the vapor bubble, as
also seen by secondary electron microscopy. Mineral crystallization at the vapor bubble rim
implies a fluid saturation event and discards, by the same, a possible free volume vapor
1 2 3 4 5 6 7 8 9 10 11 12 13 14 15 16 17 18 19 20 21 22 23 24 25 26 27 28 29 30 31 32 33 34 35 36 37 38 39 40 41 42 43 44 45 46 47 48 49 50 51 52 53 54 55 56 57 58 59
hydrocarbon-bearing fluid inclusions, the density contrast between the vapor phase (d ≈ 10-2 -10-1 g.cm-3) and the liquid phase(s) (d ≈ 1 g.cm-3) is high enough to allow their proper identification and reconstruction (Fig. 2-4,6-9, Samples B-D,F-I). For Samples G and H, the
two liquid phases (oil and aqueous solution) and the solid bitumen are indistinguishable,
probably due to their similar density (Fig. 7-8). For Samples C and F, no vapor phase could be
identified in relatively small inclusions (<10 µm in diameter assuming spherical shape, Fig.
3,6). The minimum diameter of the vapor phase allowing to firmly discriminate the liquid
phase from the vapor phase is about 2 μm.
Here, multiphase silicate melt inclusions and one phase (liquid) and two-phase (liquid
+ vapor) aqueous and hydrocarbon-bearing fluid inclusions were successfully imaged.
Therefore 3D HRXCT imaging can not only identify the presence and location of fluid and
melt inclusions but also can provide information about the number, the composition, the shape
and the spatial distribution of their different phases. This has direct implications for the nature
of the parental melt and trapping conditions of crystallized silicate melt inclusions (e.g.,
homogeneous or heterogeneous) and on the origin of the vapor bubble (free-volume or fluid
saturation) as well as for the trapping conditions and the nature of the fluids trapped in fluid
inclusions. As a complement to previous studies (Nakashima et al., 1997; Kyle et al., 2004;
Kyle and Ketcham, 2007a, b, 2008, 2015; Nowecki, 2014; Pamukcu et al., 2013, 2015;
Gaetani et al., 2015; Farley and Horton, 2017), this is the first time that liquid hydrocarbon is
identified in fluid inclusions and that different solids are characterized within a melt inclusion
by HRXCT. Further investigation could include the identification of daughter minerals within
aqueous fluid inclusions and the characterization of gas-bearing inclusions like monophase
1 2 3 4 5 6 7 8 9 10 11 12 13 14 15 16 17 18 19 20 21 22 23 24 25 26 27 28 29 30 31 32 33 34 35 36 37 38 39 40 41 42 43 44 45 46 47 48 49 50 51 52 53 54 55 56 57 58 59
could include more systematic use of propagation phase-contrast tomography (Pamukcu et al.,
2013; Sayab et al., 2016).
4.3. Shape and volumetric reconstruction of fluid and melt inclusions
HRXCT reconstruction of the analyzed inclusions reveals a broad range in shape
(nearly spherical, elongated, tubular or complex; Fig. 1-9, Samples A-I). For Sample D, the
morphology of the fluid inclusion cavity is sufficiently well reconstructed that it is possible to
identify a negative crystal shape, with polygonal surfaces parallel to the host crystal faces
(Fig. 4). Besides polygonal faces, the wall of the fluid inclusion shows a rough surface. In
some cases, the vapor phase of both aqueous and hydrocarbon-bearing fluid inclusions
(Samples B,D,G,I, Fig. 2,4,7,9) and the vapor bubble of the silicate melt inclusion (Sample A,
Fig. 1) are located in such places that they are slightly flattened at the contact of the inclusion
wall. This configuration usually hampers accurate optical estimation of the volume of the
vapor phase. As for secondary electron microscopy imaging, HRXCT 3D reconstruction of
the silicate melt inclusion shows that the multiple clinopyroxene and spinel crystals are
euhedral (Fig. 1, Sample A).
The 3D reconstruction also allows the calculation of the relative volume of the
different phases. For Sample A (Fig. 1) the calculations return the following volume
percentages for the different phases within the silicate melt inclusion: glass (67.5 vol. %),
clinopyroxene (20.4 vol. %, as the sum of all clinopyroxene crystals), vapor bubble (7.2 vol.
%), spinel (4.9 vol. %, as the sum of all spinel crystals). For Sample D (Fig. 4), the demantoid
1 2 3 4 5 6 7 8 9 10 11 12 13 14 15 16 17 18 19 20 21 22 23 24 25 26 27 28 29 30 31 32 33 34 35 36 37 38 39 40 41 42 43 44 45 46 47 48 49 50 51 52 53 54 55 56 57 58 59
%. For Sample G (Fig. 7), the calculated φvap value is 9.2 %. For Sample B (Fig. 2)
preliminary tests of the sensitivity of the calculated phase volume to threshold values and to
scanning resolution were carried out (Table 2). The volumetric calculations using a scanning
resolution of 25 µm/px (15625 µm3/vx) and optimal threshold values return a φvap value ranging between 13 % and 24 % (average 20.1 %) for the population of imaged inclusions
(Table 2). When scanned with a resolution of 7.7 µm/px (456 µm3/vx) and using optimal threshold values the calculated φvap value is of 24 % for fluid inclusion #3 while the 25 µm/px (15625 µm3/vx) resolution scan returns a φvap value of 22.5 %. At a resolution of 7.7 µm/px (456 µm3/vx), when the threshold value is changed by 5 %, the calculations return a φvap value of 76.2 % (Table 2). Therefore, it appears that the volumetric reconstruction is sensitive to the
scanning resolution (the higher the better) and most importantly to the choice of the threshold
values during the post-processing stage. For Sample C, the calculated φvap value of relatively large inclusions (>25 µm in diameter assuming spherical shape) is between 40 and 45 %,
which is compatible with the expected value of 42 % (considering known P-T-V-x conditions
of trapping). For Sample I, 3D reconstruction of the hydrocarbon-bearing fluid inclusion
using confocal laser scanning microscopy and visualization through ImageJ 3D Viewer
returns a φvap value of 10 ± 2 %, while HRXCT 3D reconstruction of the same inclusion returns a compatible φvap value of 9.8 %. For samples B, C, F, H and I, the reconstructed surfaces of vapor phases are slightly more complex than spherical or flattened shapes
observed under optical microscope (Fig. 2,3,6,8,9). Those differences arise from the
thresholding and segmentation procedures and would induce more discrepancies between
actual and reconstructed shapes and volumes when the resolution and density contrasts are the
lowest. However, based on independent analysis of Samples C and I, this does not seem to
1 2 3 4 5 6 7 8 9 10 11 12 13 14 15 16 17 18 19 20 21 22 23 24 25 26 27 28 29 30 31 32 33 34 35 36 37 38 39 40 41 42 43 44 45 46 47 48 49 50 51 52 53 54 55 56 57 58 59
The present results show that HRXCT reconstruction allows 3D visualization of the
fluid and melt inclusions shape which may help correcting for projection bias under the
optical microscope (Bakker and Diamond, 2006) and better identify post-trapping
deformation (i.e. stretching, necking down). 3D reconstruction may also overcome the
frequent limitation in estimation of vapor phase volume when the vapor bubble is flattened or
when the shape of the inclusion is complex. Finally, 3D volumetric reconstruction of melt
inclusions by HRXCT could be used as a promising alternative approach to post-entrapment
modification correction and calculation of the parental melt composition without inducing
leakage of volatiles by heating and related diffusion (Créon et al., 2018). Further
improvement would consist of more in-depth sensitivity tests on various parameters and
quantifying the uncertainties in volume calculation (Lin et al. 2015). Also, one could test the
volume changes in the fluid inclusion cavities induced by freezing of the liquid phase in the
case of inclusions hosted in fragile minerals like carbonates. This tests would require
adaptation of a microthermometric stage in the HRXCT setup. It could be also interesting to
test if sample heating due to X-ray absorption could induce measurable change in the volume
of the vapor phase. Here, the present observations show no visible variation of the vapor
phase diameter between radiographs taken before and during the experiments. Similarly, the
vapor phase has to remain immobile during the experiments. Consequently and considering
that the vapor phase tends to move in the liquid phase in many types of fluid inclusions, the
applicability of the HRXCT is inherently limited to fluid inclusions with relatively large vapor
1 2 3 4 5 6 7 8 9 10 11 12 13 14 15 16 17 18 19 20 21 22 23 24 25 26 27 28 29 30 31 32 33 34 35 36 37 38 39 40 41 42 43 44 45 46 47 48 49 50 51 52 53 54 55 56 57 58 59
5. Conclusions
Collectively, the present results complement significantly the sparse previous studies
of HRXCT characterization of fluid and melt inclusions. HRXCT can definitely be a useful
and versatile tool for non-destructive characterization of the 3D distribution of fluid and melt
inclusions, their shape and the volume fractions of their different phases, within both
transparent and opaque minerals. Among other applications, HRXCT is a promising powerful
method for fluid and melt inclusion petrography, paleostress analysis and P-T-V-x
reconstruction. Future developments should focus on: (i) achieving higher spatial resolution
and more efficient phase discrimination with more sophisticated data processing and
experimental setups and (ii) more quantitative approaches to fluid and melt inclusion
distribution and volumetric reconstruction including better estimation of accuracy and
precision of the calculated volumes.
Acknowledgments
This work was supported by the French National Research Agency through the
national program “Investissements d’avenir” with the reference ANR-10-LABX-21-01 /
LABEX RESSOURCES21 and by a CNRS-INSU-CESSUR grant. N. Jacquemet
(independent researcher in geochemistry and mass transport; nicolas-jacquemet.com)
produced and provided Sample C. K. Kouzmanov (Université de Genève) provided access to
infrared camera for observation of Sample F. L. Créon thanks the project PO-5 “Innovative
application of modern techniques for geothermal exploration by the integration of geological,
geochemical and geophysical methods, study case of Los Humeros volcanic field”, as part of
1 2 3 4 5 6 7 8 9 10 11 12 13 14 15 16 17 18 19 20 21 22 23 24 25 26 27 28 29 30 31 32 33 34 35 36 37 38 39 40 41 42 43 44 45 46 47 48 49 50 51 52 53 54 55 56 57 58 59
CONACYT. N. Beaudoin and the X-ray Computed Tomography scanner at the University of
Strathclyde are funded by the Scottish Funding Council’s Oil and Gas Innovation Centre and
the University of Strathclyde. Mohammad Sayab and an anonymous reviewer provided
insightful comments on the manuscript and are greatly thanked as well as Marie-Camille
Caumon and Klaus Metzger for their careful editorial handling.
References
Anderson, A.J., Bodnar, R.J., 1993. An adaptation of the spindle stage for geometric analysis
of fluid inclusions. Am. Mineral. 78, 657–664.
Baker, D.R., Brun, F., O'Shaughnessy, C., Mancini L., Fife, J.L., Rivers, M., 2012. A
four-dimensional X-ray tomographic microscopy study of bubble growth in basaltic foam.
Nat. Commun. 3, 1135.
Bakker, R.J., 2003. Package FLUIDS 1. Computer programs for analysis of FI data and for
modelling bulk fluid properties. Chem. Geol. 194, 3–23.
Bakker R.J., Diamond, L.W., 2006. Estimation of volume fractions of liquid and vapor phases
in fluid inclusions, and definition of inclusion shapes. Am. Mineral. 91, 635–657.
Balitsky, V.S., Pentelei, S.V., Balitskaya, L.V., Novikova, M.A., Bublikova, T. M., 2011.
Visual in-situ monitoring of the behavior and phase states of water-hydrocarbon
inclusions at high temperatures and pressures. Petrology 19, 653–674.
Balitsky, V.S., Bondarenko, G.V., Pironon, J., Pentelei, S.V., Balitskaya, L.V., Golunova,
M.A., Bublikova, T. M., 2014. The causes of vertical zonation in the distribution of
hydrocarbons over the Earth’s interior: Experimental evidence of the cracking of crude
1 2 3 4 5 6 7 8 9 10 11 12 13 14 15 16 17 18 19 20 21 22 23 24 25 26 27 28 29 30 31 32 33 34 35 36 37 38 39 40 41 42 43 44 45 46 47 48 49 50 51 52 53 54 55 56 57 58 59
Balitsky, V.S., Balitskaya, L.V., Pentelei, S.V., Pironon J., Barres, O., 2015. Synthetic
aqueous–hydrocarbon inclusions in quartz as a source of information on the oil and
gas content in bituminous shale and the phase state of hydrocarbons in a wide range of
temperatures and pressures. Dokl. Earth Sci. 460, 109–112.
Bodnar, R.J., 1983. A method of calculating FI volumes based on vapor bubble diameters and
PVTX properties of inclusion fluids. Econ. Geol. 78, 535–542.
Bodnar, R.J., Student, J.J., 2006. Melt inclusions in plutonic rocks: Petrography and
microthermometry, in: Webster, J.D. (Ed.), Melt inclusions in plutonic rocks. Mineral
Association of Canada Short Course Series Volume 36, pp. 1–25.
Bourdet, J., Pironon, J., 2008. Strain response and re-equilibration of CH4-rich synthetic aqueous fluid inclusions in calcite during pressure drops. Geochim. Cosmochim. Acta
72, 2946–2959.
Carrasco-Núñez, G., Bernal, J.P., Dávila, P., Jicha, B., Giordano, G., Hernández, J., 2018
Reappraisal of Los Humeros volcanic complex by new U/Th zircon and 40Ar/39Ar dating: Implications for greater geothermal potential. Geochem. Geophy. Geosy. 19,
132–149.
Cauzid, J., Philippot, P., Bleuet, P., Simionovici, A., Somogyi, A., Golosio, B., 2007. 3D
imaging of vapor and liquid inclusions from the Mole Granite, Australia, using helical
fluorescence tomography. Spectrochim. Acta B 62, 799–806.
Cnudde, V., Boone, M.N., 2013. High-resolution X-ray computed tomography in
geosciences: A review of the current technology and applications. Earth-Sci. Rev. 123,
1–17.
Colin, A., Burnard, P., Marty, B., 2013. Mechanisms of magma degassing at mid-oceanic
1 2 3 4 5 6 7 8 9 10 11 12 13 14 15 16 17 18 19 20 21 22 23 24 25 26 27 28 29 30 31 32 33 34 35 36 37 38 39 40 41 42 43 44 45 46 47 48 49 50 51 52 53 54 55 56 57 58 59
Créon, L., Rouchon, V., Youssef, S., Rosenberg, E., Delpech, G., Guyot, F., Szabo, Cs.,
Tafforeau, P., Remusat, L., Boller, E., Mostefaoui, S., Asimow, P.D., Antoshechkina,
P.M., Ghiorso, M.S., 2017. Highly CO2-supersaturated melts in the Pannonian lithospheric mantle – A transient carbon reservoir? Lithos 286-287, 519–533.
Créon, L., Levresse, G., Remusat, L., Bureau, H., Carrasco-Nuñez, G., 2018. New method for
initial composition determination of crystallized silicate melt inclusions. Chem. Geol.
483, 162–173.
Dávila-Harris, P., Carrasco-Núñez, G. 2014. An unusual syn-eruptive bimodal eruption: The
Holocene Cuicuiltic Member at Los Humeros caldera, Mexico. J. Volcanol. Geotherm.
Res. 271, 24–42.
Farley, K., Horton, F., 2017. Olivine barometry based on X-ray computed tomography of
fluid inclusions. Goldschmidt conference (Paris), abstract.
Frezzotti, M.L. (2001). Silicate-melt inclusions in magmatic rocks: applications to petrology.
Lithos 55, 273–299.
Gaetani, G.A., Maclennan, J., Le Roux, V., Klein, F., 2015. Reconstructing magma storage
depths from olivine-hosted melt inclusions: Do vapor bubbles matter? American
Geophysical Union, Fall Meeting 2015, abstract #V13B-3124.
Giuliani, G., Groat, L., Ohnenstetter, D., Fallick, A.E., Feneyrol, J., 2014. The geology of
gems and their geographic origin. In: Raeside, E.R., (Ed.) Geology of gem deposits.
Mineralogical Association of Canada Short Course Series Volume 44, pp. 113–134.
Giuliani, G., Boiron, M.C., Morlot, C., Raoul, J., Chatagnier, P.Y., 2015. Demantoid garnet
with giant FI. Gems Gemol. 51, 446–448.
Gómez-Tuena, A., Mori, L., Straub, S.M. Geochemical and petrological insights into the
tectonic origin of the Transmexican Volcanic Belt. Earth-Sci. Rev. in press, doi:
1 2 3 4 5 6 7 8 9 10 11 12 13 14 15 16 17 18 19 20 21 22 23 24 25 26 27 28 29 30 31 32 33 34 35 36 37 38 39 40 41 42 43 44 45 46 47 48 49 50 51 52 53 54 55 56 57 58 59
Hanna, R.D., Ketcham, R.A., 2017. X-ray computed tomography of planetary materials: A
primer and review of recent studies. Chem Erde-Geochem. 77, 547–572.
Jacquemet, N., Guillaume, D., Zwick, A., Pokrovski, G.S., 2014. In situ Raman spectroscopy
identification of the S3– ion in S-rich hydrothermal fluids from synthetic fluid inclusions. Am. Mineral. 99, 1109–1118.
Kesler, S.E., Bodnar, R.J., Mernagh, T.P., 2013. Role of fluid and melt inclusions studies in
geologic research. Geofluids 13, 398–404.
Ketcham, R.A., Carlson, W.D., 2001. Acquisition, optimization and interpretation of X-ray
computed tomographic imagery: applications to the geosciences. Comput. Geosci. 27,
381–400.
Kouzmanov, K., Pettke, T., Heinrich, C.A., 2010. Direct analysis of ore-precipitating fluids:
combined IR microscopy and LA-ICP-MS study of fluid inclusions in opaque ore
minerals. Econ. Geol. 105, 351–373.
Kyle, J.R., Ketcham, R.A., Mote, A.S., 2004. Contributions of high resolution X-ray
computed tomography to ore studies, in: Muhling, J., et al. (Eds.), Extended Abstracts,
Predictive Mineral Discovery Under Cover. Univ. Western Australia, pp. 387–390.
Kyle, J.R., Ketcham, R.A., 2007a. High resolution X-ray computed tomography of fluid
inclusions: European Current Research on Fluid Inclusions. 19th Biennial Conference, Programme and Abstracts, p. 182.
Kyle, J.R., Ketcham, R.A., 2007b. X-ray computed tomography to FI studies of opaque
minerals. International Conference on Geofluids and Fluid Inclusions, Guangzhou,
China.
Kyle, J.R., Ketcham, R.A., 2008. High resolution X-ray computed tomography of fluid
inclusions in opaque minerals. Pan American Current Research on Fluid Inclusions
1 2 3 4 5 6 7 8 9 10 11 12 13 14 15 16 17 18 19 20 21 22 23 24 25 26 27 28 29 30 31 32 33 34 35 36 37 38 39 40 41 42 43 44 45 46 47 48 49 50 51 52 53 54 55 56 57 58 59
Kyle, J.R., Ketcham, R.A., 2015. Application of high resolution X-ray computed tomography to mineral deposit origin, evaluation, and processing. Ore Geol. Rev. 65, 821–839. Legros, H., Marignac, C., Tabary, T., Mercadier, J., Richard, A., Cuney, M., Wang, R.C.,
Charles, N., Lespinasse, M.Y (2018). The ore-forming magmatic-hydrothermal system
of the Piaotang W-Sn deposit (Jiangxi, China) as seen from Li-mica geochemistry.
Am. Mineral., 103, 39–54.
Legros, H., Richard, A., Tarantola, A., Kouzmanov, K., Mercadier, J., Vennemann, T.,
Marignac, C., Cuney, M., Wang, R.C., Charles, N., Bailly, L., Lespinasse, M.Y.
Multiple fluids involved in granite-related W-Sn deposits from the world-class Jiangxi
Province (China). Submitted to Chemical Geology, this volume.
Lespinasse, M., Désindes, L., Fratczak, P., Petrov, V., 2005. Microfissural mapping of natural
cracks in rocks: Implications for fluid transfers quantification in the crust. Chem.
Geol. 223, 170–178.
Lin, Q., Neethling, S.J., Dobson, K.J., Courtois, L., Lee, P.D., 2015. Quantifying and
minimising systematic and random errors in X-ray micro-tomography based volume
measurements. Comput. Geosci. 77, 1–7.
Lüders, V., 2017. Contribution of infrared microscopy to studies of fluid inclusions hosted in
some opaque ore minerals: possibilities, limitations, and perspectives. Miner. Deposita
52, 663–673.
Morlot, C., Pignatelli, I., Giuliani, G., Sterpenich, J., Boiron, M.C., Ohnenstetter, D.,
Andriamamonjy, A., Raoul, J., Chatagner, P.Y., 2016. La tomographie de rayons X et
ses applications en géologie: exemples de l’émeraude trapiche et du grenat
1 2 3 4 5 6 7 8 9 10 11 12 13 14 15 16 17 18 19 20 21 22 23 24 25 26 27 28 29 30 31 32 33 34 35 36 37 38 39 40 41 42 43 44 45 46 47 48 49 50 51 52 53 54 55 56 57 58 59
Nakashima, Y., Hirai, H., Koishikawa, A., Ohtani, T., 1997. Three-dimensional imaging of
arrays of fluid inclusions in fluorite by high-resolution X-ray CT. Neues Jb. Miner.
Monat. 12, 559–568.
Noiriel, C., 2015. Resolving time-dependent evolution of pore-scale structure, permeability
and reactivity using X-ray microtomography. Rev. Mineral. Geochem. 80, 247–285.
Nowecki, J.P., 2014. Tracing seawater evaporation and its role in the formation of
sediment-hosted stratiform copper deposits. Unpublished PhD thesis, University of
Southampton, 217 pp.
Pamukcu, A.S., Gualda, G.A., Rivers, M.L., 2013. Quantitative 3D petrography using X-ray
tomography 4: Assessing glass inclusion textures with propagation phase-contrast
tomography. Geosphere 9, 1704–1713.
Pamukcu, A.S., Gualda, G.A., Bégué, F., Gravley, D.M., 2015. Melt inclusion shapes:
Timekeepers of short-lived giant magma bodies. Geology 43, 947–950.
Petford, N., Miller, J. A., & Rankin, A. H. (1995). Preliminary confocal scanning laser
microscopy study of fluid inclusions in quartz. J. Microsc. 178, 37–41.
Pignatelli, I., Giuliani, G., Ohnenstetter, D., Agrosì, G., Mathieu, S., Morlot, C., Branquet, Y.,
2015. Colombian trapiche emeralds: Recent advances in understanding their
formation. Gems Gemol. 51, 222–259.
Pironon, J., Canals, M., Dubessy, J., Walgenwitz, F., Laplace-Builhe, C., 1998. Volumetric
reconstruction of individual oil inclusions by confocal scanning laser microscopy. Eur.
J. Mineral. 10, 1143–1150.
Roedder, E., 1984. Fluid Inclusions. Rev. Mineral. 12, 644 pp.
Sayab, M., Suuronen, J.P., Hölttä, P., Aerden, D., Lahtinen, R., Kallonen, A.P., 2015.
High-resolution X-ray computed microtomography: A holistic approach to metamorphic
1 2 3 4 5 6 7 8 9 10 11 12 13 14 15 16 17 18 19 20 21 22 23 24 25 26 27 28 29 30 31 32 33 34 35 36 37 38 39 40 41 42 43 44 45 46 47 48 49 50 51 52 53 54 55 56 57 58 59
Sayab, M., Suuronen, J.P., Molnár, F., Villanova, J., Kallonen, A., O’Brien, H., Lahtinen, R.,
Lehtonen, M., 2016. Three-dimensional textural and quantitative analyses of orogenic
gold at the nanoscale. Geology 44, 739–742.
Sterner, S.M., Bodnar, R.J., 1984. Synthetic fluid inclusions in natural quartz I.
Compositional types synthesized and applications to experimental geochemistry.
Geochim. Cosmochim. Acta 48, 2659–2668.
Stoller, P., Krüger, Y., Rička, J., Frenz, M., 2007. Femtosecond lasers in FI analysis:
Three-dimensional imaging and determination of inclusion volume in quartz using second
harmonic generation microscopy. Earth Planet. Sc. Lett. 253, 359–368.
Tuttle, O.F., 1949. Structural petrology of planes of liquid inclusions. J. Geol. 57, 331–356.
Viti, C., Frezzotti, M.L., 2001. Transmission electron microscopy applied to FI investigations.
Lithos, 55, 125–138.
Yao, J.M., Chen, H.Y., Tian, Y.C., Song, W.L., Zhu, S.Y., 2015. Three-dimensional imaging
1 2 3 4 5 6 7 8 9 10 11 12 13 14 15 16 17 18 19 20 21 22 23 24 25 26 27 28 29 30 31 32 33 34 35 36 37 38 39 40 41 42 43 44 45 46 47 48 49 50 51 52 53 54 55 56 57 58 59
Table captions
Table. 1: Summary of key parameters for the experiments. “Phases” refer to the different
phases identified at room temperature within the inclusions. MI: melt inclusion; FI:
fluid inclusion, IEM Institute of Experimental Mineralogy, Cpx: clinopyroxene; Spl:
spinel; Vap.: vapor; Aq. sln.: solution; sb.: solid bitumen; px: pixel; vx: voxel. *
corresponds to the high resolution scanning in the region of interest shown in Fig. 2
(fluid inclusion #3).
Table 2: Preliminary tests of the sensitivity of the calculated phase volume to threshold values
and to scanning resolution, carried out on fluid inclusions (FI) from Sample B. The
fluid inclusions are numbered according to Fig. 2. * corresponds to calculated volumes
with optimal thresholding value. ** corresponds to calculated volumes by varying the
threshold values by 5 % during post-processing stage. The scanning resolution for all
fluid inclusions except *** is 25 µm/px (15625 µm3/vx). *** corresponds to calculated volumes using a scan with a resolution of 7.7 µm/px (456 µm3/vx). FItot: total fluid inclusion volume; Vap.: vapor phase; Liq.: liquid phase; φvap: volumetric fraction of the vapor phase to the entire inclusion; ∆: relative difference between
measurements with different threshold values; px: pixel; vx: voxel.
Figure captions
Fig. 1: Silicate melt inclusion (SMI) in olivine (Sample A). (A) An olivine phenocryst (1.0
mm large) mounted with epoxy (carried out after HRXCT analysis for further
1 2 3 4 5 6 7 8 9 10 11 12 13 14 15 16 17 18 19 20 21 22 23 24 25 26 27 28 29 30 31 32 33 34 35 36 37 38 39 40 41 42 43 44 45 46 47 48 49 50 51 52 53 54 55 56 57 58 59
circle. (B) Secondary electron microscopy imaging of the SMI showing a glass phase,
a vapor bubble and several euhedral crystals of spinel (Spl) and clinopyroxene (Cpx)
identified by secondary electron microscopy analysis. (C) HRXCT 3D reconstruction
of the SMI with four different view angles showing the 3D distribution of the different
phases within the SMI.
Fig. 2: Aqueous fluid inclusions in synthetic quartz (Sample B). (A) Photograph of Sample B
showing an array of elongated and oriented two-phase (liquid + vapor) aqueous fluid
inclusions. Inclusions being a bit out of focus are framed by rectangles. Fluid
inclusions are numbered for correspondence with (B). Note that inclusion #5 is
completely out of focus and is therefore not indicated. The red asterisk indicates the
same inclusion (#3) as in (B) to (F). (B) HRXCT 3D reconstruction of an array of
two-phase fluid inclusions. Surfaces of the liquid two-phase (blue) and vapor two-phase (green) are
represented in a 3D view with perspective effect (vx size is 15625 µm3). Surfaces were produced for each object as triangular mesh (smoothing extent of 3 px for vapor
phases and 1 for FI walls). (C) 2D slice-view of the fluid inclusion indicated by the red
asterisk in (A) and (B) showing the liquid phase (Liq.) and the vapor phase (Vap.)
after image filter application. Grey values refer to relative density, brighter being
denser. From (C) to (F) the spatial resolution is 7.8 µm/px (456 µm3/vx). (D)
Equivalent 2D-view after use of threshold and labelling. The darker pixels belonging
to the vapor phase are gathered as green material, brighter black pixels belonging to
liquid phase are gathered as blue material, while brighter grey pixels belonging to
quartz host are removed from the dataset. (E) Equivalent surface view in 3D with no
1 2 3 4 5 6 7 8 9 10 11 12 13 14 15 16 17 18 19 20 21 22 23 24 25 26 27 28 29 30 31 32 33 34 35 36 37 38 39 40 41 42 43 44 45 46 47 48 49 50 51 52 53 54 55 56 57 58 59
Fig. 3: Synthetic aqueous fluid inclusions trapped in a natural quartz (Qtz) (Sample C). (A) A
typical two-phase liquid (Liq.) + vapor (Vap.) fluid inclusion with apparent φvap value
compatible with the expected value of 42 % (see section 2.2. for details). (B) HRXCT
3D reconstruction of a cluster of aqueous fluid inclusions. Pixels belonging to the
vapor phase are gathered as green material and pixels belonging to liquid phase are
gathered as blue material.
Fig. 4: Aqueous fluid inclusion in “demantoid” garnet (Sample D). (A) A demantoid garnet
(Grt) crystal with a giant two-phase liquid (Liq.) + vapor (Vap.) aqueous fluid
inclusion (photo by Michel Cathelineau). (B) HRXCT 2D slice-view of the aqueous
fluid inclusion and its host crystal after image filter application. Grey values refer to
relative density, brighter being denser. (C) 3D reconstruction of the aqueous fluid
inclusion and its host crystal showing the morphology of the inclusion cavity. The
inner wall of the inclusion is shown in light grey, the outer wall of the inclusion is
shown in light blue and the vapor phase is shown in dark blue.
Fig. 5: Aqueous fluid inclusions in “trapiche” emerald (Sample E). (A) Hand specimen. The
trapiche texture in this sample appears as formed by a central, small hexagonal core,
six arms of intense green color, and dark dendritesbetween the arms and around the
core. (B) Flat monophase liquid (Liq.) aqueous fluid inclusion. (C, D, E) HRXCT 2D
and crossed 2D slice-views of the monophase fluid inclusions and their host crystal.
Fig. 6: Aqueous fluid inclusions in wolframite (Wf) (Sample F). (A) Typical two-phase liquid
(Liq.) + vapor (Vap.) aqueous fluid inclusions observed under optical microscope
1 2 3 4 5 6 7 8 9 10 11 12 13 14 15 16 17 18 19 20 21 22 23 24 25 26 27 28 29 30 31 32 33 34 35 36 37 38 39 40 41 42 43 44 45 46 47 48 49 50 51 52 53 54 55 56 57 58 59
inclusions (in blue and yellow) in a selected area of Sample F. (C) 3D reconstruction
of fluid inclusions from the area selected in (B). After use of threshold and labelling,
the darker pixels belonging to the vapor phase are gathered as yellow material,
brighter black pixels belonging to liquid phase are gathered as blue material.
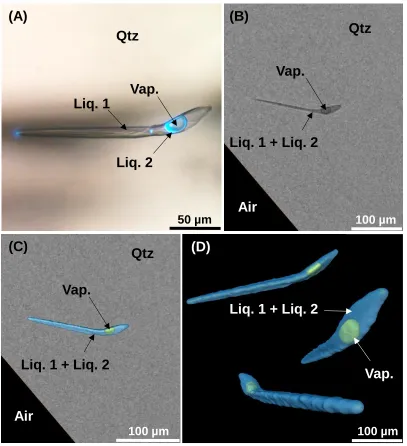
Fig. 7: Hydrocarbon-bearing fluid inclusion in synthetic quartz (Qtz) (Sample G). (A) The
hydrocarbon-bearing fluid inclusion as seen under optical microscope using UV
illumination showing that the inclusion contains a vapor phase (Vap.), an aqueous
solution (Liq. 1) and oil showing UV fluorescence (Liq. 2). (B) HRXCT 2D slice-view
of the hydrocarbon-bearing fluid inclusion after image filter application. Grey values
refer to relative density, brighter being denser. (C) Equivalent 2D-view after use of
threshold and labelling. The darker pixels belonging to the vapor phase are gathered as
green material, brighter black pixels belonging to the aqueous solution + oil phases are
gathered as blue material. (D) 3D reconstruction of the inclusion with three different
view angles. Pixels belonging to quartz host are removed from the dataset.
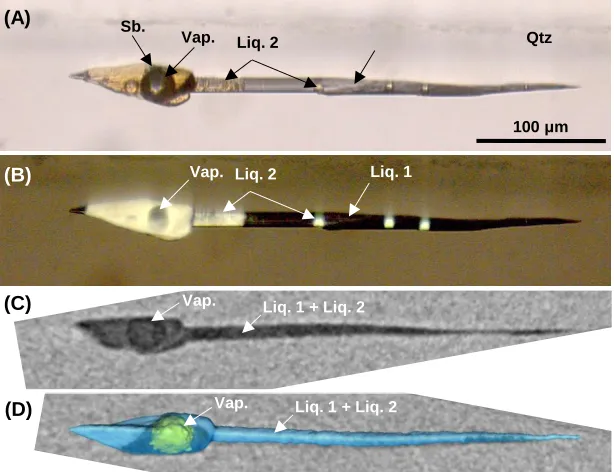
Fig. 8: Hydrocarbon-bearing fluid inclusion in synthetic quartz (Qtz) (Sample H). (A) The
hydrocarbon-bearing fluid inclusion as seen under optical microscope (natural light)
showing that the inclusion contains a vapor phase (Vap.), an aqueous solution (Liq. 1),
oil (Liq. 2) and solid bitumen (Sb.). (B) The hydrocarbon-bearing fluid inclusion as
seen under optical microscope using UV illumination, where hydrocarbon-bearing
phases (Liq. 2 and Sb.) show UV fluorescence. (C) HRXCT 2D slice-view of the
hydrocarbon-bearing fluid inclusion after image filter application. Grey values refer to
relative density, brighter being denser. (D) Equivalent 2D-view after use of threshold
1 2 3 4 5 6 7 8 9 10 11 12 13 14 15 16 17 18 19 20 21 22 23 24 25 26 27 28 29 30 31 32 33 34 35 36 37 38 39 40 41 42 43 44 45 46 47 48 49 50 51 52 53 54 55 56 57 58 59
material, brighter black pixels belonging to aqueous solution + oil phase are gathered
as blue material.
Fig. 9: Hydrocarbon-bearing fluid inclusion in feldspar (Fsp) (Sample I). (A) The
hydrocarbon-bearing fluid inclusion as seen under optical microscope (natural light).
(B) The hydrocarbon-bearing fluid inclusion as seen under optical microscope using
UV illumination, where the oil phase (Liq.) shows UV fluorescence. (C) 3D
reconstruction of the hydrocarbon-bearing fluid inclusion using confocal laser
scanning microscopy and visualization through ImageJ 3D Viewer. (D) HRXCT 3D
Figure 1
Figure 2
(A)
(B)
Vap.
Liq.
Qtz
Qtz
Vap.
Liq.
[image:35.960.304.653.27.511.2](A)
(B)
(C)
Liq.
Vap.
Liq.
Vap.
Grt
Grt
Grt
2 mm
2 mm
[image:36.960.318.550.8.527.2]Vap. Liq.
(D)
Brl Liq.
(E)
(A) (B)
Brl Liq.
(C)
Brl Liq.
Sample holder 100 µm 5 mm
1200 µm
[image:37.960.355.560.10.533.2](A)
(B)
Sulphide veinlet
Wf
Vap. Liq.
(C)
100 μm
200 μm
c-axis
Sulphide veinlet Wf
[image:38.960.328.595.7.533.2](A)
(B)
(C)
(D)
50 µm 100 µm
Liq. 1
Liq. 2
Vap.
Vap.
Liq. 1 + Liq. 2
Vap.
Liq. 1 + Liq. 2
Qtz
Qtz
Qtz
Air
Liq. 1 + Liq. 2
Vap.
[image:39.960.272.679.46.492.2]Air
(A)
(B)
100 μm
Liq. 1
Liq. 2 Vap. Sb.
Qtz
(D) (C)
Vap. Liq. 2
Vap. Liq. 1 + Liq. 2
[image:40.960.280.587.144.380.2]Vap. Liq. 1 + Liq. 2
(A) (B)
(C) (D)
Liq. Liq.
Liq.
Liq.
Vap. Vap.
Vap. Vap.
Fsp
10 μm 10 μm
[image:41.960.297.599.88.399.2]5 μm 5 μm
Univ. Nacional Autónoma
de México (Mexico) (UK)
ZEISS Xradia 510 Versa
Sample # A
Los Humeros volcanic complex (Mexico)
Mineral composition Olivine
Sample size ~1 mm
Inclusion type Silicate MI
Inclusion size ~225 µm
Phases Glass + Cpx + Spl + vap.
Voltage 30 kV 160 kV
Scan time per projection 8 s 0.708 s
Scan time (total) 280 min 37 min
Projections 1601 3141
2.06 µm/px 25 µm/px
8.7 µm3/vx 15625 µm3/vx
Spatial resolution Provenance
B
Synthetized at IEM (Russia)
Synthetic quartz 3×5×2 cm Aqueous FI ~1-3.5 mm Aq. sln. + vap. Setup
Univ. of Strathclyde
[image:42.612.175.513.69.312.2]Nikon XTH 320/225
Table 1
FI # FItot (Vap. + Liq.)* Vap.* Liq.* φvap* FItot (Vap. + Liq.)**
(mm3) (mm3) (mm3) (%) (mm3)
1 0.28568 0.05581 0.22987 19.5 0.23726
2 0.51785 0.11246 0.40539 21.7 0.45623
3 0.48057 0.10791 0.37266 22.5 0.42364
4 0.40321 0.08927 0.31394 22.1 0.35030
5 0.02901 0.00378 0.02523 13.0 0.01911
6 0.37026 0.08004 0.29022 21.6 0.32465
7 0.45170 0.10092 0.35078 22.3 0.39701
8 0.33186 0.07337 0.25849 22.1 0.28893
[image:43.612.176.514.67.223.2]3*** 0.46119 0.11086 0.35033 24.0 0.14485
Table 2