City, University of London Institutional Repository
Citation
: Cho, C. H., Jung, J. H., Kwak, B., Lee, J. & Yoo, C-Y. (2017). Professors on the
Board: Do They Contribute to Society Outside the Classroom?. Journal of Business Ethics, 141(2), pp. 393-409. doi: 10.1007/s10551-015-2718-xThis is the accepted version of the paper.
This version of the publication may differ from the final published
version.
Permanent repository link:
http://openaccess.city.ac.uk/15450/Link to published version
: http://dx.doi.org/10.1007/s10551-015-2718-x
Copyright and reuse:
City Research Online aims to make research
outputs of City, University of London available to a wider audience.
Copyright and Moral Rights remain with the author(s) and/or copyright
holders. URLs from City Research Online may be freely distributed and
linked to.
City Research Online: http://openaccess.city.ac.uk/ [email protected]
PROFESSORS ON THE BOARD: DO THEY CONTRIBUTE TO SOCIETY OUTSIDE THE CLASSROOM?
Charles H. Cho* ESSEC Business School 1 AVENUE BERNARD HIRSCH
CS 50105 CERGY
95021 CERGY PONTOISE CEDEX FRANCE
E-mail: [email protected]
Jay Heon Jung KAIST College of Business
Korea Advanced Institute of Science and Technology Seoul, South Korea
E-mail: [email protected]
Byungjin Kwak KAIST College of Business
Korea Advanced Institute of Science and Technology Seoul, South Korea
E-mail: [email protected]
Jaywon Lee
KAIST College of Business
Korea Advanced Institute of Science and Technology Seoul, South Korea
E-mail: [email protected]
Choong-Yuel Yoo KAIST College of Business
Korea Advanced Institute of Science and Technology Seoul, South Korea
E-mail: [email protected]
Acknowledgments
The authors are grateful for comments and suggestions provided by Den Patten, and participants of the International Conference for Green Finance, the 35ème Congrès de l’Association Francophone de
Comptabilité (AFC) in Lille (special thanks to discussant Tiphaine Compernolle) and research seminars at Yonsei University, KAIST-Korea University (Joint Accounting Research Workshop) and IESEG. Byungjin Kwak and Choong-Yuel Yoo acknowledge financial support received from 2011-2013 KAIST Internal Research Grant.
PROFESSORS ON THE BOARD: DO THEY CONTRIBUTE TO SOCIETY OUTSIDE THE CLASSROOM?
ABSTRACT
According to our data, 38.5% of S&P 1500 firms have at least one professor on their boards. Given the lack of research examining the roles and effects of academic faculty as members of boards of directors (professor-directors) on corporate outcomes, this study investigates whether firms with professor-directors are more likely to exhibit higher corporate social responsibility (CSR) performance ratings. Results indicate that firms with professor-directors do exhibit higher CSR performance ratings than those without. However, the influence of professor-directors on firm CSR performance ratings depends on their academic background—the positive association between the presence of professor-directors and firm CSR performance ratings is significant only when their academic background is specialized (e.g., science, engineering and medicine). Finally, this positive association weakens when professor-directors hold an administrative position at their universities.
1
PROFESSORS ON THE BOARD: DO THEY CONTRIBUTE TO SOCIETY OUTSIDE THE CLASSROOM?
Introduction
This study examines whether firms with academic faculty members on the board of
directors (i.e., professor-directors) are more likely to exhibit higher corporate social
responsibility (CSR) performance ratings. Anderson et al. (2011) find that board members
with heterogeneous/diverse backgrounds bring valuable experience, knowledge, resources,
and perspectives to the boardroom to make the board of directors monitor and/or advise
managers more effectively. The extant literature on corporate governance and boards of
directors suggests that board composition and its characteristics affect business outcomes
such as corporate policy and financial performance (see Adams and Ferreira 2009; Baysinger
et al. 1991; Cohen et al. 2012; Hill and Snell 1988; Masulis et al. 2012; Valentine and
Fleishman 2008; Wang and Coffey 1992; Williams 2003).
Many firms appoint university professors as members of their board of directors.
According to our data, 38.5% of S&P 1500 firms have at least one professor-director. As is
the case for various types of directors documented in prior literature (e.g., female, foreigner,
banker, analyst, and labor union member), university professors have specific characteristics
that may affect firm performance (e.g., Francis et al. 2014). Tierney (1997) suggests that the
three key responsibilities of professors are research, teaching, and service to the university
and to the community, all of which contribute to society in the long-term. Moreover,
academics are, in general, perceived to possess relatively higher ethical and socially
responsible standards (Baumgarten 1982; Bowman 2005; Charnov 1987; Chickering and
Gamson 1999; O’Connell 1998; Tierney 1997). Thus, university professors who possess
some in-depth knowledge and a sense of responsibility about both business and society are
2
However, there is little research directly examining the roles and effects of
professor-directors on corporate outcomes (e.g., Francis et al. 2014). To the best of our knowledge, this
study is the first to investigate whether professor-directors may affect firm outcomes with a
specific focus on CSR performance ratings. Prior literature reveals that firm CSR
performance is influenced by the characteristics of their board members. For example, firms
with female board members are more likely to engage in CSR activities (Mesch et al. 2011;
Williams 2003). Also, Valentine and Fleishman (2008) report that firms are more likely to be
involved in CSR activities when the members on the corporate board have higher levels of
professional ethical standards.
In this paper, therefore, we investigate whether the presence of professor-directors is
associated with CSR performance ratings. Further, we examine post-hoc whether the impact
of having professor-directors on CSR performance ratings depends on their academic
background. Finally, we investigate whether having professor-directors who hold an
administrative position (e.g., Dean, President, Chancellor, etc.) at their universities has a
different impact on CSR performance ratings compared to professor-directors without such
administrative positions.
The remainder of the paper is organized as follows. In the next section, we discuss the
relevant prior literature and develop our research question. We then describe the data and
present the descriptive statistics of our professor-director sample. Finally, we present our
results and provide our conclusions and implications.
Prior Literature and Research Question
Board Heterogeneity and Corporate Outcomes
Numerous studies have investigated the link between board heterogeneity and
corporate outcomes (e.g., Adams and Ferreira 2009; Anderson et al. 2011; Cohen et al. 2012;
3
2011; Williams 2003).1 Following Anderson et al. (2011), we classify board heterogeneity
into two categories – social heterogeneity (e.g., gender, age, and ethnicity) and occupational
heterogeneity (e.g., education, experience, and profession) – and review the related literature
as follows.
First, as to social heterogeneity in a board, a number of studies have examined the
impact of director gender on firm performance and operations (e.g., Adams and Ferreira
2009; Mesch et al. 2011; Willams 2003). In particular, Williams (2003) investigates the
impact of female directors on corporate philanthropy and finds that the number of female
directors is positively associated with the level of a firm’s involvement in corporate
philanthropy. Williams classifies the overall philanthropy activities into four specific types of
charitable giving (educational organizations; community service organizations; arts
programs; and public policy programs) and reports that female directors exert their influence
on corporate philanthropy, particularly to community service organizations and arts
programs. Mesch et al. (2011) also investigate gender differences in charitable giving and
find that both the likelihood and the amount of giving are greater for female than for male
directors, even after controlling for psychological differences (i.e., empathic concern and
principle of care measures). Adams and Ferreira (2009) examine the impact of female
directors on corporate governance and firm performance and find that the average effect of
female directors on firm performance is negative, although female directors provide stronger
monitoring effectiveness.
Besides gender diversity, director nationality is also examined in relation to firm
performance. Masulis et al. (2012) investigate directors’ nationality and document that firms
with foreign directors make better cross-border acquisitions if those foreign directors live in
4
the same region as that of the target firm, but report that the net effect of foreign directors on
corporate governance and firm performance is negative.
Next, in the literature on occupational heterogeneity in a board, Hillman et al. (2000)
argue that occupational differences in directors on the board not only strengthen expertise but
also broaden linkages to important external constituencies. In particular, they examine US
airline firms undergoing deregulation and conclude that firms respond to significant external
environmental changes by altering board composition to reflect the shift in resource needs.
Hillman et al. (2001) examine the relation between the presence of stakeholder directors (e.g.,
suppliers, employees, and community representatives) and stakeholder performance (i.e.,
corporate social responsibility) and find that certain types of stakeholder directors affect
corporate social performance such as diversity and environment. Fich (2005) identifies
various occupations of outside directors such as CEOs, professors, bankers, lawyers, and
consultants and finds that (1) firms experience long-term performance improvement when
they appoint CEOs of other firms as outside directors (i.e., CEO directors) but not when they
appoint non-CEO directors and (2) the market reacts more strongly to the appointment of
CEO directors than non-CEO directors. These results suggest that CEO directors are
perceived in the market as sources of more valuable managerial talent and unique expertise.
Güner et al. (2008) examine whether bankers on the board have distinct roles on
corporate decisions and report that lending bankers on the board can reduce the debt ratio of a
firm while investment bankers increase bond issuances. More recently, Cohen et al. (2012)
identify a new type of outside director, i.e., sell-side analysts. They identify outside directors
who have covered a firm as sell-side analysts prior to their director appointment and find that
firms with analysts on the boards tend to subsequently increase the level of earnings
management, which indicates the poor monitoring performance of analyst directors.
5
board and argue that board heterogeneity can bring more resources to the boardroom, which
in turn improves the effectiveness or efficacy of monitoring and advising managers. They
also compare the impact of social heterogeneity with that of occupational heterogeneity on
firm performance and find that while both social and occupational heterogeneity have a
positive effect on financial performance, the positive impact of occupational heterogeneity is
50% greater than that of social heterogeneity.
In sum, prior literature suggests that while corporate financial performance is affected
by both social and occupational heterogeneity in the board, corporate social performance is
primarily influenced by board social (e.g., gender) heterogeneity. As university professors
have become a visible source of board heterogeneity (e.g., White et al. 2013; see our Table 1),
we argue that it is important to examine the potential impact of professor-directors on
corporate outcomes.
Professors and Corporate Outcomes
Several studies have investigated the role of professors on the board (e.g., Audretsch
and Lehmann 2006; Audretsch and Stephan 1996; Duchin et al. 2010; Fich 2005; Francis et
al. 2014; Güner et al. 2008; Jiang and Murphy 2007; White et al. 2013). For instance,
Audretsch and Stephan (1996) focus on the advisory role of university-based scientists and
argue that professors provide three functions to biotech firms: 1) knowledge transfer; 2)
signaling the quality of the firm’s research to both capital and resource markets; and 3)
helping chart the scientific direction of the firm. Fich (2005) finds that while market reactions
to director appointments are statistically significant when appointees are CEOs of other firms,
these reactions lose significance when appointees are professors. Audretsch and Lehmann
(2006) find that the likelihood of having professors on the board is affected by geographic
proximity to a university and to an industry. More interestingly, Jiang and Murphy (2007)
6
business professors as executives perform significantly better than firms without such
executives. Güner et al. (2008) examine whether board members with financial expertise
affect corporate policies (e.g., loan, public debt issuances, and acquisitions) and find that
finance professors are significantly associated with lower pay-performance sensitivity, but
not significantly associated with other policies. White et al. (2013) show that small- and
mid-cap firms are more likely to appoint professors than large firms and that the financial market,
on average, positively (insignificantly) reacts to the appointment of professors with science,
medicine, and engineering (business) background. Francis et al. (2014) report that the
presence of professors is positively associated with firm financial performance and that firms
with business-related professors exhibit the best performance, whereas Duchin et al. (2010)
document that academic board members do not affect firm financial performance.
In sum, while the aforementioned studies identify professors and examine their
differential impacts on various aspects of firms, none to our knowledge solely focuses on the
role and impact of professors on corporate social responsibility.
Characteristics of Professors and Corporate Social Responsibility
As other occupations, university professors have their own unique characteristics.
Generally speaking, they are deemed socially obligated in diverse aspects by the public
(Baumgarten 1982; Bowman 2005; Charnov 1987; Chickering and Gamson 1999; O’Connell
1998; Tierney 1997). For example, Baumgarten (1982) argues that university teachers have a
social obligation to help other citizens both inside and outside the classroom—the academic
profession should have higher ethical standards to seek social benefits in lieu of its own and,
accordingly, university professors have obligations toward at least some segments of the
community. Charnov (1987) asserts that professors are good citizens as they must take roles
in being ethical professionals. Tierney (1997) argues that the three key responsibilities of
7
all of which contribute to society in the long-term. As educators who exercise influence upon
the present as well as future generations, professors are obligated to fulfill their own moral
responsibilities (O’Connell 1998) and must respect the diversity of talents (Chickering and
Gamson 1999). Finally, Bowman (2005) argues that a teacher is obligated to base his or her
principles on universal ethics such as humility, honesty, trust, empathy, healing, community,
and service. It is therefore plausible that professors have, or at least are expected to have, a
higher standard of professional ethics, compared to people working in other professions.2
Nevertheless, there exist some studies that question the ethical standard of professors,
particularly when it relates to professors specializing in the field of business. Indeed, business
schools and professors have been widely criticized for failing to train responsible managers
(Bennis and O’Toole 2005; Ghoshal 2005; Gonin 2007; Mitroff 2004; Owen 2005). Mitroff
(2004) asserts that business educators are, at worst, guilty of being active accomplices and
co-conspirators in corporate scandals. Ghoshal (2005) argues that business school faculty
needs to own up to their roles in creating such scandals and denounces that these scandals
happened because they had propagated amoral ideas and theories to their students. Similarly,
Bennis and O’Toole (2005) argue that business schools fail to instill norms of ethical
behavior into students. Also, Owen (2005) criticizes accounting professors for having
neglected the importance of corporate accountability and transparency in the current
education system. Finally, Gonin (2007) argues that the civic responsibilities of business
scholars and business schools have been questioned as the recent ethical scandals in the
business world arise—he attributes these ethical shortcomings to inadequate business
education.
2 The Roy Morgan “Image of Professions” Survey, conducted in the spring of 2013 in Australia, asked
8
Because (1) individuals’ perceptions or beliefs about professional ethics are positively
associated with their attitude toward CSR and (2) CSR attitudes are also positively associated
with involvement in CSR activities (Valentine and Fleishman, 2008), we argue that if
professor-directors have higher (lower) levels of ethical standards, they are more (less) likely
to promote CSR activities, hence firms are more (less) likely to engage in CSR activities.
Given the relatively mixed evidence about the ethicality of professors, we take an exploratory
approach to investigate whether firms with professors on their board of directors exhibit
different levels of CSR performance ratings. We formulate our research question as follows:
Research Question: Is the presence of professors on the board of directors associated with CSR performance ratings?
Sample and Data
Our sample is built from RiskMetrics over the period from 2003 to 2011, inclusive.
We first identify professors on the boards of S&P 1500 firms by verifying the primary title
and employer of individual directors’ biographic information in the RiskMetrics database. We
then manually collect each professor’s detailed information such as affiliation, academic
discipline, and whether the professor holds any administrative position at the university by
searching and browsing through their school websites, personal blogs and the press websites
(i.e., Forbes and Businessweek). With respect to identifying each professor’s academic
discipline, we first rely on their highest degree obtained; if this information is not available,
we use their current department affiliation (e.g., economics, business, biology, or
mathematics) as their academic discipline.
Next, we merge our professor sample with KLD database for CSR performance
ratings. Considering that professors also play a major role in socialization of students, we
believe that they will most likely influence “Community Donations”, “Employee Benefits”,
9
Accordingly, our analysis focuses on the three aforementioned CSR dimensions.3 In
particular, we measure our CSR dependent variables as the net difference between strengths
and weaknesses of a firm’s scores in each of the three CSR dimensions from the KLD
database.4 Further, we supplement our sample with data from RiskMetrics (director and board
characteristics), COMPUSTAT (fundamental information), ExecuComp (insider ownership),
Thomson Reuters 13F Institutional Holdings (Institutional ownership), and CRSP (stock
information). As the final step, we exclude observations with missing values and obtain a
total of 10,297 firm-years, for 97,382 firm-year-directors. We winsorize all continuous
variables at the 1% and 99% level to mitigate outlier effects. All variable definitions are
described in the Appendix.
Table 1 shows the distributions of sample firms that have professor-directors by year
and by industry. Panel A shows that the percentage of firms with at least one professor on the
board is on average 38.51% in our sample. This indicates that a significant portion of S&P
1500 firms have at least one professor-director. Panel A does not indicate any noticeable
trend in terms of the number or the proportion of firms with professor-directors over the
sample period. Panel B shows the variation in the proportion of firms with professor-directors
across the Fama-French 12 industry sectors. The healthcare (consumer durables) industry has
the highest (lowest) proportion of firms that have professor-directors, with an average of
55.76% (20.25%) of the industry members having professor-directors.
[Insert Table 1 here]
3 As a robustness test, we also check and find that our results are qualitatively the same even when we extend
our analysis into the other four CSR dimensions (i.e., we use a dependent variable that sums up all scores in seven CSR dimensions of KLD).
4 There may be potential concerns about the use of net difference scores, i.e., sum of strengths – sum of
weaknesses (Allison 1990; Edwards and Parry 1993; Johns 1981). However, we choose to use such difference scores as our CSR dependent variables because several recent studies that use the KLD database have commonly done so (Barnea and Rubin 2010; Chen et al. 2008; Rekker et al. 2012). Following Barnea and Rubin (2010), we assume that all types of CSR strengths and weaknesses are equal in terms of their importance and costs.
10
Figure 1 reports the yearly distribution of 5,189 professor-directors by academic
discipline and title. In Figure 1-A, we classify professors’ academic discipline into seven
different categories (i.e., Economics and Business; Engineering and Science; Medicine;
Politics; Law; Education; and Others) and show yearly distributions of professors in each
category.5 Figure 1-A illustrates that while the number of professor-directors who major in
other disciplines is relatively stable during the sample period, the number of Economics and
Business professors is increasing (from 203 in 2003 to 248 in 2011). In fact, Economics and
Business professors account for 41.5% of all professors in our sample and their number is
almost ten times greater than that of Education professors. Engineering and Science
professors and Medicine professors are the second and third largest groups, accounting for
17.69% and 12.50% of total professor-directors, respectively.
[Insert Figure 1 here]
Figure 1-B shows the yearly distributions of professor-directors by their respective
administrative positions (i.e., President, Dean, Chair, Chancellor, Head, and Provost). Almost
half (48.02%) of professors in our sample hold an administrative position, the most common
of which is President (24.30%), followed by Dean (14.64%) and Chair (4.16%).
Results
Summary Statistics
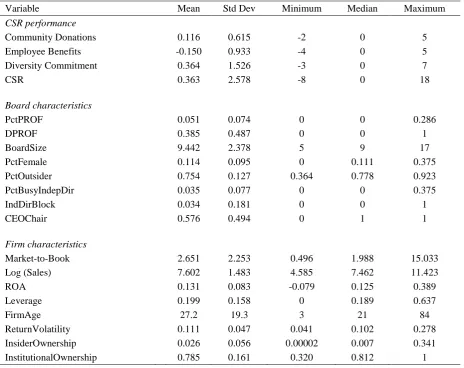
Panel A of Table 2 provides summary statistics. Except for Employee Benefits, the
CSR variables have positive mean values. The sample firms on average have 9.4 board
members and 75.4% of the board members are independent directors. Female directors
account for 11.4% of the positions on the board. Busy independent directors are outside
directors who hold at least three or more directorships in other firms (Masulis et al. 2012) and
they account for 3.5% of directors. We also find that 3.4% of our firms have an independent
11
director who holds more than 5% of a firm’s outstanding shares, whereas 57.6% of firms
have CEO/Chairman duality. Finally, the mean proportion of professor-directors on the board
is 5.1%. Other firm characteristics are consistent with prior literature that covers S&P 1500
firms (e.g., Adams and Ferreira 2009; Masulis et al. 2012).
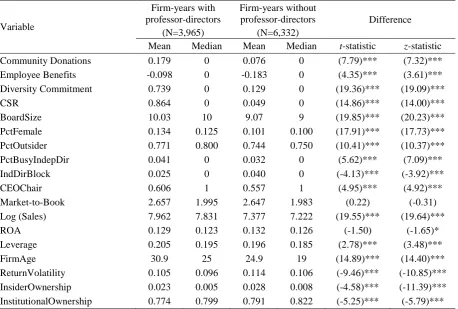
Panel B of Table 2 provides a comparison between firms with and firms without
professor-directors. Firms with professors on their board appear to outperform firms without
such professor-directors with regards to all CSR performance rating measures (i.e.,
Community Donations, Employee Benefits, Diversity Commitment, and the composite
measure of CSR). Also, firms with professor-directors have larger boards, more female
directors, and more independent directors than those without; log (Sales) is significantly
higher in firms with professor-directors than those without, indicating that large firms are
more likely to appoint directors than small firms. Finally, firms with
professor-directors are more mature than those without (30.9 versus 24.9 years), and the return
volatility of firms with professor-directors is significantly lower than that of firms without
(0.105 versus 0.114). Overall, results in Panel B of Table 2 suggest that the presence of
professors on the board may be influenced by certain firm characteristics. Hence, in our
regression models, we control for various firm characteristics that may influence firms’
decision to appoint professors on their boards.
[Insert Table 2 here]
The Impact of Professor-Directors on CSR Performance Ratings
We begin our analysis using the following Ordinary Least Squares (OLS) regression
model:
CSR Performance Ratings =
β0+ β1 DPROF (or PctPROF) + β2 BoardSize + β3 PctFemale
+ β4PctOutsider + β5 PctBusyIndepDir + β6IndDirBlock + β7 CEOChair
+ β8 Market-to-Book + β9Log (Sales) + β10 ROA + β11 Leverage +
β12FirmAge + β13 ReturnVolatility + β14 InsiderOwnership + β15
12 + Year dummies + Industry dummies + ε.
The above model determines CSR performance ratings as a function of the presence of
professor-directors (i.e., DPROF and PctPROF), board-, and firm-specific characteristics. To
mitigate concerns that the impact of professor-directors on CSR performance ratings may be
driven by correlated omitted variables, we control for several CSR determinants suggested by
prior research: proportion of inside directors (Wang and Coffey 1992), insider ownership and
institutional ownership (Barnea and Rubin 2010; Oh et al. 2011), firm size (Amato and
Amato 2007), and other board- and firm- characteristics such as CEO/Chair duality, firm age,
profitability, and leverage (Chen et al. 2008; Barnea and Rubin 2010). We also include year
dummies and SIC 2-digit industry dummies to capture year and industry fixed effects (e.g.,
Amato and Amato 2007). In addition, we use standard errors clustered by firm to correct for
intra-group correlations of residuals within firms (Petersen 2009).
Table 3 presents the OLS regression results. We examine the relation between the
presence of professor-directors and CSR performance ratings using four different measures of
CSR. Except for column (1), which shows an insignificant relation between Community
Donations and an indicator for professor-directors on the board (DPROF), columns (3), (5),
and (7) provide evidence that firms with at least one professor-director have a significantly
higher level of CSR performance ratings. In columns (2), (4), (6), and (8), we examine
whether CSR performance ratings increase as more professors sit on the board (PctPROF),
and find positive and statistically significant results.
Overall, our control variables show consistent results with prior studies (e.g., Barnea
and Rubin 2010; Mesch et al. 2011; Oh et al. 2011; Williams 2003).6 For example, firms with
a greater number of female directors (PctFemale) and firms with better financial performance
6 To ensure that multicollinearity is not a significant issue in our study, we check and find that all VIFs
13
engage more actively in CSR activities. Also, insider ownership is negatively and
significantly associated with CSR performance ratings, supporting the notion that firms are
reluctant to invest in CSR activities when insiders should bear high CSR expenditure.
[Insert Table 3 here]
CSR and Professor-Directors from Different Academic Disciplines
While we posit that professors have, or at least are expected to have, a higher level of
social obligations than other occupations, it is important to recognize that professors
constitute a group of heterogeneous professionals who possess different academic training,
discipline knowledge, and scholarly experience (White et al. 2013). Accordingly, in this
section, we examine the heterogeneous characteristics of professors and investigate whether
the impact of professor-directors on CSR performance ratings varies with their academic
backgrounds.
Following White et al. (2013), we first classify professor-directors into two groups
based on their academic fields of study: 1) business professors whose academic backgrounds
correspond to either business, economics or law; and 2) specialized professors whose
academic backgrounds correspond to either engineering, science or medicine. We then
measure the proportion of business professor-directors {PctPROF (Business)} and that of
specialized professor-directors {PctPROF (Specialized)} to examine whether they have
heterogeneous impacts on CSR performance ratings.
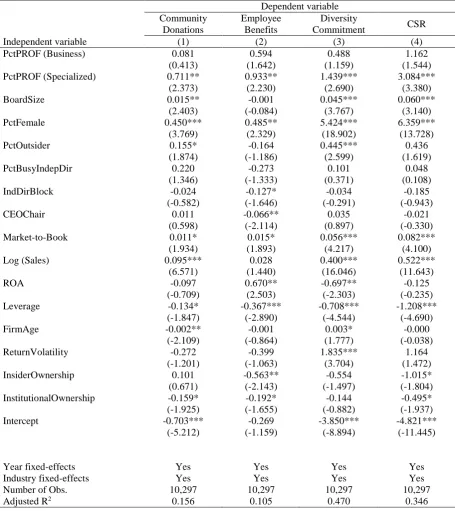
Table 4 presents the results of OLS regressions where dependent variables are CSR
performance ratings and the variables of interest are the percentage of either business or
specialized professor-directors out of all board members. Interestingly, we find a clear
distinction in the coefficients on the percentage of professor-directors between business and
specialized academic backgrounds. That is, while the coefficients on PctPROF (Specialized)
14
(Business) are significant, indicating that business professors may be relatively less ethical
than professors in other disciplines.
The significant and positive impact of specialized professors (e.g., engineering,
science, and medicine) on CSR performance ratings can be explained by their relatively high
ethical standards as educators as well as by the very nature of their academic disciplines
(engineering, science, and medicine) that cares for firm long-term prosperity through such
CSR activities as R&D, for example.7 However, in stark comparison, the insignificant results
for business professors can be interpreted in line with the wide criticism of business
professors and business schools (see Bennis and O’Toole 2005; Ghoshal 2005; Gonin 2007;
Mitroff 2004; Owen 2005). In addition, considering that business professors are those who
possess general business expertise that enables them to play both monitoring and advisory
roles (White et al. 2013), they may be less likely to invest in CSR activities if they view such
spending as less valuable for shareholders’ wealth.
[Insert Table 4 here]
CSR and Professor-Directors with Administrative Positions
White et al. (2013) suggest that professors have heterogeneous characteristics
conditional on whether they hold an administrative position (e.g., President, Dean,
Department Chair, etc.) within their universities.8 Thus, in this section, we examine the
different characteristics of professor-directors with an administrative position
(“administrative professor-director”, hereafter) and determine whether and how their impact
7 Audretsch and Stephan (1996) argue that university-based scientists provide three functions to biotech firms:
1) knowledge transfer, 2) signaling the quality of the firm’s research to both capital and resource markets, and 3) help chart the scientific direction of the firm. Thus, specialized professors’ role is to provide advice to make a firm succeed in the long run.
8 White et al. (2013) introduce some characteristics of administrative professor-directors. For example,
administrative professors may provide appointing firms with beneficial social networks and additional access to resources but, at the same time, they may not be able to provide highly technical and industry-specific advice as it is likely that they have not been active in terms of research since they became administrators at their
15
on CSR performance ratings is different from that of professor-directors without such
position.
Following White et al. (2013), we first divide professor-directors into two groups
based on whether professors hold an administrative position at their universities. Our
variables of interest are the proportion of administrative professor-directors {PctPROF
(Admin)}, and that of non-administrative professor-directors {PctPROF (No Admin)}.
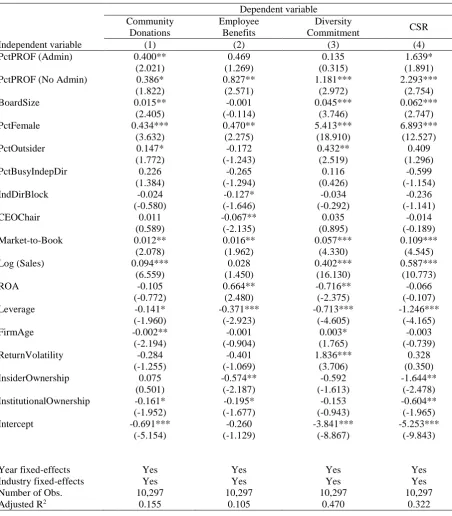
Table 5 presents the OLS regression results. In column (1) where the dependent
variable is Community Donations, both of the percentages of professor-directors with and
without an administrative position show positive and significant coefficients, implying that
the presence of professors, regardless of whether they hold such position or not, indeed
increases firm CSR performance ratings with respect to community donations.
In columns (2) and (3), while the percentage of non-administrative professor-directors
shows positive and significant coefficients on Employee Benefits and Diversity Commitment,
the percentage of administrative professor-directors does not exhibit statistically significant
coefficients for those dimensions.9 Finally, when a composite measure of CSR is used as a
dependent variable in column (4), both variables are significantly positive but the impact of
administrative professor-directors on CSR is only statistically marginal at the 10% level.
Overall, Table 5 shows that the impact of the presence of professor-directors on CSR
performance ratings is less clear when professors are administrators at their universities. One
possible explanation is that professors with an administrative job are busier with their duties
than professors who do not hold such positions within their universities. Thus, administrative
professor-directors may have fewer opportunities to exert their influence on firm CSR
activities than other directors. Indeed, we find that administrative
9 According to KLD guidelines, ‘diversity commitment’ ratings take into account whether a firm hires women,
disabled or gays/lesbians. However, these ratings do not consider occupational diversity such as hiring
16
directors hold a significantly higher number of directorships in other firms than
non-administrative professor-directors (0.652 versus 0.495 directorships in other firms, t-stat =
6.48).10
[Insert Table 5 here]
Robustness Test and Additional Issues
Endogeneity of Professor-Directors on the Board
While the main purpose of our study is to examine the association between the
presence of professor-directors and firm CSR performance ratings as reported in Table 3,
there may be concerns about a potential endogeneity (or, reverse causality) issue in our OLS
regression results. That is, firms with high CSR performance ratings may simply seek and
appoint professors as directors on their boards, or professors may have strong incentives to
join CSR-friendly firms for their reputation. If such factors are correlated with CSR
performance ratings but not adequately captured by our control variables, then the presence
of professor-directors will be correlated with error terms of the OLS regressions, thereby
biasing our OLS coefficient estimates. We use the instrumental variable (IV) approach to
address this endogeneity concern. The instrumental variable should be correlated with the
presence of professor-directors, but not with error terms in the OLS regression of CSR
performance ratings. Referring to the instrument for the presence of female directors
introduced by Adams and Ferreira (2009), we define our instrumental variable as the
percentage of non-professor-directors on the board who sit on other boards on which there are
professor-directors (CONNPROF).11 Our instrumental variable is based on the intuition that,
as argued by Adams and Ferreira (2009) for female directors, professor-directors also do not
have enough strong business networks to obtain board directorship appointments in
10Although statistically insignificant, we also find that the percentage of having attendance problem (i.e.,
attended less than 75% of board meetings) is higher for professor-directors with administrative positions than professors-directors without administrative jobs (1.24% vs. 1.00%, t=0.83).
11Adams and Ferreira (2009) use an instrumental variable for the presence of female directors as the fraction of
17
comparison to other business-related occupations (e.g., executives, bankers, and lawyers).
Thus, if some non-professor-directors have networks or connections to a university or
professors, it is more likely that professors will have better opportunities to sit on the board of
the firm, thereby increasing the proportion of professor-directors. As we cannot measure the
individual directors’ actual social connections to a university or professors, we alternatively
rely on the information of board directorships provided by RiskMetrics and assume that a
director has social network to professors if he or she sits on the board of other firms where
professors also serve as directors at the same time.
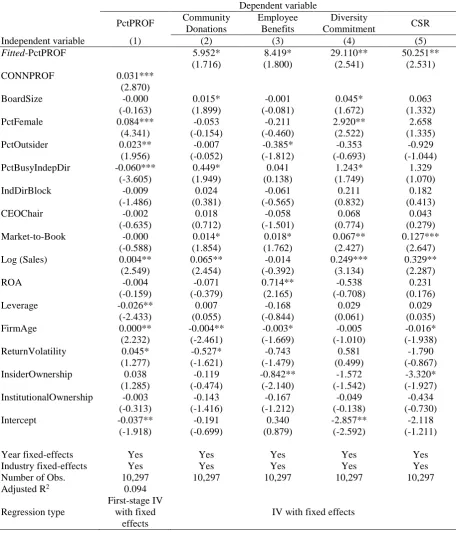
Table 6 presents the results of two-stage least squares (2SLS) regressions. Column (1)
reports the first stage of 2SLS regression. We estimate the OLS regression where the
dependent variable is the percentage of professor-directors on the board (PctPROF). We find
a positive and significant coefficient (0.031, t-stat = 2.870) on CONNPROF and the result
indicates that our instrumental variable can properly explain the endogenous variable, i.e., the
presence of professor-directors.
Columns (2)-(5) report the second stage results of 2SLS regressions where dependent
variables are CSR performance ratings and the endogenous variable (PctPROF) is replaced
with the fitted value (Fitted-PctPROF) obtained from the first stage regression. We find that
the percentage of professor-directors is still significantly and positively associated with CSR
performance ratings, suggesting that professor-directors indeed appear to increase the level of
firm CSR performance ratings. All other specifications are identical to those in Table 3.
[Insert Table 6 here]
CSR and Temporal Change in the Number of Professor-Directors
In the preceding section we provide some statistical evidence that professor-directors
do positively affect firm CSR performance ratings. To further investigate the causal
18
additional tests by incorporating temporal dimensions in this section. That is, we capture the
temporal change in the presence of professor-directors and examine its relation to firm CSR
activities.
First, to allow for a rather long-term oriented CSR investment, we measure the change
in the number of professor-directors over two consecutive years {△NPROF (t)} and include
two lags of the change in the number of professor-director, △NPROF (t-1) and △NPROF
(t-2), together in the regression models.12 The untabulated results indicate that the change in the
number of professor-directors in year t is positively associated with the composite measure of
CSR at 10 percent level. Further, the change in the number of professor-directors in year t is
more strongly and positively associated with the strengths of CSR performance ratings (i.e.,
strengths in community donations, diversity community, and CSR), suggesting that the
change in the number of professor-directors is associated with the level of firm CSR
performance ratings this year.13
Second, we measure the dismissal of professor-directors from the board as an
indicator that equals one if a firm begins to have no professors on its board from this year
while it previously had, and zero otherwise {DismissPROF (t)}. We then estimate the
regressions of CSR performance ratings on DismissPROF (t), DismissPROF (t-1),
DismissPROF (t-2) and control variables. Untabulated results show that the past dismissal of
professor-directors is negatively (positively) and significantly associated with the current
level of firm CSR net performance and strengths (weaknesses). Hence, these results suggest
that firm CSR performance ratings tend to weaken if professor-directors are dismissed in the
12 We find inferentially similar results when the change in the proportion of professor-directors (△PctPROF) is
used.
13 In the next section, we provide the rationale or justification for decomposing our CSR dependent variables (in
19
preceding years.14 Overall, our additional analyses suggest that the presence of
professor-directors appear to affect firm CSR performance ratings.15
CSR Strengths vs. Weaknesses as Dependent Variables
Our dependent variables are measured as the net difference scores between CSR
strengths and weaknesses, the metrics of which are widely used in prior literature that relies
on the KLD database (e.g., Barnea and Rubin 2010; Chen et al. 2008; Rekker et al. 2012).
However, a few studies have demonstrated that difference scores suffer from methodological
problems such as potential unreliability, systematic and spurious correlations with their
components (Allison 1990; Edwards and Parry 1993; Johns 1981). Thus, in this section, we
rerun our tests using the dependent variables decomposed into strengths and weaknesses in
CSR. We then examine which aspect of CSR performance ratings (i.e., strengths vs.
weaknesses) is actually affected by the presence of professor-directors. Untabulated results
show that strengths in CSR performance ratings are all positively and significantly associated
with the presence of professor-directors. However, none of the weaknesses in CSR
performance ratings show statistical significance with respect to the presence of
professor-directors, although the signs of their relations are all negative as expected. Taken together,
these results imply that our findings (using net difference scores) remain qualitatively the
same as when dependent variables are decomposed into strengths and weaknesses, and that
professor-directors are primarily associated with firm CSR strengths.
14 We were not able to find clear evidence that firm CSR performance ratings increase when a new
professor-director is added to the board.
15 We acknowledge some possible limitations in this section. To examine how CSR activities are associated with
20 Conclusions and Implications
Over the last decade, more than one third of S&P 1500 firms have appointed
professors as directors on their boards. The extant literature provides relatively mixed
evidence about the ethicality of professors. On one hand, professors are generally perceived
as having, or at least being expected to have, a relatively higher standard of professional
ethics (Baumgarten 1982; Bowman 2005; Charnov 1987; Chickering and Gamson 1999;
O’Connell 1998; Tierney 1997). On the other hand, business professors have been widely
criticized for not taking the initiatives in cultivating morality and setting an ethical example
for their students (Bennis and O’Toole 2005; Ghoshal 2005; Gonin 2007; Mitroff 2004;
Owen 2005). The relatively mixed findings have indeed stemmed our motivation to conduct
this study examining whether firms with academic faculty members on the board of directors
(i.e., professor-directors) exhibit different CSR performance ratings. Our results show a
significant and positive association between the presence of professor-directors and firm CSR
performance ratings. Further, allowing for heterogeneous characteristics of professors (e.g.,
White et al. 2013), we find that professor-directors affect firm CSR performance ratings
differently depending on their academic disciplines. That is, while specialized
professor-directors (i.e., engineering, science, and medicine) have a positive effect on firm CSR
performance ratings, the presence of business professor-directors (i.e., business, economics,
and law) does not appear to affect firm CSR performance ratings. This finding could be
interpreted in line with the prior literature documenting the wide criticism that business
professors have neglected the importance of corporate accountability in their education and
failed to train responsible managers. We also find that professor-directors who hold an
administrative position within their university exert less influence on firm CSR activities than
professor-directors without such position. Given that administrative professors hold
21
finding may suggest that administrative professors have fewer opportunities to exert their
ethical influence on a firm’s CSR activities. Our overall results hold even after a series of
robustness tests including issues related to endogeneity. Finally, we find that the change in
the number of professor-directors is significantly and positively associated with the current
level of firm CSR performance ratings and that professor-directors primarily affect and
improve the strengths of CSR performance ratings.
Our study contributes to the extant literature in several aspects. First, we document
that a less-investigated but important occupation (i.e., university professor) among outside
directors has an impact on CSR performance ratings. Considering that a significant portion of
firms appoint at least one academic on their board of directors, we believe that it is
worthwhile to investigate whether the presence of professor-directors affects corporate
outcomes. Second, this study assesses how a particular type of corporate governance
characteristic and its projected role link to a corporate activity, namely corporate social
responsibility. Last but certainly not least, we document how professors can potentially
contribute to society outside the classroom by showing the positive impact of
professor-directors on firm CSR performance ratings. This implies that CSR performance ratings, on
average, are likely to increase with professors appointed in corporate boardrooms.
As in all empirical investigations, ours is subject to some limitations. Our study
focuses on a sample of relatively large US firms (i.e., S&P 1500). Given that interest in
corporate social responsibility as well as the role and influence of professors may vary across
countries (owing to their differences in terms of culture, business regulations and politics),
the extent to which the results are generalizable outside the US setting cannot be determined.
Further, as mentioned earlier, the KLD database is limiting in that the provided rating scores
are relatively sticky and insensitive over time; hence, it was not desirable to take the change
22
Finally, we purely rely on archival data and quantitative analyses, and this does not
necessarily give a complete picture and understanding with regards to the process of how
professors may help firms make more socially responsible decisions. Accordingly, future
research that may consider more qualitative explorations in the form of interviews and/or
surveys would bring more insights on how professors on the board actually exert their moral
values and influences into firms in undertaking CSR activities. Therefore, extensions of our
23 Appendix
Variable definitions
Variable Description
Community Donations The sum of strengths minus the sum of weaknesses in Community dimension of
KLD.
Employee Benefits The sum of strengths minus the sum of weaknesses in Employee Relations
dimension of KLD.
Diversity Commitment The sum of strengths minus the sum of weaknesses in Diversity dimension of KLD.
CSR The sum of strengths minus the sum of weaknesses in three dimensions of KLD
(i.e., Community, Employee Relations, and Diversity).
PctPROF The percentage of professor-directors on the board.
DPROF 1 if a firm has professor-directors on the board, and 0 otherwise.
PctPROF (Business) The percentage of business professor-directors on the board. Business professor is a
professor of business, economics, or law.
PctPROF (Specialized) The percentage of specialized professor-directors on the board. Specialized
professor is a professor of engineering, science, or medicine.
PctPROF (Admin) The percentage of professor-directors who hold administrative positions at their
universities (e.g., President, Dean, Chair, Chancellor, Head, and Provost).
PctPROF (No Admin) The percentage of professor-directors who do not hold administrative positions at
their universities.
BoardSize The number of directors sitting on the board.
PctFemale The percentage of female directors on the board.
PctOutsider The percentage of independent directors on the board.
PctBusyIndepDir The percentage of independent directors who hold 3 or more other directorships in
the RiskMetrics universe firms.
IndDirBlock 1 if a firm has an independent director who holds more than 5% of shares
outstanding and 0 otherwise.
CEOChair 1 if a CEO is also the chairman of the board, and 0 otherwise.
Market-to-Book The ratio of market value to book value of assets, measured at the fiscal year end.
Log (Sales) Natural logarithm of sales, measured at the fiscal year end.
ROA Operating income before depreciation scaled by book value of total assets,
measured at the fiscal year end.
Leverage The book value of short-term and long-term debt divided by the book value of total
assets, measured at the fiscal year end.
FirmAge The number of years the firm has appeared in CRSP.
ReturnVolatility Standard deviation of a firm's previous 60-month stock returns.
InsiderOwnership The sum of shares held by top 5 executives divided by the total number of shares
outstanding.
InstitutionalOwnership The average percentage of shares held by institutions during the fiscal year.
CONNPROF The percentage of non-professor-directors on the board who sit on other boards on
24 References
Adams, R. B., & Ferreira, D. (2009). Women in the boardroom and their impact on governance and performance. Journal of Financial Economics,94(2), 291-309.
Allison, P. D. (1990). Change scores as dependent variables in regression analysis. Sociological Methodology, 20, 93-114.
Amato, L. H., & Amato, C. H. (2007). The effects of firm size and industry on corporate giving. Journal of Business Ethics,72(3), 229-241.
Anderson, R. C., Reeb, D. M., Upadhyay, A, & Zhao, W. (2011). The economics of director heterogeneity. Financial Management, 40(1), 5-38.
Audretsch, D. B., & Lehmann, E. (2006). Entrepreneurial access and absorption of knowledge spillovers: strategic board and managerial composition for competitive advantage. Journal of Small Business Management,44(2), 155-166.
Audretsch, D. B., & Stephan, P. E. (1996). Company-scientist locational links: the case of biotechnology. The American Economic Review, 86(3), 641-652.
Barnea, A., & Rubin, A. (2010). Corporate social responsibility as a conflict between shareholders. Journal of Business Ethics, 97(1), 71-86.
Baumgarten, E. (1982). Ethics in the academic profession: a Socratic view. The Journal of Higher Education, 53(3), 282-295.
Baysinger, B. D., Kosnik, R. D., & Turk, T. A. (1991). Effects of board and ownership structure on corporate R&D strategy. The Academy of Management Journal, 34(1), 205-214.
Bennis, W. G., & O’Toole, J. (2005). How business school lost their way. Harvard Business Review. Retrieved July 7, 2014, from http://hbr.org/2005/05/how-business-schools-lost-their-way/ar/1.
Bowman, R. F. (2005). Teacher as servant leader. The Clearing House: A Journal of Educational Strategies, Issues and Ideas, 78(6), 257-260.
Charnov, B. H. (1987). The academician as good citizen. P.3-20 in Payne, S. L., & Charnov, B. H. (eds.), Ethical Dilemmas for Academic Professionals, Springfield, IL: Charles C. Thomas.
Chen, J. C., Patten, D. M., & Roberts, R. W. (2008). Corporate charitable contributions: a corporate social performance or legitimacy strategy? Journal of Business Ethics,82(1), 131-144.
25
Cohen, L., Frazzini, A., & Malloy, C. J. (2012). Hiring cheerleaders: board appointments of “independent” directors. Management Science, 58(6), 1039-1058.
Duchin, R., Matsusaka, J. G., & Ozbas, O. (2010). When are outside directors effective? Journal of Financial Economics, 96(2), 195-214.
Edwards, J. R., & Parry, M. E. (1993). On the use of polynomial regression equations as an alternative to difference scores in organizational research. The Academy of Management Journal, 36(6), 1577-1613.
Fich, E. M. (2005). Are some outsider directors better than others? Evidence from director appointments by Fortune 1000 firms. The Journal of Business,78(5), 1943-1972.
Francis, B., Hasan, I., & Wu, Q. (2014). Professors in the boardroom and their impact on corporate governance and firm performance. Financial Management, Forthcoming.
Ghoshal, S. (2005). Bad management theories are destroying good management practices. Academy of Management Learning & Education, 4(1), 75-91.
Gonin, M. (2007). Business research, self-fulfilling prophecy, and the inherent responsibility of scholars. Journal of Academic Ethics, 5(1), 33-58.
Güner, A. B., Malmendier, U., & Tate, G. (2008). Financial expertise of directors. Journal of Financial Economics, 88(2), 323-354.
Hill, C. W. L., & Snell, S. A. (1988). External control, corporate strategy, and firm
performance in research-intensive industries. Strategic Management Journal, 9(6), 577-590.
Hillman, A. J., Cannella, A. A., & Paetzold, R. L. (2000). The resource dependence role of corporate directors: strategic adaptation of board composition in response to
environmental change. Journal of Management Studies,37(2), 235-256.
Hillman, A. J., Keim, G. D., & Luce, R. A. (2001). Board composition and stakeholder performance: do stakeholder directors make a difference? Business & Society, 40(3), 295-314.
Jiang, B., Murphy, P. J. (2007). Do business school professors make good executive managers? Academy of Management Perspectives,21(3), 29-50.
Johns, G. (1981). Difference score measures of organizational behavior variables: a critique. Organizational Behavior and Human Performance, 27(3), 443-463.
LaFond, R., & Watts, R. L. (2008). The information role of conservatism. The Accounting Review, 83(2), 447-478.
26
Mesch, D. J., Brown, M. S., Moore, Z. I., & Hayat, A. D. (2011). Gender differences in charitable giving. International Journal of Nonprofit and Voluntary Sector Marketing, 16(4), 342-355.
Mitroff, I. (2004). An open letter to the deans and the faculties of American business schools. Journal of Business Ethics, 54(2), 185-189.
O’Connell, D. M. (1998). From the universities to the marketplace: the business ethics journey. Journal of Business Ethics, 17(15), 1617-1622.
Oh, W. Y., Chang, Y. K., & Martynov, A. (2011). The effect of ownership structure on corporate social responsibility: empirical evidence from Korea. Journal of Business Ethics,104(2), 283-297.
Owen, D. (2005). CSR after Enron: a role for the academic accounting profession? European Accounting Review,14(2), 395-404.
Petersen, M. A. (2009). Estimating standard errors in finance panel data sets: comparing approaches. Review of Financial Studies,22(1), 435-480.
Rekker, S. A. C., Benson, K. L., & Faff, R. W. (2012). Corporate social responsibility and CEO compensation revisited: disaggregation, market stress and gender do matter. Working Paper, University of Queensland.
Roy Morgan Research. (2013). Roy Morgan Image of Professions Survey 2013 Nurses still Most Highly Regarded – Closely followed by Doctors & Pharmacists. Retrieved September 1, 2014, from http://www.roymorgan.com/findings/image-of-professions-2013-201305020534.
Tierney, W. G. (1997). Organizational socialization in higher education. The Journal of Higher Education, 68(1), 1-16.
Valentine, S., & Fleishman, G. (2008). Professional ethical standards, corporate social responsibility, and the perceived role of ethics and social responsibility. Journal of Business Ethics, 82(3), 657-666.
Wang, J., & Coffey, B. S. (1992). Board composition and corporate philanthropy. Journal of Business Ethics, 11(10), 771-778.
White, J. T., Woidtke, T., Black, H. A., & Schweitzer, R. L. (2013). Appointments of academic directors. Journal of Corporate Finance, Forthcoming.
27 Figure 1
[image:30.595.72.470.167.423.2]Yearly distributions of professor-directors at S&P 1500 firms by academic disciplines and administrative positions
Figure 1-A
[image:30.595.72.472.491.748.2]Number of professor-directors by academic disciplines
Figure 1-B
28 Table 1
Distributions of sample firms by year and industry
Panel A: Distribution of sample firms by year
Year # of firms
# of firms with at least one professor
# of firms with multiple professors
% of firms with at least one
professor
Mean % of professors on a
board, conditional on the
professor presence
2003 1,029 428 97 41.59% 13.16%
2004 1,109 449 99 40.49% 13.18%
2005 1,023 425 102 41.54% 13.29%
2006 1,053 420 100 39.89% 13.16%
2007 1,117 428 106 38.32% 13.54%
2008 1,213 465 130 38.34% 13.69%
2009 1,259 466 131 37.01% 13.63%
2010 1,243 447 109 35.96% 13.38%
2011 1,251 437 107 34.93% 13.28%
2003-2011 10,297 3,965 981 38.51% 13.37%
Panel B: Distribution of sample firms by Fama-French 12 industry classification
Industry # of firm-years
# of firm-years with at least one professor
% of firm-years with at least one professor, among
all firm-years in the same industry
Consumer NonDurables: Food, Tobacco, Textiles, Apparel, Leather, and Toys
629 254 40.38%
Consumer Durables: Cars, TVs, Furniture, and Household Appliances
237 48 20.25%
Manufacturing: Machinery, Trucks, Planes, Furnitures, and Papers
1,362 480 35.24%
Energies: Oil, Gas, Coal Extraction, and Related Products
427 124 29.04%
Chemicals and Allied Products 355 160 45.07%
Business Equipment: Computers, Software, and Electronic Equipment
1,847 610 33.03%
Telephone and Television Transmission 157 71 45.22%
Utilities 607 292 48.11%
Shops: Wholesale, Retail, and Some Services (Laundries, Repair Shops)
1,252 422 33.71%
Healthcare, Medical Equipment, and Drugs 859 479 55.76%
Finance: Banking, Insurance, Real Estate, and Trading 1,393 618 44.37%
Others: Mines, Transportation, Hotels, Business Services, and Entertainment
1,172 407 34.73%
Total 10,297 3,965 38.51%
29 Table 2
Summary statistics
Panel A:Summary statistics
Variable Mean Std Dev Minimum Median Maximum
CSR performance
Community Donations 0.116 0.615 -2 0 5
Employee Benefits -0.150 0.933 -4 0 5
Diversity Commitment 0.364 1.526 -3 0 7
CSR 0.363 2.578 -8 0 18
Board characteristics
PctPROF 0.051 0.074 0 0 0.286
DPROF 0.385 0.487 0 0 1
BoardSize 9.442 2.378 5 9 17
PctFemale 0.114 0.095 0 0.111 0.375
PctOutsider 0.754 0.127 0.364 0.778 0.923
PctBusyIndepDir 0.035 0.077 0 0 0.375
IndDirBlock 0.034 0.181 0 0 1
CEOChair 0.576 0.494 0 1 1
Firm characteristics
Market-to-Book 2.651 2.253 0.496 1.988 15.033
Log (Sales) 7.602 1.483 4.585 7.462 11.423
ROA 0.131 0.083 -0.079 0.125 0.389
Leverage 0.199 0.158 0 0.189 0.637
FirmAge 27.2 19.3 3 21 84
ReturnVolatility 0.111 0.047 0.041 0.102 0.278
InsiderOwnership 0.026 0.056 0.00002 0.007 0.341
InstitutionalOwnership 0.785 0.161 0.320 0.812 1
30 Table 2
Summary statistics (continued)
Panel B: Comparison of firms with professor-directors to those without
Variable
Firm-years with professor-directors
Firm-years without
professor-directors Difference (N=3,965) (N=6,332)
Mean Median Mean Median t-statistic z-statistic
Community Donations 0.179 0 0.076 0 (7.79)*** (7.32)*** Employee Benefits -0.098 0 -0.183 0 (4.35)*** (3.61)*** Diversity Commitment 0.739 0 0.129 0 (19.36)*** (19.09)***
CSR 0.864 0 0.049 0 (14.86)*** (14.00)***
BoardSize 10.03 10 9.07 9 (19.85)*** (20.23)***
PctFemale 0.134 0.125 0.101 0.100 (17.91)*** (17.73)*** PctOutsider 0.771 0.800 0.744 0.750 (10.41)*** (10.37)***
PctBusyIndepDir 0.041 0 0.032 0 (5.62)*** (7.09)***
IndDirBlock 0.025 0 0.040 0 (-4.13)*** (-3.92)***
CEOChair 0.606 1 0.557 1 (4.95)*** (4.92)***
Market-to-Book 2.657 1.995 2.647 1.983 (0.22) (-0.31) Log (Sales) 7.962 7.831 7.377 7.222 (19.55)*** (19.64)***
ROA 0.129 0.123 0.132 0.126 (-1.50) (-1.65)*
Leverage 0.205 0.195 0.196 0.185 (2.78)*** (3.48)***
FirmAge 30.9 25 24.9 19 (14.89)*** (14.40)***
ReturnVolatility 0.105 0.096 0.114 0.106 (-9.46)*** (-10.85)*** InsiderOwnership 0.023 0.005 0.028 0.008 (-4.58)*** (-11.39)*** InstitutionalOwnership 0.774 0.799 0.791 0.822 (-5.25)*** (-5.79)***
31 Table 3
OLS regression analysis - CSR performance and professor-directors on the board
Independent variable
Dependent variable
Community Donations Employee Benefits Diversity Commitment CSR
(1) (2) (3) (4) (5) (6) (7) (8)
DPROF 0.034 0.079** 0.105** 0.227**
(1.521) (2.208) (2.324) (2.548)
PctPROF 0.375** 0.635** 0.700** 1.911***
(2.448) (2.544) (2.355) (3.074)
BoardSize 0.014** 0.015** -0.003 -0.001 0.042*** 0.045*** 0.056** 0.062***
(2.252) (2.405) (-0.362) (-0.111) (3.482) (3.739) (2.474) (2.746)
PctFemale 0.453*** 0.436*** 0.492** 0.473** 5.427*** 5.413*** 6.963*** 6.900***
(3.783) (3.646) (2.349) (2.288) (18.933) (18.884) (12.563) (12.536)
PctOutsider 0.151* 0.148* -0.168 -0.169 0.435** 0.438*** 0.421 0.417
(1.818) (1.784) (-1.217) (-1.222) (2.543) (2.553) (1.341) (1.323)
PctBusyIndepDir 0.215 0.225 -0.286 -0.271 0.088 0.102 -0.659 -0.612
(1.316) (1.380) (-1.398) (-1.328) (0.322) (0.374) (-1.273) (-1.183)
IndDirBlock -0.025 -0.024 -0.129* -0.129* -0.036 -0.037 -0.242 -0.240
(-0.621) (-0.594) (-1.684) (-1.671) (-0.311) (-0.318) (-1.179) (-1.163)
CEOChair 0.010 0.011 -0.068** -0.067** 0.032 0.034 -0.018 -0.015
(0.558) (0.589) (-2.171) (-2.142) (0.839) (0.869) (-0.235) (-0.196)
Market-to-Book 0.012** 0.012** 0.015* 0.016* 0.057*** 0.057*** 0.109*** 0.109***
(2.056) (2.067) (1.952) (1.956) (4.339) (4.333) (4.539) (4.533)
Log (Sales) 0.096*** 0.095*** 0.029 0.028 0.401*** 0.401*** 0.590*** 0.587***
(6.596) (6.572) (1.490) (1.442) (16.070) (16.077) (10.761) (10.764)
ROA -0.105 -0.104 0.666** 0.668** -0.708** -0.707** -0.061 -0.057
(-0.771) (-0.765) (2.490) (2.499) (-2.346) (-2.343) (-0.098) (-0.092) Leverage -0.146** -0.140* -0.381*** -0.375*** -0.729*** -0.725*** -1.272*** -1.252***
(-2.028) (-1.951) (-2.996) (-2.950) (-4.681) (-4.659) (-4.230) (-4.169)
FirmAge -0.002** -0.002** -0.001 -0.001 0.003* 0.003* -0.003 -0.003
(-2.131) (-2.185) (-0.882) (-0.906) (1.735) (1.733) (-0.704) (-0.736)
ReturnVolatility -0.276 -0.282 -0.396 -0.401 1.830*** 1.829*** 0.352 0.333
(-1.214) (-1.245) (-1.057) (-1.070) (3.692) (3.687) (0.376) (0.355)
InsiderOwnership 0.079 0.075 -0.571** -0.572** -0.588 -0.584 -1.633** -1.639**
(0.524) (0.499) (-2.181) (-2.186) (-1.588) (-1.580) (-2.458) (-2.470)
32 (continued from the previous page)
InstitutionalOwnership -0.165** -0.162** -0.200* -0.194* -0.156 -0.149 -0.622** -0.605** (-1.992) (-1.963) (-1.718) (-1.672) (-0.959) (-0.915) (-2.017) (-1.966) Intercept -0.691*** -0.692*** -0.248 -0.261 -3.816*** -3.839*** -5.223*** -5.255***
(-5.104) (-5.158) (-1.076) (-1.130) (-8.768) (-8.857) (-9.776) (-9.848)
Year fixed-effects Yes Yes Yes Yes Yes Yes Yes Yes
Industry fixed-effects Yes Yes Yes Yes Yes Yes Yes Yes
Number of Obs. 10,297 10,297 10,297 10,297 10,297 10,297 10,297 10,297
Adjusted R2 0.154 0.155 0.104 0.104 0.469 0.469 0.321 0.322
33 Table 4
OLS regression analysis – CSR performance and professor-directors from different academic disciplines Independent variable Dependent variable Community Donations Employee Benefits Diversity
Commitment CSR
(1) (2) (3) (4)
PctPROF (Business) 0.081 0.594 0.488 1.162
(0.413) (1.642) (1.159) (1.544)
PctPROF (Specialized) 0.711** 0.933** 1.439*** 3.084***
(2.373) (2.230) (2.690) (3.380)
BoardSize 0.015** -0.001 0.045*** 0.060***
(2.403) (-0.084) (3.767) (3.140)
PctFemale 0.450*** 0.485** 5.424*** 6.359***
(3.769) (2.329) (18.902) (13.728)
PctOutsider 0.155* -0.164 0.445*** 0.436
(1.874) (-1.186) (2.599) (1.619)
PctBusyIndepDir 0.220 -0.273 0.101 0.048
(1.346) (-1.333) (0.371) (0.108)
IndDirBlock -0.024 -0.127* -0.034 -0.185
(-0.582) (-1.646) (-0.291) (-0.943)
CEOChair 0.011 -0.066** 0.035 -0.021
(0.598) (-2.114) (0.897) (-0.330)
Market-to-Book 0.011* 0.015* 0.056*** 0.082***
(1.934) (1.893) (4.217) (4.100)
Log (Sales) 0.095*** 0.028 0.400*** 0.522***
(6.571) (1.440) (16.046) (11.643)
ROA -0.097 0.670** -0.697** -0.125
(-0.709) (2.503) (-2.303) (-0.235)
Leverage -0.134* -0.367*** -0.708*** -1.208***
(-1.847) (-2.890) (-4.544) (-4.690)
FirmAge -0.002** -0.001 0.003* -0.000
(-2.109) (-0.864) (1.777) (-0.038)
ReturnVolatility -0.272 -0.399 1.835*** 1.164
(-1.201) (-1.063) (3.704) (1.472)
InsiderOwnership 0.101 -0.563** -0.554 -1.015*
(0.671) (-2.143) (-1.497) (-1.804) InstitutionalOwnership -0.159* -0.192* -0.144 -0.495* (-1.925) (-1.655) (-0.882) (-1.937)
Intercept -0.703*** -0.269 -3.850*** -4.821***
(-5.212) (-1.159) (-8.894) (-11.445)
Year fixed-effects Yes Yes Yes Yes
Industry fixed-effects Yes Yes Yes Yes
Number of Obs. 10,297 10,297 10,297 10,297
Adjusted R2 0.156 0.105 0.470 0.346