City, University of London Institutional Repository
Citation
: Basha, N., Kovacevic, A. ORCID: 0000-0002-8732-2242, Stosic, N. and Smith,
I. K. (2018). Effect of oil-injection on twin screw compressor performance. IOP Conference Series: Materials Science and Engineering, 425(1), 012009.. doi:10.1088/1757-899X/425/1/012009
This is the published version of the paper.
This version of the publication may differ from the final published
version.
Permanent repository link:
http://openaccess.city.ac.uk/22435/Link to published version
: http://dx.doi.org/10.1088/1757-899X/425/1/012009
Copyright and reuse:
City Research Online aims to make research
outputs of City, University of London available to a wider audience.
Copyright and Moral Rights remain with the author(s) and/or copyright
holders. URLs from City Research Online may be freely distributed and
linked to.
PAPER • OPEN ACCESS
Effect of oil-injection on twin screw compressor performance
To cite this article: N Basha et al 2018 IOP Conf. Ser.: Mater. Sci. Eng. 425 012009
Effect of oil-injection on twin screw compressor performance
N Basha, A Kovacevic, N Stosic, I Smith
Centre for Compressor Technology, City, University of London, London, UK
E-mail: nausheen.basha@city.ac.uk
Abstract. Oil-injection improves twin-screw compressor performance significantly and its overall effect depends on the working fluid mass flow rate, the shaft speed, the injection position and the injected oil temperature. However, the individual contribution of each of these variables to the machine performance is yet not fully researched. Therefore, tests have been carried out on an air compressor with a male rotor diameter of 98mm, with injection nozzle sizes of 2, 3 and 4mm and with a nozzle of multiple holes. Tests were carried out with discharge pressures of 6.5, 8.5, 10.5 and 12.5 bar and rotor shaft speeds of 3000, 4000 and 5000 RPM. The results from the tests were compared with performance estimates at the same operating conditions as measurements against the standard injection nozzle of 5mm diameter. It was found that there is an optimum quantity of oil injected to obtain the best performance.
1. Introduction
The effect of oil injection on screw compressor performance is dependent on the compressor tip speed, the injected fluid mass flow rate, temperature, viscosity, and the fineness of its atomisation and the position of the oil injection port. It is well known that, the compressor efficiency is improved by this means, but as shown by Deipenwisch and Kauder [1], an excess amount of oil leads to frictional and momentum losses that increase power consumption. Other investigators have carried out analytical studies on how each of these parameters affect performance.
In 1986, Singh and Bowman [1] developed a mathematical model to evaluate the effect of oil droplet size on compressor performance. They reported that a droplet of 1000 µm diameter reduces the specific power by 7% whereas a droplet of 100 µm diameter reduces the specific power by 8.3%. Although the authors state these results agreed with experimental data, the details were not reported. Stosic et al. (1988) [2] used a mathematical model to investigate the effect of parameters such as oil inlet temperature, oil to gas mass ratio, oil injection position and oil viscosity. The effect of outlet temperature was shown for 100 µm, 500 µm and 1000 µm diameter droplets. It was concluded that the oil temperature closely follows that of the gas and atomisation only has a slight effect on performance although they did not consider droplet diameters below 100 µm. The authors concluded that the oil mass flow and viscosity have a surprisingly small effect on specific power compared to the oil injection temperature and the position of the oil port. Thus, modifying the injection position in the test rig improved the specific power by 7% compared to that of the basic design [3][4]. They reported a comparison with experimental data for a single operating pressure when running at 2490 RPM. However, little was published to confirm these predictions.
a factor called the cooling effectiveness and studied it with nozzles of varying diameter in a cylindrical test section with the capability of generating a smallest droplet size of Sauter Mean Diameter (SMD) of 278 µm. The cooling effectiveness was introduced as a factor in a thermodynamic model, and by this means it was shown that raising the oil flow by 10% lowered the specific power by 0.2% and raising the cooling effectiveness by 10 points lowered the specific power by 0.05%. However, these results were not confirmed with experimental data. The cooling effectiveness was expressed as a function of temperatures which were different in the cylindrical test rig and the actual compressor as the heat transfer between the oil and gas is dependent upon the oil residence time within the chamber.
In recent years, the effect of oil injection has been studied in positive displacement rotary vane machines both experimentally and mathematically. The optimum value of liquid to gas mass ratio was estimated mathematically and the droplet diameter was estimated from experimental data. As a result, an advanced orifice was developed from consideration of these parameters [7]. A comparison was made between a conventional and advanced orifice in a rotary vane compressor at design conditions which indicated that the specific power was reduced by 2.4% by means of the advanced orifice [8]. In addition, pressure swirl atomisers were tested in the vane machine resulting in a saving of 0.5kW/(m3/min) in specific power [9].
Most of the screw compressor experimental studies did not include the variation in oil related parameters over a range of discharge pressures and rotor speeds, although these were considered, to a good extent, in the mathematical models.
In order to gain a better understanding of the effects of oil injection on specific power over a range of operating conditions, the authors carried out tests on an oil-injected air compressor of 98mm male rotor diameter using oil injection nozzles of 2mm, 3mm and 4mm diameter at discharge pressures of, 6.5 bar, 8.5 bar, 10.5 bar and 12.5 bar and male rotor rotational speeds of 3000 RPM, 4000 RPM, and 5000 RPM. In addition to this, a multiple holes nozzle with an equivalent cross sectional area of a 4 mm diameter was used. The test results obtained were normalised with the existing design nozzle of 5 mm diameter and then compared, in order to gain a better understanding of the significance of each variable nozzle.
2. Case Study
2.1. Compressor Specification
The reference oil-injected compressor has a radial suction port and an axial discharge port with oil injection port on the female side of the rotor. The lobe combination is 4-5 and blow-hole area is relatively large. The rotor centre distance is 67.5 mm, the outer diameter of the male rotor is 98.8 mm and the outer diameter of the female rotor is 77.8 mm. The length of the rotors is 153.140 mm with the male rotor wrap angle of 306.647° and volume index of 4.6.
2.2. Experimentation
Figure 1. Air test rig.
Figure 2. Cross sectional view of compressor with inserts.
Figure 3. Atomiser or Insert with equivalent cross sectional area of 4 mm (25 x 0.8 mm).
[image:5.595.71.522.124.314.2]Table 1. List of installed instruments.
MEASURED INSTRUMENT SPECIFICATIONS
Compressor Speed, N Shaft Encoder
(BHG 16.25W.3600-B2-5)
360 pulses per revolution
Accuracy= 2.7%
Compressor Torque, Tq TRP-500 torque meter
(strain gauge transducer)
max capacity: 500Nm, Calibration level: 335Nm Range = 0 - 6000 rpm, Supply volt=10v dc,
Accuracy= 0.25 % of max capacity
inlet pressure, P1 PDCR 110/w -pressure
Transducer
Operating range = 3.5bar(abs)
Excite voltage=10V dc, Accuracy =0.6%,
inlet temperature, T1 Platinum Resistance Thermometer Range= -750C to 3500C, Accuracy= ±0.50C
outlet pressure, P2 PDCR 922-pressure transducer Operating range =15 bar (abs)
Excite voltage=10V dc, Output voltage= 100 mV
Accuracy =0.6%
outlet temperature, T2 Platinum Resistance Thermometer Range= -750C to 3500C, Accuracy= ±0.50C
orifice plate inlet press, Pop
PDCR 922-pressure transducer Operating range =15 bar (abs)
Excite voltage=10V dc, Output voltage= 100 mV
orifice plate inlet Temp, Top
Platinum Resistance Thermometer Range= -750C to 3500C, Accuracy= ±0.50C
Orifice plate differential pressure, dp
PDCR 2120- pressure
Transducer
Pressure diff= 0.35 bar, Excitation Voltage=10V dc,
Accuracy= 0.6%,
Oil Temp @ inlet of
the cooler– Toil,IN
K- type thermocouple
(based on Ni/Cr-Ni/Al alloy)
Range= -2000C to 13000C, Accuracy= ± 10C
sensitivity = 41 µV/°C
Oil Temp @ outlet of
the cooler–Toil,OUT
Platinum Resistance Thermometer Range= -750C to 3500C, Accuracy= ±0.50C
Water Temp @ inlet & outlet
of the cooler– Tw,IN & Tw, OUT
K- type thermocouple
(based on Ni/Cr-Ni/Al alloy)
Range= -2000C to 13000C, Accuracy= ± 2.20C
sensitivity = 41 µV/°C
The performance of the compressor is measured in terms of power (kW), flow rate (m3/min) and specific power (kW/m3/min). The flow is measured using an orifice plate while the power is calculated based on the measurements of torque and speed according to BS1042 [10].
𝑃𝑃𝑃𝑃𝑃𝑃𝑃𝑃𝑃𝑃 =𝑇𝑇𝑇𝑇 × 𝑁𝑁60 (1)
𝐴𝐴𝐴𝐴 = 𝐶𝐶𝑑𝑑𝑃𝑃𝑒𝑒𝐷𝐷𝑖𝑖2�2𝑑𝑑𝑑𝑑𝜌𝜌0 4�1 − 𝛽𝛽4
(2)
In the above equation 2, Cd is the discharge coefficient, e is the expansion factor, Di is the orifice
diameter (m) and ρ (kg/m3) is the density of the fluid. β is the ratio of orifice diameter (D
i) to pipe
𝛽𝛽 =𝐷𝐷𝑖𝑖𝐷𝐷 (3)
Cd, and e can be further defined as (equation 4 and equation 6):
𝐶𝐶𝑑𝑑= 0.5959 + 0.0312𝛽𝛽2.1− 0.1840𝛽𝛽8+ 0.0029𝛽𝛽2.5�10 6 𝑅𝑅𝑃𝑃 �
0.75
+0.09𝐿𝐿(1 − 𝛽𝛽1𝛽𝛽4)4
− 0.033𝐿𝐿1(12)𝛽𝛽3
(4)
Reynolds number (Re) in the above equation can be written as,
𝑅𝑅𝑃𝑃 = 𝑒𝑒𝐷𝐷4𝐴𝐴𝐴𝐴 𝑖𝑖𝜇𝜇
(5)
In the above equation, the viscosity of the fluid μ in kg/m-s is obtained through Sutherland viscosity law which is dependent upon the orifice inlet temperature (Top) in K [11].
µ = 1.458 × 10⁻⁶ 𝑇𝑇𝑜𝑜𝑜𝑜1.5 𝑇𝑇𝑜𝑜𝑜𝑜+ 110.4
(6)
Note that an iterative calculation is needed to get a value for Cd (equation 4), because the upstream
velocity needed for Re isn't known until Cd is known.
𝑃𝑃 = 1 − 0.41 + 0.35𝛽𝛽4( 𝑑𝑑𝑑𝑑 1.4𝑃𝑃𝑜𝑜𝑜𝑜)
(7)
Lastly, the specific power (SP) in kW/m3/min can be written as,
𝑆𝑆𝑃𝑃 = 𝑃𝑃𝑃𝑃𝑃𝑃𝑃𝑃𝑃𝑃 𝐴𝐴𝐴𝐴
(8)
Here, power is in kW and flow rate is in m3/min. Finally, the mass flow of oil can be estimated as:
𝑚𝑚𝑜𝑜𝑜𝑜𝑜𝑜̇ =(𝑃𝑃𝑃𝑃𝑃𝑃𝑃𝑃𝑃𝑃 − 𝑚𝑚𝑎𝑎𝑜𝑜𝑎𝑎𝐶𝐶𝑜𝑜 𝑎𝑎𝑜𝑜𝑎𝑎(𝑇𝑇2− 𝑇𝑇1))
̇
𝐶𝐶𝑜𝑜 𝑜𝑜𝑖𝑖𝑜𝑜(𝑇𝑇2− 𝑇𝑇𝑜𝑜𝑖𝑖𝑜𝑜,𝐼𝐼𝐼𝐼)
(9)
T2 is the discharge temperature, T1 is the suction temperature and Toil,IN is the oil temperature. When
the oil flow is expressed in lt/min, the density of oil for conversion is taken as 860 kg/m3.
The instruments used for the experiments have an error percentage and this error is reflected in the macro properties like air flow, power and specific power. The error propagation for air flow measured through orifice plate, power, specific power and oil flow uncertainties are added in a quadrature [12] considering their dependent variables as shown in equation 10, 11, 12 and 13. Error percentage for β value of 0.198 is 4% and Cd is 0.2% [13]. These give an error propagation in air flow (δAF) measurement
of 4.7%. Similarly, error propagation for power is 2.7%, specific power is 5.5% and oil flow (OF) is 12.77%
𝛿𝛿𝐴𝐴𝐴𝐴 = �2(𝛿𝛿𝑑𝑑𝑑𝑑)2+ 2 ��𝛿𝛿𝑃𝑃𝑜𝑜𝑜𝑜�2+ �𝛿𝛿𝑇𝑇𝑜𝑜𝑜𝑜�2� + (𝛿𝛿𝛽𝛽)2+ (𝛿𝛿𝐶𝐶𝑑𝑑)2 (11)
𝛿𝛿𝑆𝑆𝑑𝑑 = �(𝛿𝛿𝐴𝐴𝐴𝐴)2+ (𝛿𝛿𝑃𝑃𝑃𝑃𝑃𝑃𝑃𝑃𝑃𝑃)2 (12)
𝛿𝛿𝛿𝛿𝐴𝐴 = �(𝛿𝛿𝑃𝑃𝑃𝑃𝑃𝑃𝑃𝑃𝑃𝑃)2+ (𝛿𝛿𝐴𝐴𝐴𝐴)2+ (𝛿𝛿𝑃𝑃1)2+ 2((𝛿𝛿𝑇𝑇1)2+ (𝛿𝛿𝑇𝑇2)2) + �𝛿𝛿𝑇𝑇𝑜𝑜𝑖𝑖𝑜𝑜,𝐼𝐼𝐼𝐼�2 (13)
Table 2. Compressor testing conditions for inserts. Discharge Pressure
(bar)/Speed (RPM)
6.5 8.5 10.5 12.5
3000 Except 2mm All inserts All inserts All inserts
4000 Except 2mm All inserts All inserts All inserts
5000 Except 2mm All inserts All inserts All inserts
All the inserts used for the tests are mentioned in Table 2. The inserts of 2mm could not be tested at 6.5 bar because of the reduced oil flow and the compressor discharge temperature exceeding limits of 100°C. Considering safety regulations, the test rig cannot be operated beyond this temperature.
The inlet temperatures for oil and air should be ideally kept constant. However, there were limitations with the test rig due to which the inlet temperatures of air or oil could not be kept constant. Hence, ‘Temperature Difference Ratio’ (TDR) is introduced. TDR is used to quantify the effect of oil acting as a coolant by looking at the compressor discharge temperature (T2) in relation with the inlet temperature
(T1). Temperature difference ratio is the ratio of temperature difference due to air with temperature
difference due to injection of oil.
𝑇𝑇𝑃𝑃𝑚𝑚𝑑𝑑𝑃𝑃𝑃𝑃𝑇𝑇𝑇𝑇𝑇𝑇𝑃𝑃𝑃𝑃 𝑑𝑑𝑑𝑑𝑑𝑑𝑑𝑑𝑃𝑃𝑃𝑃𝑃𝑃𝑑𝑑𝑑𝑑𝑃𝑃 𝑃𝑃𝑇𝑇𝑇𝑇𝑑𝑑𝑃𝑃 = 𝑇𝑇2− 𝑇𝑇1 𝑇𝑇2− 𝑇𝑇𝑜𝑜𝑖𝑖𝑜𝑜,𝐼𝐼𝐼𝐼
(14)
3. Results and Discussion
3.1. Performance measurements at various operating conditions
[image:8.595.71.529.647.745.2]Oil mass flow in the compressor can be divided into the main and auxiliary injection. The main injection comes through the direct injection into the chamber and the auxiliary injection of oil seeps through the bearings. By adding in the different size of nozzles, effectively changes the main injection flow rate but the auxiliary oil flow remains the same. The actual prototype design considers oil nozzle diameter of 5mm. The performance values along with the temperatures and volume flow of oil obtained for the design conditions are tabulated in Table 3, Table 4 and Table 5.
Table 3. Performance values with 5mm oil injection nozzle.
Speed (RPM)
Air Flow Power Specific Power
m3/min kW (kW/m3/min)
Discharge Pressure (bar) Discharge Pressure (bar) Discharge Pressure (bar)
6.5 8.5 10.5 12.5 6.5 8.5 10.5 12.5 6.5 8.5 10.5 12.5
3000 1.76 1.77 1.79 1.79 13.14 16.66 18.58 20.19 7.46 9.42 10.36 11.27
4000 2.44 2.42 2.41 2.40 18.25 21.62 23.68 25.48 7.49 8.93 9.83 10.60
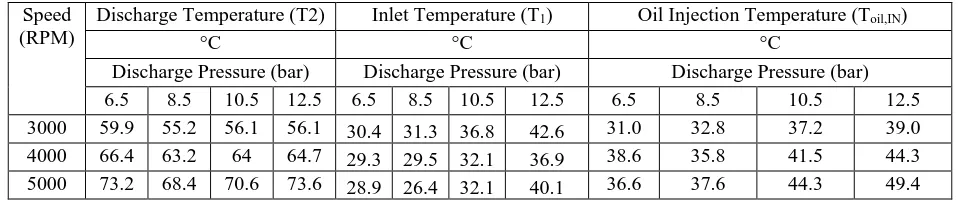
Table 4. Discharge, inlet and oil injection temperature with 5mm oil injection nozzle. Speed
(RPM)
Discharge Temperature (T2) Inlet Temperature (T1) Oil Injection Temperature (Toil,IN)
°C °C °C
Discharge Pressure (bar) Discharge Pressure (bar) Discharge Pressure (bar)
6.5 8.5 10.5 12.5 6.5 8.5 10.5 12.5 6.5 8.5 10.5 12.5
3000 59.9 55.2 56.1 56.1 30.4 31.3 36.8 42.6 31.0 32.8 37.2 39.0
4000 66.4 63.2 64 64.7 29.3 29.5 32.1 36.9 38.6 35.8 41.5 44.3
[image:9.595.200.396.269.370.2]5000 73.2 68.4 70.6 73.6 28.9 26.4 32.1 40.1 36.6 37.6 44.3 49.4
Table 5. Oil flow with 5mm oil injection nozzle. Speed
(RPM)
Oil Flow lt/min
Discharge Pressure (bar)
6.5 8.5 10.5 12.5
3000 13.86 22.83 30.59 37.52
4000 19.35 23.78 32.12 38.31
5000 17.81 25.55 33.36 39.63
The main oil flow is varied with orifices of 2mm, 3mm, 4mm and the resulting performance values of power, air flow, specific power, oil flow are normalised according to the values listed in Table 3 and Table 4. For example, the power for 2mm nozzle at 8.5bar- 3000RPM is divided by power for 5mm nozzle at 8.5bar-3000 RPM. Similarly, the air flow for 3mm nozzle at 10.5bar- 5000RPM is divided by the air flow for the 5mm nozzle at 10.5bar-5000RPM. In short, all the performance values for various nozzles are normalised with the values of 5mm nozzle with relevant discharge pressures and male rotor shaft speeds. These normalised values for various nozzles are plotted in the figures below. ‘4.1mm’ nozzle diameter in the below plots represents the nozzle of type describes in Figure 3, which has an equivalent cross sectional area of 4mm with multiple holes.
Figure 4. Normalised power with nozzle diameter at 3000 RPM.
Figure 5. Normalised flow with nozzle diameter at 3000 RPM.
Figure 6. Normalised oil flow with nozzle diameter at 3000 RPM.
[image:10.595.311.517.117.296.2]Figure 7. Temperature difference ratio with nozzle diameter at 3000 RPM.
Figure 8. Normalised specific power with nozzle diameter at 3000 RPM. 0.8 0.9 1 1.1 1.2 1.3
2 3 4 4.1 5
No
rm
. P
o
wer
Nozzle Diameter (mm) 3000 RPM
6.5 bar 8.5 bar
10.5 bar 12.5 bar
0.8 0.9 1 1.1 1.2 1.3
2 3 4 4.1 5
N
o
rm
. Flo
w
Nozzle Diameter (mm) 3000 RPM
6.5 bar 8.5 bar
10.5 bar 12.5 bar
0.0 0.2 0.4 0.6 0.8 1.0 1.2
2 3 4 4.1 5
N o rm . O il Flo w
Nozzle Diameter (mm) 3000 RPM 6.5bar 8.5bar 10.5bar 12.5bar 0 0.2 0.4 0.6 0.8 1 1.2 1.4 1.6
2 3 4 4.1 5
T
DR
Nozzle Diameter (mm) 3000 RPM
6.5 bar 8.5 bar
10.5 bar 12.5 bar
0.8 0.9 1 1.1 1.2 1.3
2 3 4 4.1 5
No rm . S p eci fi c P o wer
Nozzle Diameter (mm) 3000 RPM
[image:10.595.307.514.344.499.2] [image:10.595.123.503.585.733.2]Figure 9. Normalised power with nozzle diameter at 4000 RPM.
Figure 10. Normalised flow with nozzle diameter at 4000 RPM.
Figure 11. Normalised oil flow with nozzle diameter at 4000 RPM.
[image:11.595.81.284.121.264.2]Figure 12. Temperature difference ratio with nozzle diameter at 4000 RPM.
Figure 13. Normalised power with nozzle diameter at 4000 RPM. 0.8 0.9 1 1.1 1.2 1.3
2 3 4 4.1 5
No
rm
. P
o
wer
Nozzle Diameter (mm) 4000 RPM
6.5 bar 8.5 bar
10.5 bar 12.5 bar
0.8 0.9 1 1.1 1.2 1.3
2 3 4 4.1 5
N
o
rm
. Flo
w
Nozzle Diameter (mm) 4000 RPM
6.5 bar 8.5 bar
10.5 bar 12.5 bar
0.0 0.2 0.4 0.6 0.8 1.0 1.2
2 3 4 4.1 5
N o rm . O il Flo w
Nozzle Diameter (mm) 4000 RPM 6.5bar 8.5bar 10.5bar 12.5bar 0 0.2 0.4 0.6 0.8 1 1.2 1.4 1.6
2 3 4 4.1 5
T
DR
Nozzle Diameter (mm) 4000 RPM
6.5 bar 8.5 bar
10.5 bar 12.5 bar
0.8 0.9 1 1.1 1.2 1.3
2 3 4 4.1 5
No rm . S p eci fi c P o wer
Nozzle Diameter (mm) 4000 RPM
[image:11.595.308.512.333.490.2] [image:11.595.104.493.557.704.2]Figure 14. Normalised power with nozzle diameter at 5000 RPM.
Figure 15. Normalised flow with nozzle diameter at 5000 RPM.
[image:12.595.299.519.121.268.2]Figure 16. Normalised oil flow with nozzle diameter at 5000 RPM.
[image:12.595.307.512.326.477.2]Figure 17. Temperature difference ratio with nozzle diameter at 5000 RPM.
Figure 18. Normalised specific power with nozzle diameter at 5000 RPM.
Additionally, comparing the normalised power values for the male rotor shaft speeds of 3000 RPM, 4000 RPM and 5000 RPM, it can be observed that the overall normalised power consumed at 5000 RPM
0.8 0.9 1 1.1 1.2 1.3
2 3 4 4.1 5
No
rm
. P
o
wer
Nozzle Diameter (mm) 5000 RPM
6.5 bar 8.5 bar
10.5 bar 12.5 bar
0.8 0.9 1 1.1 1.2 1.3
2 3 4 4.1 5
N
o
rm
. Flo
w
Nozzle Diameter (mm) 5000 RPM
6.5 bar 8.5 bar
10.5 bar 12.5 bar
0.0 0.2 0.4 0.6 0.8 1.0 1.2
2 3 4 4.1 5
N o rm . O il Flo w
Nozzle Diameter (mm) 5000 RPM 6.5bar 8.5bar 10.5bar 12.5bar 0 0.2 0.4 0.6 0.8 1 1.2 1.4 1.6
2 3 4 4.1 5
T
DR
Nozzle Diameter (mm) 5000 RPM
6.5 bar 8.5 bar
10.5 bar 12.5 bar
0.8 0.9 1 1.1 1.2 1.3
2 3 4 4.1 5
No rm . S p eci fi c P o wer
Nozzle Diameter (mm) 5000 RPM
[image:12.595.112.522.560.691.2]is lower than at 4000 RPM, while the normalised power at 4000 RPM itself is lower compared to 3000 RPM for the same discharge pressures. The main reason for this is that at higher speeds there are reduced leakages. Another reason might be that the shearing of oil films at higher rotational speeds can lead to formation of annular mist flow within the compression chamber. This annular mist flow has an increased oil droplets of lower mean diameters enhancing heat transfer surface area [15]. Although annular mist flow reduces the droplet diameter sizes which promotes the heat transfer, but it also reduces the droplet residence time within the compression chamber which in turn effects the time required for heat transfer. Nevertheless, in these experiments the effect of annular mist flow related to better heat transfer might weigh over the droplet residence as normalised power consumption decreases with increasing male rotor shaft speed. Altogether, normalised power decreases with the increasing rotational speeds for the same discharge pressures.
Air flow rate at constant speed and pressure in general increases with the increase in oil flow as the increased amount of oil improves sealing (Figure 5, Figure 10 and Figure 15). Also, air flow rate achieved at lower pressures is slightly higher compared to the higher pressures, as at higher pressures the leakage flow rate is higher. Finally, the higher TDR indicates the presence of more oil in the compression chamber and higher cooling effect. Overall, TDR increases with the increase in the oil flow with increasing nozzle diameters (Figure 7, Figure 12 and Figure 17). It can be noticed here that the temperature difference ratio increases with the increase in speed from 3000RPM to 5000RPM (3000RPM- 0.5, 4000RPM- 0.8 and 5000RPM- 1.0). Increasing male rotor shaft speed leads to the higher air flow rate which led to shear of oil films and hence increased surface area of oil particles resulting in a better heat transfer between oil and gas.
3.2. Best nozzle diameter for tested operating condition
For the performed experiments, the atomiser nozzle with equivalent cross-sectional area of 4mm diameter nozzle (Figure 3) achieves better atomisation and cooling within the compression chamber. Figure 19 shows the specific power for 4mm atomiser nozzle compared with the 4mm circular nozzle with the average improvement in specific power of 1.15%. Figure 6, Figure 11 and Figure 16, show that for almost all male rotor shaft speeds and discharge pressures the oil flow decreases for the multi hole ‘4.1’ nozzle compared to 4 mm circular nozzle. As a result TDR slightly decreases with ‘4.1’ nozzle indicating higher temperatures within the compression chamber compared to that of the injection with single diameter nozzle of 4mm.
It is believed that at the lower pressure of 8.5 bar, the slight reduction in power is because of the lower amount of oil flow with 4.1 mm insert. Though lower TDR is observed in that case which indicates the higher temperatures in compression chamber, but the extra amount of oil contributed to the increased the frictional losses. On other hand, at higher pressures (10.5 and 12.5 bar) it is expected that the lower oil flow with 4.1mm insert will reduce the performance. Nevertheless, a counterintuitive trend was observed due to the overpowering oil losses or reduced oil droplet residence time leading to slight improvement in compressor power or specific power.
Figure 19. Comparison of specific power % of 4 mm atomiser nozzle (‘4.1’) against 4 mm single hole nozzle.
[image:14.595.69.528.412.562.2]Also, all specific powers in Figure 8, Figure 13 and Figure 18 at various discharge pressures and male rotor shaft speeds are summarised to reveal the best nozzle diameter that will achieve least power and specific power. The summarised data is shown in Table 6 and Table 7 along with reduction in oil flow required to achieve improvements in performance.
Table 6. Best nozzle diameter at tested operating conditions resulting in least power consumption. Shaft
Speed (RPM)
Discharge Pressure
6.5 bar 8.5 bar 10.5 bar 12.5
bar Best Dia (mm) Reduc-tion in oil flow (%) Reduc-tion in Power (%) Best Dia (mm) Reduc-tion in oil flow (%) Reduc-tion in Power (%) Best Dia (mm) Reduc-tion in oil flow (%) Reduc-tion in Power (%) Best Dia (mm)
3000 5 N/A N/A 5 N/A N/A 5 N/A N/A 5
4000 3 40.24 6.95 3 41.42 4.07 5 N/A N/A 5
5000 3 25.10 7.24 3 45.55 7.23 4.1 39.25 2.63 5
Table 7. Best nozzle diameter at tested operating conditions resulting in least specific power. Shaft
Speed (RPM)
Discharge Pressure
6.5 bar 8.5 bar 10.5 bar 12.5 bar
Best Dia (mm)
Reduction in oil flow (%) Reduction in Specific Power (%) Best Dia (mm) Reduct-ion in oil flow (%) Reduction in Specific Power (%) Best Dia (mm) Best Dia (mm)
3000 5 N/A N/A 5 N/A N/A 5 5
4000 3 40.24 4.02 3 41.42 2.81 5 5
5000 3 25.10 4.44 3 45.55 3.50 5 5
-3 -2 -1 0 1 2 3
3000 4000 5000
(%)
Male rotor shaft speed (RPM) Reduction in specific power %
6.5 bar 8.5 bar
[image:14.595.78.524.588.732.2]4. Conclusion
In this paper, the performance of an oil-injected twin screw compressor is studied by varying the oil flow rate by changing the main nozzle diameters. The experimental study is conducted for discharge pressures from 6.5 bar to 12.5 bar and male rotor shaft speed from 3000 RPM to 5000 RPM. Key conclusions are:
• Variation in oil volume flow rate has a comparatively higher effect on the power consumption than air flow rate for a certain discharge pressure and the male rotor shaft speed.
• For lower discharge pressures (6.5 bar and 8.5 bar), the power consumption increases with the
increase in oil flow. Meanwhile, at higher discharge pressures (10.5 bar and 12.5 bar) the power consumption decreases with the increase in the oil flow. Hence, an optimum quantity of oil should be determined for a compressor running at certain design condition.
• It was expected that a lower temperature difference ratio will be achieved by use of the atomiser nozzle with equivalent cross sectional area of 4 mm. However, it was noticed that the atomiser restricted the oil flow and improved performance as a result.
• At 4000 RPM- 6.5 bar and 8.5 bar, by reducing an average oil flow of 40.8% can improve specific power by an average of 3.41%.
• At 5000 RPM- 6.5 bar and 8.5 bar, reducing an average oil flow by 35.3% can give improvement in specific power of 3.97%.
• Better heat transfer characteristics through TDR is observed with increasing the male rotor shaft speed. This indicates that further study towards the relevant multiphase flow regime needs to be conducted to understand oil droplet distribution at various air flow rates while oil flow rate remains the same as well the relevant leakages.
The results demonstrate the effects of an important parameter oil flow which further investigated lead to savings in specific power and therefore conditions to achieve a better performing machine.
References
[1] P. Singh and J. Bowman, “Heat Transfer in Oil-Flooded Screw Compressors,” International
Compressor Engineering Conference, pp. 135–153, 1986.
[2] N. Stosic, A. Kovacevic, K. Hanjalic, and L. Milutinovic, “Mathematical modelling of the oil
influence upon the working cycle of screw compressors,” in International Compressor
Engineering Conference, 1988.
[3] N. Stošic, L. Milutinović, K. Hanjalić, and A. Kovačević, “Investigation of the influence of oil injection upon the screw compressor working process,” International Journal of Refrigeration, vol. 15, no. 4, pp. 206–220, 1992.
[4] N. Stosic, L. Milutinovic, K. Hanjalic, and A. Kovacevic, “Experimental Investigation of the
Influence of Oil Injection Upon the Screw Compressor Working Process,” in International
Compressor Engineering Conference, 1990.
[5] X. Peng, Z. Xing, T. Cui, and P. Shu, “Experimental Study of Oil Injection and Its Effect On
Performance of Twin Screw Compressors,” in International Compressor Engineering
Conference, 2000.
[6] M. De Paepe, W. Bogaert, and D. Mertens, “Cooling of oil injected screw compressors by oil
atomisation,” vol. 25, pp. 2764–2779, 2005.
[7] G. Valenti et al., “Thermal effect of lubricating oil in positive-displacement air compressors,”
Applied Thermal Engineering, vol. 51, no. 1–2, pp. 1055–1066, 2013.
[8] G. Valenti, S. Murgia, G. Contaldi, and A. Valenti, “Experimental evidence of the thermal effect of lubricating oil sprayed in sliding-vane air compressors,” Case Studies in Thermal Engineering, vol. 4, pp. 113–117, 2014.
[9] G. Bianchi and R. Cipollone, “Experimental assessments on a pressure swirl oil atomizer for
[10] Chattopadhyay, “Flowmeters & Flow Measurement,” Flowmeter and Flow Measurement, p. 452, 2006.
[11] J. H. Arnold, “Vapor Viscosities and the Sutherland Equation,” Journal of Chemical Physics, vol. 1, no. 2, p. 170, 1933.
[12] “A Summary of Error Propagation,” Harvard University, 2013. [Online]. Available:
http://ipl.physics.harvard.edu/wp-uploads/2013/03/PS3_Error_Propagation_sp13.pdf. [Accessed: 09-May-2018].
[13] M. Reader-Harris, Orifice Plates and Venturi Tubes. Springer, 2015.
[14] R. Deipenwisch and K. Kauder, “Oil as a design parameter in screw-type compressors: oil
distribution and power losses caused by oil in the working chamber of a screw-type compressor,”
in International Conference on Compressor and their Systems, 1999, pp. 49–58.