https://doi.org/10.1007/s10198-018-0985-z
ORIGINAL PAPER
The effects of health shocks on labor market outcomes: evidence
from UK panel data
Otto Lenhart1
Received: 11 January 2018 / Accepted: 29 May 2018 © The Author(s) 2018
Abstract
This study examines the link between health shocks and labor market outcomes in the United Kingdom. For sample periods of up to 9 years, I use longitudinal data from the British Household Panel Survey to test how sudden health shocks affect a number of labor market outcomes, such as labor and household income, employment status, and hours worked. Addition-ally, the study examines potential mechanisms underlying the link between health declines and labor market outcomes. By estimating propensity score matching difference-in-differences models, the study shows that sudden health declines lead to significant and persistent reductions in earnings. The effects are strongest for individuals experiencing severe health shocks, males, individuals with higher education and those working in managerial jobs. When examining potential channels, I provide evidence that increased health care expenditures and health care usage as well as reduced work productivity can explain the observed effects on labor market outcomes.
Keywords Health shocks · Labor market · Mechanisms · United Kingdom
JEL Classification C23 · I10 · I12 · J60
Introduction
Despite being previously examined by several research-ers, there is still uncertainty about the relationship between labor market and health outcomes. While the majority of existing studies has focused on examining health effects following changes in income and employment, there has been growing interest in learning more about the effects of health on labor market outcomes in recent years. Given the close link between employment status and both health and health insurance coverage, an improved understand-ing of how labor market outcomes are affected followunderstand-ing health shocks is relevant for policymakers. If health shocks have significant long-term negative spillover effects on
employment and earnings, policymakers should discuss ways to provide improved assistance to workers experienc-ing sudden declines in health in dealexperienc-ing with the situation and allowing them to return to work. Additionally, there is little evidence about the potential mechanisms through which health shocks could affect immediate and long-term labor market outcomes. Using longitudinal data from the British Household Panel Survey (BHPS) for up to 9 years, this study examines the effects of health shocks on several labor market outcomes and explores potential channels through which labor market outcomes are affected follow-ing health shocks.
The analysis of this paper adds to the existing literature in two ways. First, the study uses longitudinal data from the UK. I am following the individuals over four different sam-ple periods: 3, 5, 7 and 9 years. Besides testing for the imme-diate effects of health shocks on labor market outcomes, this also allows me to provide evidence whether people adapt to health shocks over time or whether the effects are persistent. These findings could indicate whether there are potential labor market institutions in place that make it challenging to reintegrate workers into the workforce following the health issues.
Electronic supplementary material The online version of this article (https ://doi.org/10.1007/s1019 8-018-0985-z) contains supplementary material, which is available to authorized users.
* Otto Lenhart
ottolenhart@gmail.com
1 Department of Economics, Duncan Wing, Strathclyde
Second, besides testing for the presence of a causal link from health to labor market outcomes, this study examines potential mechanisms through which health shocks can affect labor market outcomes. An examination of potential channels is important from a policy and a social welfare perspective since it provides evidence for how policymak-ers can potentially help prevent substantial losses in pro-ductivity following health shocks. This study examines the role of three mechanisms: (1) changes in the frequency of health care usage. This can impact labor market outcomes by taking time away from work and work-related activi-ties; (2) changes in the likelihood of paying for health care. While universal health coverage is provided in the UK by the National Health Service (NHS), individuals have the option to purchase additional private care to forego long waiting times and receive potentially lower quality care; (3) changes in the worker’s productivity. Observing changes is the productivity of workers who previously experienced negative health shocks could suggest that employees should find ways on how to allow workers to be better reintegrated to the workforce, while policymakers should create an envi-ronment that mitigates the risks to employees experiencing sudden health shocks.
The study finds that health shocks, captured by declines in self-reported health status and the onset of health condi-tions, significantly affect labor market outcomes. Negative health events are shown to reduce labor earnings, household income, and the likelihood of being employed. The negative effects are found for all four variations of the sample length, which suggests that health shocks have lasting impacts on labor market outcomes. When examining the effects across different subgroups of the population, I find larger effects for males, higher educated individuals, and those working managerial and professional jobs. When examining poten-tial mechanisms, the study provides evidence that increased health care usage and health care expenditures as well as reduced work productivity can explain the observed per-sistent negative effects of health shocks on labor market outcomes.
Labor market outcomes and health:
previous evidence
A number of previous studies have examined health effects of negative employment shocks on people’s health. It has been established that negative employment events such as mass layoffs, plant closings and job loss have significant negative effects on health outcomes of affected individuals [20, 21, 37, 52, 53, 56]. Furthermore, other studies have examined the association between worsened economic
conditions and health outcomes. These findings are mixed: earlier work provides evidence that economic downturns actually improve health outcomes [40, 44, 51], while more recent work suggest that health declines along with the economy [15, 38, 39].
A large number of studies have examined the relation-ship between income and health. Following the pioneer-ing study by Case et al. [10], several papers have also provided evidence for the presence of a strong positive association between household income and health [4, 13,
14, 34, 47, 48]. This phenomenon has become known as the income gradient in health. In more recent year, researchers have expressed the need to test for the causal nature between income and health by pointing out that the presence of a positive association could be the result of third factors that influence both health and income or due to reverse causality, which exists if health outcomes influence people’s employment status and, therefore, their income.
Several previous studies have examined the effects of health shocks on labor market outcomes. The majority of early work on the topic has focused on elderly groups of the population and the effects of health on retirement [7, 9,
18, 26, 31, 32, 49, 54, 60]. These studies established that older adults are significantly less likely to be employed and more likely to retire following the occurrence of a health shock. Other studies additionally show that health shocks have negative labor market effects for younger individuals by examining several types of health shocks. These include the presence of permanent health conditions [46], reduced psychological health [12], injuries from road accidents [16], the onset of disability [11, 36], reduced physical health [22, 23] and sudden illness [24].
Data
This study uses data from waves 10–18 (2000–2008) of the British Household Panel Survey (BHPS), a nationally representative panel survey of private households in Great Britain that started interviewing 10,300 individuals from 5,500 families in 1991.1 The use of the BHPS provides
several advantages for the purpose of this study. Due to it longitudinal nature, the dataset allows accounting for time-invariant unobserved heterogeneity and composi-tional selection. The potential for measurement error in
the self-reported health measure is reduced since each individual’s health is only compared to his or her own prior assessment. This allows controlling for the fact that each respondent may have their own scales in ranking their health (reference bias). Furthermore, in comparison to the two other commonly used UK datasets with detailed infor-mation on labor market outcomes (Labor Force Survey and New Earnings Survey), the BHPS also provides informa-tion on several health outcomes. Finally, the BHPS gives a complete representation of incomes across the pay dis-tribution since it questions all individuals above 15 years of age who live in the household at the time of the inter-view. Given that individuals in the UK become eligible to receive state pensions at the age of 65, the sample is restricted to all individuals between the ages 18 and 64 in
Table 1 DD model setup Treatment group Control group
Health Employment Health Employment
Panel A
3-year
2000 (pre) Excellent/very good Working Excellent/very good Working 2001 (shock) Fair/poor/very poor Working Excellent/very good Working 2002 (post) Fair/poor/very poor Excellent/very good
Panel B
5-year
2000 (pre) Excellent/very good Working Excellent/very good Working 2001 (pre) Excellent/very good Working Excellent/very good Working 2002 (shock) Fair/poor/very poor Working Excellent/very good Working 2003 (post) Fair/poor/very poor Excellent/very good
2004 (post) Excellent/very good
Panel C
7-year
2000 (pre) Excellent/very good Working Excellent/very good Working 2001 (pre) Excellent/very good Working Excellent/very good Working 2002 (pre) Excellent/very good Working Excellent/very good Working 2003 (shock) Fair/poor/very poor Working Excellent/very good Working 2004 (post) Fair/poor/very poor Excellent/very good
2005 (post) Excellent/very good 2006 (post) Excellent/very good
Panel D
9-year
2000 (pre) Excellent/very good Working Excellent/very good Working 2001 (pre) Excellent/very good Working Excellent/very good Working 2002 (pre) Excellent/very good Working Excellent/very good Working 2003 (pre) Excellent/very good Working Excellent/very good Working 2004 (shock) Fair/poor/very poor Working Excellent/very good Working 2005 (post) Fair/poor/very poor Excellent/very good
2006 (post) Excellent/very good 2007 (post) Excellent/very good 2008 (post) Excellent/very good
1 Taylor (1998) provides a full description of the sampling strategy
[image:3.595.170.545.53.497.2]the surveyed households for whom information on health and labor market outcomes is available.
The analysis uses two different types of health shocks. In the main specification, which is presented in Table 1, health shocks are defined as a decline in self-reported health sta-tus. Self-assessed health is categorized from 1 (= excellent) to 5 (= very poor) in the BHPS. This measure of health has been shown to be a good predictor of other health out-comes, including mortality [29], future health care usage [57] and hospitalizations [45]. To remove concerns about potential reporting heterogeneity of health status, Johnston et al. [33] suggest the additional use of more objective health outcomes. In an additional specification, health shocks are defined as the onset of a new health condition. In each wave, the BHPS asks respondents whether they suffer from any of the following 15 health conditions: body pain, migraine, skin issues/allergy, asthma/chest pain, anxiety, heart or blood pressure, hearing problems, stomach/liver/kidney pain, seeing problems, epilepsy, diabetes, alcohol or drug problems, stroke, cancer or other conditions. As indicated by García-Gómez [23], using the onset of health conditions as a health shock could provide evidence regarding any potential anticipation effects [23].
Besides examining the short- and long-run effects of health shocks on earnings and employment, this study addi-tionally tests for the role of potential mechanisms underlying the link between sudden declines in health and labor market outcomes. According to the Grossman [25], health can be viewed as both a consumption and investment good since it not only makes people feel better, but it also increases the number of healthy days to work and to earn income. Gross-man [25] states that to keep certain levels of health capital, individuals invest into their health through channels such as market inputs of health care, diet and exercise.
The first mechanism examined is changes in health care usage, which is captured by three outcomes: (1) the likeli-hood of having more than five annual doctor visits, (2) the likelihood of having spent a night at a hospital in the previ-ous year, (3) the likelihood of having used a number of other health services, and (4) changes in the likelihood of having paid for health care services in the previous year. While the NHS provides universal coverage to all individuals in the UK, two serious issues that the program has been dealing with are the quality of care and long waiting times [59]. To avoid these problems, individuals have the option to pur-chase additional private care to forego long waiting times before seeing a doctor in some cases. Persistent increases in out-of-pocket expenditures on health can be associated with labor market outcomes in two ways: (1) earned income of individuals recovering from health shocks could be reduced due to time spent away from work for doctor visits, and (2) household income could be affected to a larger extent than individual income if other household members take time
off from work to help their family member with the doc-tor appointments. Given that the analysis uses four different sample lengths, it is able to provide evidence whether any potential changes in health care usage only occur immedi-ately after the health shock or whether these changes persist for several years.
While health shocks can reduce the labor force partici-pation of people who can no longer work, another channel through which adverse health events can affect earnings is by reducing labor productivity. Workers might not be able to perform the same tasks or might need longer to complete the same tasks compared to before the health shock. Without empirically testing for the presence of this channel, García-Gómez and López-Nicolás [22] point out that productiv-ity losses could either be absorbed by the employer or by the inability to work extra time. Using a sample of 2264 workers, Myde et al. [43] provide evidence for a strong link between health risks and self-reported work productivity.
To capture whether changes in work productivity are a potential mechanisms underlying the relationship between health shocks and labor market outcomes, this analysis examines four proxies for work productivity: (1) hourly wages of workers, (2) the likelihood of reporting that cur-rent work is limited by one’s health, (3) the likelihood of having difficulty to concentrate, and (4) the likelihood of constantly feeling under strain. While hourly wages is the most direct way of measuring productivity, the other three outcomes should provide additional evidence for poten-tial changes in labor productivity following the onset of health shocks. Antikainen and Lönnqvist [5] suggest that, especially in “knowledge-intensive” organizations, where knowledge has more importance than other inputs, work performance can be negatively affected by health problems or other personal issues because they are highly dependent on the ability to concentrate. Using a factor analysis model, Halkos and Bousinakis [27] provide empirical evidence that increased stress leads to reduced work productivity. Using the four proxies of work productivity listed above, my study tests whether individuals who suffered health shocks are not able to perform the same tasks compared to prior to the experiencing the sudden health decline.
Econometric methods
DD matching models
the distributions of outcomes of matched individuals in the control group, without having to make any functional form assumptions. As pointed out by García-Gómez and López-Nicolás [22], matching frameworks are often criti-cized for assuming away potential biases that might exist due to unobserved heterogeneity. The authors argue that one solution to remove concerns about such biases is the use of longitudinal data that includes data from before and after the health shock. Using longitudinal data from the BHPS, this study is able to first difference the outcomes of the treated and the controls to eliminate any unobservable fixed effects that influence the selection into the groups as well as the outcomes of interest [22]. Thus, the estimated ATET’s are weighted averages of the differences in differences between each of the treated individuals and his/her matched control.
The study uses estimated propensity scores, which cal-culate the probability of treatment given a vector of observ-able variobserv-ables, to match individuals who receive a health shock to individuals that are similar but do not experience the health shock. The propensity scores are based on pre-treatment variables and are estimated using probit models. Observable characteristics that are included to obtain the propensity scores are age, gender, household size, educa-tional attainment, and area. In addieduca-tional specifications, I furthermore include information on lagged health status as a covariate when estimating the propensity scores. Follow-ing Rosenbaum and Rubin [50], the use of a function of X, called the propensity scores P(X), rather than a potentially high-dimensional vector of covariates implies that:
where Y0 denotes the untreated state, D = 1 indicates treat-ment and D = 0 indicates non-treatment. The analysis of this study follows Heckman et al. [28] difference-in-difference matching methods, which uses both comparisons between treated and non-treated, and differencing over time. Thus, the conditions needed to identify the ATET using the differ-ence-in-difference matching estimator is:
where t and t′ represent the post- and pre-treatment peri-ods, respectively. Thus, the ATET provides a weighted aver-age of the differences in differences between individuals in the treatment and the control group and it is obtained by estimating the following equation:
In the empirical analysis, the study uses two alternative methods when matching treated individuals with those in the control group [8]: (1) nearest neighbor matching on the (1)
E(Y
0|D = 1, P(X)
)
= E(Y
0|D= 0, P(X)
) ,
(2) E(Y
0,t− Y0,t�|D = 1,P(X) )
= E(Y
0,t− Y0,t�|D = 0, P(X) )
,
(3)
ATETDID= E(Y
1t|D=1, P(X)
) − E(Y
0t|D=0, P(X)
)
− E(Y
1t�|D=1,P(X)
) − E(Y
0t�|D=0, P(X)
)
propensity score, and (2) kernel matching on the propensity score. Since there are no reasons to expect one of the meth-ods to be preferable to the other, the use of both methmeth-ods allows the analysis to test for the robustness of the observed effects. When examining the ATET of health shocks on labor market outcomes, the analysis examines four different outcomes: (1) total annual labor income, (2) total annual household income, (3) the probability of being employed, and (4) hours worked per week. Standard errors are obtained following recent findings by Abadie and Imbens [3], who established how to take into account that propensity scores are estimated in the first stage. They show that ignoring this fact when estimating average treatment effects on the treated in the second stage may lead to confidence inter-vals that are either too large or small.2 By showing that the
propensity matching estimator have approximately Normal distributions, Abadie and Imbens [3] provide evidence that the matching on estimated propensity score is more efficient than matching on the true propensity score in large samples.
Assignment of treatment and control groups
This assignment of individuals into treatment and control group used in this study is similar to previous work by García-Gómez and López-Nicolás [22] and García-Gómez [23] as well as Lechner and Vázquez Álvarez [35]. A crucial challenge when estimating the effects of health shocks on labor market outcomes is the fact that many health and labor market outcomes are potentially jointly determined by many people. The use of propensity score matching DD model can overcome this concern by identifying arguably exogenous health shocks that are independent of employment status. Table 1 shows the setup for the two groups used in the DD models estimated in this study, which analyzes four varia-tions of sample length to test for both immediate and the long-term effects of adverse health events on labor market outcomes. Despite different sample periods, all three models share the following characteristics:
1. Individuals from both treatment and control group are in excellent or very good health and are working in the pre-treatment period (Pre).
2. Individuals forming the treatment group experience a health shock in the treatment period (Shock), meaning their health status drops to fair, poor or very poor.
Indi-2 The analysis is conducted using the “teffects psmatch” command in
viduals in the control group remain in excellent or very good health. All members of the treatment and the con-trol group are working during the period in which the treatment occurs.
3. Self-reported health status of individuals in the treat-ment group remains in fair, poor or very poor health in the first year after the health shock, while individuals in the control group remain in excellent or very good health throughout the post-treatment period (Post).
Additionally, using the same setup as shown in Table 1, I use the onset of a health condition as an alternative health shock. Individuals forming the treatment group report the onset of a health condition in the treatment period, while those in the control group report no health conditions throughout the study period. Again, all individuals work in both the pre-treatment and the treatment period. Given that information regarding the presence of health conditions are potentially less subjective than self-assessed health status, the findings from this additional health shock can remove concerns about potential reporting heterogeneity of health status [33].
By examining a sample of individuals who are employed during both the pre-treatment period and the year of the health shock, the potentially simultaneous determination of health and labor market outcomes is accounted for and allows testing for the effects of experiencing health declines on labor market outcomes in the post-treatment period. This framework ensures that the observed effects are not the result of reverse causality, which would exist if changes in labor market outcomes lead to the health shock. One assumption of this framework is that there are no anticipation effects, meaning that people report declines in health because they expect negative employment shocks to occur in the future.
Descriptive statistics
Table 2 presents sample sizes for the four different sample length for each of the two health shocks that examined in the study. For the health status shock in the shortest period of study (2000–2002), the control group consists of 9720 observations and the analysis includes 591 observations for the treatment group. The analysis includes only individuals
that are present in all waves of the corresponding sample periods. Given that the onset of new health conditions occur less frequently than declines in health status, the sample sizes are smaller when using health condition as the health shock.
Given that the analysis in this study only includes indi-viduals who are present in all survey waves for each sample length period (either 3, 5, 7 or 9 years), attrition could pose a potential issue. The obtained treatment effect estimates could potentially be biased if people drop out of the survey due to health-related problems. Given the longitudinal data set of the BHPS, I am able to identify individuals who drop out of the survey and compare them to those who remain in it and are used in the analysis. Online Appendix Table A1 shows comparisons of descriptive statistics for the two groups for the sample periods of 5, 7, and 9 years. It is noticeable that there are only very small differences in health status between people remaining in the survey and those who drop out at some point. Individuals who stay in the BHPS for all the years in each of the three period analyzed are shown to be slightly more likely to be employed and have higher labor and household incomes than those who drop out of the sur-vey. Table A1 shows that the attrition rates were between 13 and 15% for the sample periods shown in Online Table A1.
One of the main assumptions of estimating propensity score matching DD estimates is that the overlap assump-tion, which is satisfied when there is a chance of seeing observations in both control and treatment groups at each combination of covariate values. As highlighted in the refer-ence manual for Stata Treatment Effects, the analysis cannot predict or otherwise account for the unobserved outcomes of some individuals if the assumption is violated [55]. Fig-ure 1a–d provide plots of the estimated densities of the propensity scores for both treatment and control groups for all four sample periods. All the graphs present clear evi-dence that the overlap assumption is satisfied since there are chances of seeing observations in both groups at each combination of covariate values.
Table 3 provides results from covariate balance tests for the matching conducted in the analysis. In well specified matching models, the covariates should be balanced, which allows for the outcomes to be conditionally independent of the treatment when conditioning on covariates [55]. The left
Table 2 Sample sizes for
treatment and control group Health shock: drop in health status Health shock: onset of health condi-tion
[image:6.595.180.546.71.159.2]side of Table 3 shows the balance test results for the main analysis, while the right side shows differences between raw and matched data when lagged health information is included as a covariate.3 Overall, the balancing results
indi-cate that the matching succeeds in balancing the covariates and reducing the standardized differences between the two groups.
Results
The effects of health status shocks
Table 4 presents propensity score matching DD effects of sudden declines in health status on four labor market out-comes and four different sample lengths. The estimates in the first two columns provide evidence that health shocks have substantial negative effects on labor earnings of affected
individuals. The nearest neighbor matching estimates find reductions in annual labor income in the range of £1181.40 for the year after the shock in the 3-year sample (p < 0.01) to £4432.32 for the 9-year sample (p < 0.01), which exam-ines the effects for up to 4 years after the health shock.4
The immediate effects on earnings in the year following the drop in health status is slightly smaller in magnitude than estimated by García-Gómez and López-Nicolás [22], who find a decline in income of €1118 (measured in 2001 Euros, which corresponds to £1763.31 using the 2001 €/£ conver-sion rate) using Spanish data and a 3-year sample.
While the kernel matching estimates also provide evi-dence for declines in labor income in all four periods, two of the effects are statistically insignificant. Overall, given that losses in labor income are larger in magnitude for the longer sample periods, the results do not suggest that individuals adapt to the health shock. On the contrary, it appears that individuals struggle to be reintegrated into the labor force following the declines in health. The next two columns show
Fig. 1 Density of propensity scores, a 3-year sample, b 5-year sample, c 7-year sample, d 9-year sample
3 Table 3 shows balancing test results for the Nearest Neighbor
matching analysis. The results are consistent for the kernel matching analysis. These results are not shown, but are available upon request.
4 Income results are adjusted for inflation using the U.K. Consumer
[image:7.595.58.543.49.390.2]Table 3 Covariate balance tests Main analysis Analysis with controls for lagged health
Standardized
differ-ences Variance ratio Standardized differ-ences Variance ratio Raw Matched Raw Matched Raw Matched Raw Matched 3-year
HH size − 0.0175 0.0024 0.9420 0.9163 Education 0.1734 − 0.0018 0.9906 0.9687 Age 0.1071 − 0.0186 1.0413 1.0315 Gender − 0.0022 0.0275 1.0014 1.0016 Area − 0.0335 − 0.0127 0.9285 0.9490 5-year
HH size − 0.0672 0.0417 1.0414 1.1571 − 0.0672 − 0.0310 1.0414 1.1079 Education 0.3427 0.0149 0.9780 0.9559 0.3427 − 0.0757 0.9780 0.9161 Age 0.1533 0.0432 0.9215 0.8796 0.1533 0.0243 0.9215 0.8692 Gender 0.1038 − 0.0715 0.9996 0.9896 0.1038 − 0.0017 0.9996 0.9999 Area − 0.0769 − 0.0320 1.0018 0.9967 − 0.0769 − 0.1255 1.0018 0.9490 Lagged health status – – – – 0.6766 0.0187 0.6010 0.9708 7-year
HH size − 0.1542 0.0182 1.1199 1.2669 − 0.1542 − 0.2428 1.1199 0.9570 Education 0.1278 − 0.0738 0.9103 0.8231 0.1278 0.4209 0.9103 1.3985 Age − 0.0831 − 0.0123 1.0280 1.0092 − 0.0831 0.1321 1.0280 1.1516 Gender − 0.0428 − 0.0892 1.3490 1.9217 − 0.0428 − 0.2305 1.3490 1.1363 Area 0.2269 0.0432 0.7737 0.8212 0.2269 − 0.0232 0.7737 0.7864 Lagged health status – – – – 0.7242 − 0.0782 0.5197 1.0818 9-year
HH size 0.0455 0.0744 0.8414 0.7221 0.0455 0.0440 0.8414 0.9859 Education 0.2734 − 0.0498 1.0289 1.1293 0.2734 0.0232 1.0289 0.8383 Age 0.1377 0.0050 0.8731 0.8611 0.1377 − 0.1599 0.8731 1.0662 Gender − 0.0170 − 0.0145 1.4092 2.0770 − 0.0170 0.0592 1.4092 0.9511 Area 0.2399 0.0667 0.8979 0.9703 0.2399 0.2130 0.8979 0.8791 Lagged health status – – – – 0.7109 − 0.0410 0.6144 0.8386
Table 4 Effects of health shocks on labor market outcomes (health status)
Robust standard errors, based on Abadie and Imbens [1], are shown in parentheses. Income is adjusted for inflation, using the UK. Consumer price Index and 2000 as the base year
*p < 0.10, **p < 0.05, ***p < 0.01
Total labor income (£ per year) Total HH income (£ per year) Employed Weekly work hours NN matching Kernel
match-ing NN matching Kernel match-ing NN matching Kernel match-ing NN matching Kernel matching 3 year sample − 1181.40***
(430.54) − 769.08 (621.24) − 2834.63*** (756.41) − 3355.70*** (1065.85) − 0.0068 (0.0073) − 0.0186* (0.0109) − 0.06 (0.57) − 1.14 (0.72) 5-year sample − 3041.75***
(462.60) − 3948.23*** (752.80) − 4362.41*** (777.40) − 4255.36*** (1063.76) − 0.0356*** (0.0103) − 0.0370*** (0.0149) − 1.17** (0.58) − 0.57 (0.65) 7-year sample − 2097.46***
(437.16) − 671.85 (720.86) − 3025.02*** (715.66) − 4677.16*** (1345.02) − 0.0378*** (0.0128) − 0.0268* (0.0149) 0.93 (0.57) 0.39 (0.78) 9-year sample − 4432.32***
[image:8.595.180.541.63.464.2] [image:8.595.51.544.496.635.2]the effects on health declines on annual household income. For all sample periods and both matching techniques, I find even larger reductions in household income than for labor income. For the 9-year sample, the results suggest that household incomes are reduced by £5005.84 and £4871.36 following the health shock (both p < 0.01). A potential expla-nation for the difference in magnitudes for total household income and individual labor earnings is that other household members take time away from work to assist the individuals recovering from health shocks.
Appendix Table A2 furthermore provides matching DD results for the effects of sudden declines in health status on the natural log of both total labor and household income. Consistent with the results in Table 4, all estimates show that health shocks negatively affect labor earnings and total household incomes of affected individuals. While it should be noted that two of the eight labor income estimates are imprecisely estimated, Online Table A2 confirms that the observed treatment effects are robust to the measure of income used in the analysis.
Table 4 additionally shows the effects of health shocks on the likelihood of being employed and weekly hours worked. My analysis finds that individuals reduce their labor mar-ket activity on the extensive margin, while there is little
evidence that there are any changes on the intensive margin of employment. While four of the eight estimates for the likelihood of being employed are statistically significant at the 1% level, the immediate effects are substantially smaller than those observed by García-Gómez and López-Nicolás [22] for Spain. When re-estimating the analysis with only individuals who remained at work throughout the sample periods, I find very similar declines in labor earning and household income. This suggests that changes in employ-ment are not the only driver of the observed income losses. The later part of the study examines some other potential mechanisms through which health shocks can affect labor market outcomes.5
Annual treatment effects
Table 5 shows annual estimates for the effects of health shocks on total annual labor income and the likelihood of
Table 5 Annual treatment effects
Robust standard errors, clustered by individuals and based on Abadie and Imbens [1], are shown in paren-theses. Income is adjusted for inflation, using the UK. Consumer price Index and 2000 as the base year *p < 0.10, **p < 0.05, ***p < 0.01
Total labor income (£ per year) Employed 5-year sample (health shock in 2002)
Treat*2000 456.45 (571.33) 0.0089 (0.0182) Treat*2001 29.13 (548.56) 0.0056 (0.0152) Treat*2003 − 496.32 (526.55) 0.0017 (0.0192) Treat*2004 − 1913.57** (763.25) − 0.0734*** (0.0310) 7-year sample (health shock in 2003)
Treat*2000 695.75 (873.84) − 0.0090 (0.0236) Treat*2001 124.97 (762.76) − 0.0083 (0.0194) Treat*2002 1336.91 (846.87) 0.0063 (0.0213) Treat*2004 − 1358.27* (781.94) 0.0568 (0.0367) Treat*2005 − 2078.62** (923.18) − 0.0572 (0.0361) Treat*2006 − 2498.40** (1022.74) − 0.1212*** (0.0431) 9-year sample (health shock in 2004)
Treat*2000 592.78 (2527.47) − 0.0005 (0.0077) Treat*2001 882.40 (2567.48) 0.0004 (0.0048) Treat*2002 2161.92 (2325.20) 0.0021 (0.0054) Treat*2003 128.95 (2301.63) − 0.0009 (0.0057) Treat*2005 385.63 (2226.96) 0.0145 (0.0259) Treat*2006 − 948.35 (2033.88) − 0.0198*** (0.0063) Treat*2007 − 1551.61 (2298.16) − 0.0319*** (0.0066) Treat*2008 − 1625.28 (2229.07) − 0.0421*** (0.0071)
5 Appendix Table A3 furthermore shows DD matching estimates
[image:9.595.175.545.58.344.2]being employed, which are obtained by interacting each year with the treatment indicator. Since this test includes effects during pre-shock periods, it provides a test for the parallel trends assumption made in the main DD model. Given that this analysis is not feasible in the 3-year sam-ple, Table 5 only shows treatment effects for sample peri-ods of 5, 7 and 9 years.
For all the sample periods, no statistically significant differences are estimated during the years before the onset of the health shocks. Furthermore, none of the pre-shock treatment effects that are shown in Table 5 are jointly significant. This provides suggestive evidence that the parallel trends assumption is satisfied. The estimates for both labor income employment status become larger in magnitude several years after the shocks, indicating that the effects of health shocks on labor market outcomes are persistent rather than temporary. Figure 2a–d confirm this by providing graphical representations of estimates presented in Table 5.
Mild vs. severe health shocks
The longitudinal nature of the BHPS furthermore allows me to identify individuals who experienced large changes in self-reported health as well as others whose health status only slightly declined. Information on self-reported health status in the BHPS is provided on a scale from 1 (= excel-lent) to 5 (= very poor). For this analysis, I define the two types of treatments the following way for all sample lengths: (1) mild health shocks are average declines in self-reported health by at most one point on the scale between the pre- and post-shock period; (2) severe health shocks are average declines in self-reported health by more than one point on the scale between the pre- and post-shock period. Individu-als in the control group are those whose average health status remained the same across both periods. Compared to the main analysis in Sect. 5.1, this specification allows using changes in the entire distribution of health status. Consistent with the main DD setup shown in Table 1, all individuals
[image:10.595.57.541.51.396.2]are still required to be employed throughout the pre-shock period and in the year that the shock occurred. This analysis is similar to two previous studies that test for employment effects for individuals near retirement with panel data sets. Smith [54] data from the Health and Retirement Survey (HRS) to separately test the effects of experiencing either a major or a minor health shock, while Riphahn [49] tests
for the effects of labor market outcomes following a 5-point drop in health satisfaction in the German Socio-Economic Panel (GSOEP), which collects self-reported health informa-tion on a scale from 0 to 10.
Table 6 presents the results for the two levels of health shocks. As expected, the negative effects on labor income and the likelihood of being employed are substantially larger
Table 6 The effects of health shocks on labor market outcomes (average differences in health status)
Robust standard errors, cluster by individuals and based on Abadie and Imbens [1], are shown in parentheses. Income is adjusted for inflation, using the UK. Consumer price Index and 2000 as the base year
*p < 0.10, **p < 0.05, ***p < 0.01
Total labor income (£ per year) Total HH income (£ per year) Employed Weekly work hours NN matching Kernel
match-ing NN matching Kernel match-ing NN matching Kernel match-ing NN matching Kernel match-ing 3-year sample
Mild shock − 565.58**
(239.51) − 568.12* (322.62) − 368.59 (442.20) − 584.43 (514.00) − 0.0097** (0.0041) − 0.0117** (0.0053) − 0.03 (0.27) 0.22 (0.38) Severe
shock − 1743.84*** (462.67) − 1108.57* (598.55) − 1411.01 (915.97) − 1495.33 (1138.41) − 0.0261** (0.0107) − 0.0294*** (0.0111) 1.11** (0.49) 1.58** (0.75) 5-year sample
Mild shock − 298.32
(234.22) − 406.03 (295.50) 372.45 (341.97) 610.45 (452.44) − 0.0079** (0.0033) − 0.0064 (0.0042) 0.17 (0.21) 0.12 (0.27) Severe
shock − 1353.91*** (395.69) − 1178.19** (515.06) − 79.18 (768.42) 562.42 (918.08) − 0.0373*** (0.0097) − 0.0326*** (0.0109) 0.76 (0.51) − 0.10 (0.66) 7-year sample
Mild shock − 777.23***
(254.05) − 684.35* (379.52) − 432.31 (399.68) − 607.45 (578.83) − 0.0071 (0.0044) − 0.0012 (0.0059) 0.79*** (0.26) 1.16*** (0.36) Severe
shock − 3697.61*** (362.84) − 2483.74*** (547.43) − 4366.20*** (587.85) − 2546.32*** (1006.68) − 0.0652*** (0.0132) − 0.0594*** (0.0119) − 1.52** (0.66) − 1.90*** (0.71) 9-year sample
Mild shock − 1739.05***
(269.20) − 1840.00*** (341.71) − 3908.70*** (371.18) − 3758.49*** (490.90) − 0.0205 (0.0142) − 0.0113** (0.0053) 0.25 (0.23) 0.46 (0.31) Severe
shock − 3335.97*** (578.20) − 3873.31*** (832.38) − 5716.03*** (775.68) − 7504.61*** (1361.91) − 0.0723*** (0.0130) − 0.0619*** (0.0140) − 2.66*** (0.68) − 1.74** (0.78)
Table 7 Effects of health shocks on labor market outcomes (health condition)
Robust standard errors, clustered by individuals and based on Abadie and Imbens [1], are shown in parentheses. Income is adjusted for inflation, using the UK. Consumer price Index and 2000 as the base year
*p < 0.10, **p < 0.05, ***p < 0.01 Total labor income (£ per
year) Total HH income (£ per year) Employed Weekly work hours NN matching Kernel
match-ing NN matching Kernel match-ing NN matching Kernel match-ing NN matching Kernel match-ing 3-year sample − 1049.24***
(364.98) (515.82)− 1068.43** (580.60)− 2107.76*** (860.66)− 2500.87*** (0.0070)− 0.0066 (0.0071)− 0.0029 − 0.39 (0.37) − 0.83* (0.50) 5-year sample − 1653.48***
(340.84) (521.67)− 1414.43*** (716.49)− 2105.80*** (940.21)− 3490.51*** (0.0022)0.0020 (0.0029)0.0046 (0.36)− 0.83** − 1.15** (0.48) 7-year sample − 3129.55***
(444.22) (698.85)− 3292.39*** (777.31)− 3342.17*** (1078.69)− 4202.84*** (0.0013)− 0.0025 (0.0025)− 0.0035 − 0.30 (0.39) − 0.51 (0.55) 9-year sample − 3482.73***
[image:11.595.50.544.72.350.2] [image:11.595.50.545.421.570.2]for individuals who experienced severe health shocks com-pared to individuals whose average health status declined by at most one point. Similar to the previous findings, the results are larger for the two longer sample periods (5 and 7 years), suggesting that the labor market effects are persistent rather than temporary. In the 7-year period, it is observ-able that individuals with mild health shocks significantly increase their weekly work hours, while those who experi-enced severe health shocks work significantly fewer hours after the health shock. Overall, the results in Table 6 point out that labor market outcomes are significantly worsened after severe health declines. However, given that labor income for those with mild shocks is reduced by £1840 in the 9-year sample (p < 0.01, kernel matching), the results also indicate that even relatively small health declines can negatively affect labor market outcomes of affected individuals.
The effects of health conditions
For the results shown in Table 7, I use the onset of a new health condition as an alternative health shock. Given that the presence of health conditions is likely to be more objec-tive than self-reported health status, these estimates can potentially provide additional robustness to the findings shown in Table 4 by removing concerns about the use of self-assessed health. As shown in Table 2, the number of treated individuals captured with this alternative definition of health shock is larger than for the drop in health status.
Table 7 shows that the negative effects on both labor and household income are consistent with the results from the health status shock, with all effects being statistically signifi-cant at the 1% level. The results for employment indicate the onset of a new health condition did not affect employment on the extensive margin, which again suggests that other factors explain the losses of earnings and household incomes after
the health shock. The observed effects on hours worked are mixed, with three estimates finding statistically reductions in the weekly time spent working following the onset of the health condition. Overall, the results in Tables 4 and 7 pro-vide consistent epro-vidence that sudden health declines lead to substantial and persistent negative effects on labor earning and household income.
Mechanisms
The effects on health care usage
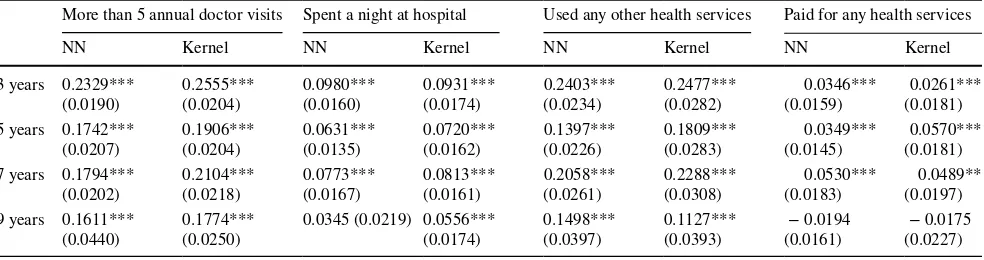
Table 8 presents estimates for the effects of health shocks on three indicators of health care usage and on the likelihood with which individuals paid for any health services out of their own pockets. The first six columns show that, as one could expect, individuals are more likely to have more than five annual doctor visits, to spend a night at the hospital and to have used any other services (e.g., physiotherapist, psy-chotherapist, health visitor at home) over the last 12 months. While the effects are largest in the 3-year sample, where the results capture the results in the years immediately after the health shock, the results remain relatively large and statisti-cally significant for the longer sample periods. Given that spending a night in the hospital or frequent doctor visits means lost time at work, the observed changes in health care usage can potentially explain the earnings losses to some extent.
The final two columns of Table 8 additionally provide evidence that treated individuals are more likely to pay for any health care services following the health care shock. The nearest neighbor matching results suggest that the effect is largest for the 7-year sample, again indicating that the effects on health are persistent. Given that only a small share of individuals in my samples report that they have any health
Table 8 Effects of health shocks on health care usage
Robust standard errors, clustered by individuals and based on Abadie and Imbens [1], are shown in parentheses. Examples of health services asked for in the BHPS are usage of a physiotherapist, psychotherapist, health visitor at home and a hospital consultant. Pregnancies are excluded when examining changes in the likelihood of being a hospital in-patient
*p < 0.10, **p < 0.05, ***p < 0.01
More than 5 annual doctor visits Spent a night at hospital Used any other health services Paid for any health services NN Kernel NN Kernel NN Kernel NN Kernel 3 years 0.2329***
(0.0190) 0.2555*** (0.0204) 0.0980*** (0.0160) 0.0931*** (0.0174) 0.2403*** (0.0234) 0.2477*** (0.0282) (0.0159)0.0346*** (0.0181)0.0261*** 5 years 0.1742***
(0.0207) 0.1906*** (0.0204) 0.0631*** (0.0135) 0.0720*** (0.0162) 0.1397*** (0.0226) 0.1809*** (0.0283) (0.0145)0.0349*** (0.0181)0.0570*** 7 years 0.1794***
(0.0202) 0.2104*** (0.0218) 0.0773*** (0.0167) 0.0813*** (0.0161) 0.2058*** (0.0261) 0.2288*** (0.0308) (0.0183)0.0530*** (0.0197)0.0489** 9 years 0.1611***
[image:12.595.53.545.71.201.2]care expenditures, the increase of paying for health care ser-vices of 5.30% points (p < 0.01) corresponds to an increase of 52.01% compared to prior to the health shock.
These observed changes in health care expenditures could furthermore explain the fact that household income reductions following health shocks are even larger than the losses in labor earnings, as previously shown in Tables 4
and 7. Other household members might reduce their work time to support the family members with health issues with their doctor visits, which goes along with increased health expenditures. While increases in health care expenditures are observable for the first three sample periods, no statistically significant effects are found for the 9-year sample.
The effects on worker’s productivity
Another potential channel through which health shocks can affect labor market outcomes are changes in the level of work productivity. In Table 9, I show the effects on four proxies for work productivity for the sample of people who work throughout the sample period.
First, I examine whether health shocks affect the hourly wages of individuals who remain in the workforce. The DD results provide evidence that wage rates declined substan-tially for workers who experienced adverse health events compared to those who did not. While the estimates for the 3-year period are relatively small and imprecisely estimated, I find that hourly wages are reduced by £2.07 (p < 0.01) when analyzing the 9-year sample. These estimates suggest that individuals who remain in the workforce experience less wage growth than those in the control group following a health shock. One potential explanation for this could be that they are either not able to perform the same tasks or take longer to complete the same tasks as compared to prior to the onset of the health shock. The remaining columns of Table 9 examines several proxies for labor productivity that
can provide more evidence on how work performance can be affected by health shocks.
The next two columns show that treated workers are significantly more likely to report that their health is lim-iting their work. Similar to changes in health care usage, the effects are largest in the year after the health shock. Using the 3-year sample, I observe a 19.53% point increase in the likelihood of reporting health-related work limita-tions (p < 0.01). While the effects are smaller for the three longer sample periods, they still show statistically signifi-cant increases (p < 0.01). The other two proxies of work productivity I examine are reporting having difficulties to concentrate [5] and being constantly under strain [27]. The DD matching estimates obtained for these two outcomes provide additional evidence that reductions in work pro-ductivity might explain the losses of labor income to some extent. Again, the effects are quite large and remain persis-tent across the different sample periods. Overall, the results in Table 9 suggests that individuals who suffered from a sudden health shock are less likely to perform the same tasks compared to prior to the health shock.6
Heterogeneous effects
In a number of additional specifications, I examine whether the effects of sudden health declines on labor earnings differ across subgroups of the population. Table 10 presents nearest neighbor DD matching results across gender, education level, job classifications, and age. Using data from the Netherlands, García-Gómez et al. [24] find that health shocks have larger
Table 9 Effects of health shocks on work productivity
Robust standard errors, clustered by individuals and based on Abadie and Imbens [1], are shown in parentheses *p < 0.10, **p < 0.05, ***p < 0.01
Hourly wage (£ per hour) Work limited by health Having difficulty to concentrate Feeling constantly under strain Nearest
neigh-bor matching Kernel match-ing Nearest neigh-bor matching Kernel match-ing Nearest neigh-bor matching Kernel match-ing Nearest neigh-bor matching Kernel matching 3 years − 0.2933
(0.3998) (0.4684)− 0.6774 0.1953*** (0.0180) 0.1915*** (0.0182) 0.1806*** (0.0213) 0.1721*** (0.0178) 0.1493*** (0.0217) (0.0277)0.1570*** 5 years − 1.4467***
(0.1870) (0.3897)− 1.3654*** 0.0837*** (0.0144) 0.0922*** (0.0167) 0.0809*** (0.0182) 0.0789*** (0.0239) 0.1470*** (0.0271) (0.0279)0.1535*** 7 years − 0.8068**
(0.3794) (0.3334)− 0.0947 0.1060*** (0.0158) 0.1007*** (0.0200) 0.1833*** (0.0240) 0.1643*** (0.0241) 0.1956*** (0.0239) (0.0291)0.1677*** 9 years − 2.0683***
(0.2474) (0.7561)− 2.0709*** 0.0860*** (0.0277) 0.0857*** (0.0234) 0.0230* (0.0120) 0.0362** (0.0180) 0.1032*** (0.0338) (0.0338)0.0712***
6 All results in Tables 8 and 9 are obtained using the drop in health
[image:13.595.52.545.71.210.2]effects on the income of men, which they relate to the fact that males are accounting for greater shares of household earnings. Using longitudinal data from the USA, Charles [11] further-more provides evidence that the effects of health shocks on earnings are increasing with age. He provides two explana-tions for this: (1) older persons have accumulated more human capital that can be destroyed by negative health events; (2) any subsequent recovery in earnings will be weaker for older individuals.
My findings in Panel A confirm the results by García-Gómez et al. [24]. For all four sample periods, the effects of health status declines on earnings are substantially larger for male individuals. In the 5-year sample period, a health shock is shown to reduce labor earnings of men by £6576.00, com-pared to a reduction of earnings of £1351.57 for women (both p < 0.01). Similar to García-Gómez et al. [24], I find that men have substantially higher pre-shock earnings than women, which could explain the different effects to some extent. Panels B and C additionally provide evidence that health shocks have stronger effects on labor market outcomes of individuals with higher education levels and for those who work in managerial or professional jobs. Again, differences, in income prior to the health shock can potentially explain the larger effects for these two groups. Finally, the results in Panel D do not indicate that the effects differ largely across age groups.
Discussion and conclusions
The findings in this study provide evidence that health shocks significantly affect the labor market outcomes of individuals in the UK for several years after the decline in health. García-Gómez et al. [24] suggest that negative effects of health shocks on labor markets can exist either due to incentives created by disability benefits or due to labor market institutions constraining the responsiveness of wages to reduced productivity. Given that the disability benefit scheme in the UK provides benefits at a flat rate, it creates very little incentives for individuals to voluntary reduce their employment compared to other countries, which provide disability benefits that are closely tied to previous earnings [58]. This suggests that the observed reductions in labor market participation following health shocks are not driven by incentives provides by disability benefits.
This paper shows that the declines are not entirely driven by changes in employment status, but are also observable for individuals who remained employed. Addi-tionally, the study provides first evidence that changes in work productivity is a mechanism through which health shocks lead to lower labor earnings. Individuals who suffer
Table 10 heterogeneous effects of health shocks on earnings (health status)
Robust standard errors, clustered by individuals and based on Abadie and Imbens [1], are shown in parentheses. Income is adjusted for inflation, using the UK. Consumer price Index and 2000 as the base year
*p < 0.10, **p < 0.05, ***p < 0.01
Total labor income (£ per year)
3-year 5-year 7-year 9-year Panel A: gender
Male − 2535.31*** (615.30) − 6576.00*** (608.28) − 5552.71*** (721.11) − 3248.65*** (517.66) Female − 615.02 (584.40) − 1351.57*** (506.31) − 1310.93*** (446.87) − 2131.27*** (649.38) Panel B: education
Advanced degree − 2157.03*** (523.83) − 3166.42*** (572.38) − 3255.57*** (555.75) − 3151.08*** (863.72) Basic degree/low education − 935.79** (418.38) − 1253.72*** (367.72) − 2592.76*** (497.77) − 2771.53*** (404.12) Panel C: job classification
Managerial/professional job − 1966.34*** (722.16) − 3411.18*** (714.28) − 3250.00*** (965.94) − 6507.92*** (698.68) Skilled labor 150.67 (386.22) − 2066.42*** (447.94) − 433.09 (554.37) − 2436.33*** (680.92) Unskilled labor 289.68 (844.24) − 1349.32*** (459.43) − 91.13 (1142.81) − 2079.77*** (475.26) Panel D: age
[image:14.595.50.547.72.273.2]sudden health declines are shown to be limited in work-related activities and to have difficulties concentrating in the following years, suggesting lower levels of work pro-ductivity and the inability to complete the same tasks the were able to perform before the health shock. Given that my results suggest that the negative effects on work pro-ductivity are still observable several years after the health shock, policymakers and employers should think about ways how the reintegration of employees can be improved and significant productivity loss can be avoided.
Additionally, despite the provision of universal health care through the NHS in the UK, I find significant increases in the likelihood with which individuals pay for health care services following the onset of a health shock. A likely explanation for this might be that individuals want to forego long waiting times before receiving treatment and decide to pay for private care. The NHS has been dealing with the issue of long waiting times for several decades. Using official data from the NHS, Murray [42] shows that 2015 marked the first year since the introduction of the NHS in which the standard that at least 92% of patients receive their treatment within 18 weeks was not achieved, suggesting that the issue is becoming worse over time. Thus, policymakers should discuss ways on how to stop the trend of increasing waiting times since they can cause further harm to individu-als suffering health shock by affecting household incomes, financial stress and overall well-being in the following years.
Previous data on the overall level of health for the UK population is mixed. A report of the Economist Intelligence Unit that compares healthcare inputs and outcomes across 166 countries ranked the UK 23rd in terms of performance [19]. A report by the Commonwealth Fund in 2014 places the UK second to last in the ‘healthy lives’ category, which uses indicators of population health outcomes, including mortality, infant mortality and life expectancy [17]. Evidence from the Global Burden of Disease Study shows that the leading risk factors for premature death in the UK are linked to lifestyle, in particular to dietary risk, tobacco smoking, high blood pres-sure, and alcohol consumption [30]. Given that these causes are preventable, campaigns to promote healthier lifestyles and make people more aware of health risks could be success-ful in improving health outcomes and in preventing the onset of sudden health shocks for people in the workforce. Since 1998, the UK government has had success in reducing smok-ing of the population from 28 to 18% in 2015. It has done so by changing taxation, by increasing public awareness of the harm caused by smoking and by helping people quit [6]. These policy interventions should be continued and expanded to other lifestyle choices that cause harm to people’s health.
Acknowledgements I would like to thank the participants at the Col-lege of Business Brown Bag Seminar Series at the University of West Florida as well as the participants of the session “Labor Economics”
at the Southern Economics Annual Conference in Tampa, Florida in November 2017.
Compliance with ethical standards
Conflict of interest The author declares that he has no conflict of inter-est.
Open Access This article is distributed under the terms of the Crea-tive Commons Attribution 4.0 International License (http://creat iveco mmons .org/licen ses/by/4.0/), which permits unrestricted use, distribu-tion, and reproduction in any medium, provided you give appropriate credit to the original author(s) and the source, provide a link to the Creative Commons license, and indicate if changes were made.
References
1. Abadie, A., Imbens, G.W.: Large sample properties of match-ing estimators for average treatment effects. Econometrica. 74, 235–267 (2006)
2. Abadie, A., Imbens, G.: On the failure of the bootstrap for match-ing estimators. Econometrica 76(6), 1537–1557 (2008)
3. Abadie, A., Imbens, G.: Matching on the estimated propensity score. Econometrica 84(2), 781–807 (2016)
4. Adda, J., Banks, J., von Gaudecker, H.-M.: The Impact of income shocks on health: evidence from cohort data. J. Eur. Assoc. 7(6), 1361–1399 (2009)
5. Antikainen, R., Lönnqvist, A.: Knowledge Work Productivity Assessment. Institute of Industrial Management, Tampere Uni-versity of Technology (2006)
6. Arie, S.: Is the UK government still serious about reducing smok-ing? BMJ Clin. Res. 356, j1426 (2017)
7. Au, D., Crossley, T., Schellhorn, M.: The effects of health shocks and long-term health on the work of older Canadians. Health Econ. 14, 999–1018 (2005)
8. Becker, S., Ichino, A.: Simple and bias-corrected matching estima-tors for average treatment effects in STATA. Stata J. 1(1), 1–18 (2002)
9. Bound, J., Schoenbaum, M., Stinebrickner, T.R., Waidmann, T.: The dynamic effects of health on the labor force transitions of older workers. Lab. Econ. 6, 179–202 (1999)
10. Case, A., Lubotsky, D., Paxson, C.: Economic status and health in childhood: the origins of the gradient. Am. Econ. Rev. 92(5), 1308–1334 (2002)
11. Charles, K.K.: The longitudinal structure of earnings losses among work-limited disabled workers. J. Hum. Resour. 38(3), 618–646 (2003)
12. Contoyannis, P., Rice, N.: The impact of health on wages: evi-dence from the British household panel survey. Empir. Econ. 26, 599–622 (2001)
13. Currie, J., Stabile, M.: Socioeconomic status and child health: why is the relationship stronger for older children? Am. Econ. Rev. 93(5), 1813–1823 (2003)
14. Currie, A., Shield, M.A., Price, S.W.: The child health/family income gradient: evidence from England. J. Health Econ. 26, 212–232 (2007)
15. Currie, J., Duque, V., Garfinkel, I.: The great recession and moth-er’s health. Econ. J. 125(588), F311–F346 (2015)
16. Dano, A.M.: Road injuries and long-run effects on income and employment. Health Econ. 14(9), 955–970 (2005)
Compares Internationally. New York: The Commonwealth Fund: 2014. (2014). http://www.commo nweal thfun d.org/~/media /files /publi catio ns/fund-repor t/2014/jun/1755_davis _mirro r_mirro r_2014.pdf. Accessed 15 May 2017
18. Disney, R., Emmerson, C., Wakefield, M.: Ill-health and retire-ment in britain: a panel data-based analysis. J. Health Econ. 25, 621–649 (2006)
19. Economist Intelligence Unit. http://state ofref orm.com/wp-conte nt/ uploa ds/2015/11/Healt hcare -outco mes-index -2014.pdf. Accessed 16 May 2017 (2014)
20. Eliason, M., Storrie, D.: Does job loss shorten life? J. Hum. Resour 44(2), 277–302 (2009)
21. Eliason, M., Storrie, D.: Job loss is bad for your health: Swedish evidence on cause-specific hospitalization following involuntary job loss. Soc. Sci. Med. 68(8), 1396–1406 (2009)
22. García-Gómez, P., López-Nicolás, A.: health shocks, employ-ment and income in the spanish labour market. Health Econ. 15, 997–1009 (2006)
23. García-Gómez, P.: Institutions, health shocks and labour outcomes across Europe. J. Health Econ. 30(1), 200–213 (2011)
24. García-Gómez, P., van Kippersluis, H., O’Donnell, O., van Doorslaer, E.: Long term and spillover effects of health shocks on employment and income. J. Hum. Resour. 48(4), 873–909 (2013) 25. Grossman, M.: On the concept of health capital and the demand
for health. J. Polit. Econ. 80(2), 223–255 (1972)
26. Hagan, R., Jones, A.M., Rice, N.: Health shocks and the hazard rate of early retirement in the ECHP. Swiss J. Econ. Stat. 144, 323–335 (2008)
27. Halkos, G., Bousinakis, D.: The effect of stress and satisfaction on productivity. Int. J. Prod. Perform. Manag. 59(5), 415–431 (2010) 28. Heckman, J.J., Ichimura, H., Todd, P.: Matching as an econometric
evaluation estimator. Rev. Econ. Stud. 65, 261–294 (1998) 29. Idler, E.L., Benyamini, Y.: Self-rated health and mortality: a
review of twenty-seven community studies. J. Health Soc. Behav.
38(March), 21–37 (1997)
30. Institute for Health Metrics and Evaluation.: Global Burden of Disease Profile: United Kingdom. Seattle: Institute for Health metrics and Evaluation: 2015. (2015). http://www.healt hdata .org/ unite d-kingd om. Accessed 16 May 2017
31. Jiménez-Martín, S., Labeaga, J.M., Prieto, V.C.: A sequential model of older workers’ labor force transitions after a health shock. Health Econ. 15, 1033–1054 (2006)
32. Jones, A.M., Rice, N., Roberts, J.: Sick of work or too sick to work? Evidence on self-reported health shocks and early retire-ment from the BHPS. Econ. Model. 27(4), 866–880 (2010) 33. Johnston, D.W., Propper, C., Shields, M.A.: Comparing subjective
and objective measures of health: evidence for the income/health gradient. J Health Econ. 28, 540–552 (2009)
34. Khanam, R., Nghiem, H.S., Connelly, L.B.: Child health and the income gradient: evidence from Australia. J. Health Econ. 28(4), 805–817 (2009)
35. Lechner, M., Vazquez-Alvarez, R.: The effect of disability on labour market outcomes in Germany. Appl. Econ. 43(4), 389–412 (2011)
36. Lindeboom, M., Llena-Nozal, A., van der Klaauw: Health shock, disability and work. Lab. Econ. 43, 186–200 (2016)
37. Marcus, J.: The effect of unemployment on the mental health of spouses—evidence from plant closures in Germany. J. Health Econ. 32, 546–558 (2013)
38. McInerney, M., Mellor, J.M.: Recessions and seniors’ health, health behaviors, and healthcare use: analysis of the medicare current beneficiary survey. J. Health Econ. 31, 744–751 (2012) 39. McInerney, M., Mellor, J.M., Nicholas, L.H.: Recession
depres-sion: mental health effects of the 2008 stock market crash. J. Health Econ. 32, 1090–1104 (2013)
40. Miller, D.L., Page, M.E., Stevens, A.H., Filipski, M.: Why are recessions good for your health? Am. Econ. Rev. 99(2), 122–127 (2009)
41. Mora, R., Reggio, I.: Didq: A Command for treatment-effect estimation under alternative assumption. Stata J. 15(3), 796–808 (2015)
42. Murray, R.: What is Happening to NHS Waiting Times? The King’s Fund. (2016). https ://www.kings fund.org/blog/2016/-2/ nhs-waiti ng times . Accessed 16 May 2017
43. Myde, B., Pelletier, B., Lynch, W.: The relationship between health risks and work productivity. J. Occup. Environ. Med. 46(7), 737–745 (2004)
44. Neumayer, E.: recessions lower (some) mortality rates: evidence from Germany. Soc. Sci. Med. 58(6), 1037–1047 (2004) 45. Nielsen, T.H.: The relationship between self-rated health and
hos-pital records. Health Econ. 25, 497–512 (2016)
46. Pelkowski, J., Berger, M.C.: The impact of health on employment, wages, and hours worked over the life cycle. Q. Rev. Econ. Fin.
44, 102–121 (2004)
47. Propper, C., Rigg, J., Burgess, S.: Child health: evidence on the roles of family income and maternal mental health from a UK birth cohort. Health Econ. 16, 1245–1269 (2007)
48. Reinhold, S., Jürges., H.: Parental income and child health in Ger-many. Health Econ. 21(5), 562–579 (2012)
49. Riphahn, R.: Income and employment effects of health shocks. a test case for the German welfare state. J. Popul. Econ. 12(3), 363–389 (1999)
50. Rosenbaum, P.R., Rubin, D.B.: The central role of the propen-sity score in observational studies for causal effects. Biometrika.
70(1), 41–55 (1983)
51. Ruhm, C.J.: Are recessions good for your health? Q. J. Econ.
115(2), 617–650 (2000)
52. Schaller, J., Stevens, A.H.: Short-run effects of job loss on health conditions, health insurance, and health care utilization. J. Health Econ. 43, 190–203 (2015)
53. Schmitz, H.: Why are the unemployed in worse health? The causal effect of unemployment on health. Lab. Econ. 18, 71–78 (2011) 54. Smith, J.P.: Unraveling the SES: Health Connection. Population
and Development Review 30; Supplement: Aging, Health, and Public Policy (pp. 108–132)(2004)
55. StataCorp.: Stata Treatment-Effects Reference Manual: Potential Outcomes/Counterfactual Outcomes: Release 13. Statistical Soft-ware. College Station, TX: StataCorp LP (2013)
56. Sullivan, D., von Wachter, T.: (2009). Job displacement and mortality: an analysis using administrative data. Q. J. Econ. 1265–1306
57. Van Doorslaer, E., Wagstaff, A., van der Burg, H., Christiansen, T., De Graeve, D., Duchesne, I., Gerdtham, U.-G., Gerfin, M., Geurts, J., Gross, L., Häkkinen, U., John, J., Klavus, J., Leu, R.E., Nolan, B., O’Donnell, O., Propper, C., Puffer, F., Schellhorn, M., Sundberg, G., Winkelhake, O.: Equity in the delivery of health care in Europe and the US. J. Health Econ. 19, 553–583 (2000) 58. Van Doorslaer, E., Koolman, X.: Explaining the differences in
income-related health inequalities across European countries. Health Econ. 13, 609–628 (2004)
59. Vizard, P., Obolenskaya, P.: Labour’s Record on Health: Policy Spending and Outcomes. Social Policy in a Cold Climate Working Paper WP02. London: CASE (2013)