City, University of London Institutional Repository
Citation
:
Algaith, A., Elia, I. A., Gashi, I. and Vieira, M. R. (2017). Diversity with Intrusion
Detection Systems: An Empirical Study. In: 2017 IEEE 16th International Symposium on
Network Computing and Applications (NCA). . IEEE. ISBN 978-1-5386-1465-5
This is the accepted version of the paper.
This version of the publication may differ from the final published
version.
Permanent repository link:
http://openaccess.city.ac.uk/18335/
Link to published version
:
http://dx.doi.org/10.1109/NCA.2017.8171327
Copyright and reuse:
City Research Online aims to make research
outputs of City, University of London available to a wider audience.
Copyright and Moral Rights remain with the author(s) and/or copyright
holders. URLs from City Research Online may be freely distributed and
linked to.
1
Diversity with Intrusion Detection Systems: An
Empirical Study
Areej Algaith
1, Ivano Alessandro Elia
2, Ilir Gashi
1, Marco Vieira
2 1Centre for Software Reliability, City, University of London, UK2University of Coimbra, Portugal
{Areej.Algaith.1, Ilir.Gashi.1}@city.ac.uk; {ivanoe, mvieira}@dei.uc.pt
Abstract— Defence-in-depth is a term often used in security literature to denote architectures in which multiple security protection systems are deployed to defend the valuable assets of an organization (e.g. the data and the services). In this paper we present an approach for analysing defence-in-depth, and illustrate the use of the approach with an empirical study in which we have assessed the detection capabilities of intrusion detection systems when deployed in diverse, two-version, parallel defence-in-depth configurations. The configurations have been assessed in settings that favour detection of attacks (reducing false negatives), as well as settings that favour legitimate traffic (reducing false positives).
Keywords— diversity analysis; security analysis; quantitative assessment; intrusion detection systems;
I. INTRODUCTION
An important part of design for security is defence in depth, consisting of “layers” of defence that reduce the probability of successful attacks. Guidance documents now advocate defence in depth as an obvious need1, but their qualitative guidance ignores the decision problems. Crucially, these questions concern diversity: defences should be diverse in their weaknesses. Any attack that happens to defeat one defence should with high probability be stopped or detected by another one. Ultimately, diversity and defence in depth are two facets of the same defensive design approach. The important questions are not about defence in depth being "a good idea", but about whether a set of specific defences would improve security more than another set; and about – if possible – quantifying the security gains. In this paper, we present analysis approach to help analysts with these decision problems. We illustrate the use of the approach with data from an empirical study with multiple Intrusion Detection Systems (IDSs). We study the effects that using diverse IDSs has on the detection of attacks (false negatives), and on allowing legitimate traffic to go through (false positives).
We utilize a dataset [1]2 from an experiment by two of the authors of this paper in which an attack injection methodology was used, consisting of injecting realistic vulnerabilities in three web applications (MyReferences, phpBB and TikiWiki) and performing attacks that attempt to exploit those vulnerabilities. To protect these web applications, four diverse IDS products were deployed (Apache Scalp, Anomalous Character Distribution (ACD) monitor, GreenSQL and Snort).
1www.nsa.gov/ia/_files/support/defenseindepth.pdf 2 Full dataset of [1] is available from: https://goo.gl/MDOhsw
Some of these IDSs were configured in different ways (depending, for example, on the rulesets they used and the threshold for identifying malicious requests), which produced 9 different IDS configurations (five ACD variants, one Apache Scalp, one GreenSQL and two Snorts). [1] presents analysis of the performance of individual IDSs.
The focus of the new work is on two-system diversity: combining two IDSs in a parallel configuration, i.e. both systems inspect all the inputs and pass their individual decisions to a voter. We chose to study two-system configurations as this is the minimum amount of diversity that an organization can deploy to help it improve security, and they carry the least additional cost in complexity and deployment. Since we have 9 different IDS product configurations, we can construct 36 distinct two-version IDS combinations (9C
2 = 36). Each system is asked whether a given input is malicious or not. Hence, we use the conventional statistical measures of the performance of a binary classification test3 (i.e. Sensitivity - True Positive rate, and Specificity - True Negative rate and Accuracy). We analysed these measures for each of the 36 combinations of IDSs for each of the three web applications.
In this paper we describe the analysis methodology, provide a summary of the main findings and give a snapshot of the most interesting results. Throughout the paper we refer the interested reader to the full results that are available as an extended technical report [2]. The analysis approach followed in this paper provides a methodology for decision making when configuring defence-in-depth architectures. Hence, it is easily transferrable to other datasets.
The structure of the paper is as follows: Section II describes the dataset and our analysis method. Section III provides the main results of our analysis. Section IV introduces related work and Section V presents conclusions and limitations.
II. EXPERIMENTAL SETUP AND ANALYSIS METHODOLOGY The data used for the diversity analysis is from an experiment conducted by two of the authors of this paper [1]. The previous analysis assessed IDSs in terms of their capability of detecting SQL Injection attacks. SQL Injection attacks continue to be the most prevalent and typical threat for web applications, as they have been for the last decade4. In order to produce realistic SQL Injection attacks to test the IDSs a Vulnerability and Attack Injection technique was used.
2 This technique allowed the introduction of realistic vulnerabilities in the code of a web application by code mutation (Vulnerability injection) and afterwards to automatically exploit those vulnerabilities by performing SQL injection attacks (Attack Injection). The injected vulnerabilities are considered realistic because they were based on an extensive field study on real web application vulnerabilities [3]. The vulnerability and attack injection tool5 runs on a Ubuntu virtual machine, configured to inject vulnerabilities in a set of three web applications. The IDSs under test were deployed in the same virtual machine, and exposed to attacks generated by the attack injector and to non-malicious interactions carried out through a web crawler. The experimental setup described in [1] included 4 different IDSs: - Anomalous Character Distribution (ACD) monitor – an
anomaly-based tool that works at the application level. It analyses the Apache access log [4]. The user must define the deviation threshold that separates the requests identified as malicious from those considered benign. The threshold values used are: 1, 3, 10, 30, and 100. We refer to these IDSs configurations as ACD1, ACD3, ACD10, ACD30 and ACD100, and label them 1A-5A respectively (“A” stands for “Application” type IDS).
- GreenSQL (version 1.2.2) – a database proxy that monitors the SQL traffic and detects attacks targeting the database. We used the open source version of the tool6. We label it as 6D in our analysis (“D” standing for “Database” IDS). - Apache Scalp (version 0.4)7 – a signature-based apache
access log analyser. We refer to it as SCALP sqlia (SQL Injection Attacks) and label it 7A in the graphs and tables. - Snort (versions 2.8.4.1) (snort.org) is a signature based
network level IDS. In [1] the analysis was performed using two configurations: using only the official community rule set; and using a set of experimental Customized Rules provided in [6]). We labelled them 8N and 9N (“N” standing for “Network”).
The experimental setup described in [1] includes three web applications: MyReferences, TikiWiki, and phpBB, which allowed the assessment of IDS performance with different types of applications (MyReferences is small; TikiWiki and phpBB are large open source projects).
- MyReferences is a bibliographic references management web application. The application was developed by the authors of [1]. It provides functionality for editing and querying documents and publications metadata.
- TikiWiki (tiki.org) – a widely used Content Management System (CMS) platform that allows collaborative contribution of website contents in a wiki style.
- phpBB (phpBB.com) – a widely used forum solution.
Table I shows the total number of benign demands (crawling actions) and successful attacks8 for each application. Each IDS inspected the same traffic for each application.
5https://github.com/JoseCarlosFonseca/Vulnerability-and-Attack-Injector 6https://github.com/larskanis/greensql-fw. For a commercial version see [5]. 7https://code.google.com/archive/p/apache-scalp/
8 As stated in [1], some attacks that were “unsuccessful”, i.e. they did not lead
to an exploit of the vulnerability. In this paper we only consider the successful
TABLE I. THE COUNTS OF CRAWLING ACTIONS TRAFFIC AND SUCCESSFUL ATTACKS TRAFFIC PER WEB APPLICATION
Web Application IDS Crawling Actions Successful Attack
MyReferences 9 45 136
phpBB 9 97 245
TikiWiki 9 80 76
As with any binary decision system, we can classify the decisions of an IDS into four classes:
- For benign input: False Positive (FP): the IDS, incorrectly, flags a benign input as malicious; True Negative (TN): the IDS, correctly, flags a benign input as not malicious. - For attacks: False Negative (FN): the IDS, incorrectly, flags
an attack as malicious; True Positive (TP): the IDS, correctly, flags an attack as malicious.
As we mentioned previously, we used the conventional measures for the performance of a binary classification test: Sensitivity, Specificity and Accuracy. Many other measures can be derived from these or the FN, FP, TN and TP counts.
Table II presents the 9 configurations of the IDSs, the labels we will use to refer to them in the graphs in the rest of the paper, and the Sensitivity and Specificity for each of the three applications. These were already provided in [1].
TABLE II. THE 9DISTINCT IDSDEPLOYMENTS
Label IDS Name MyReferences phpBB TikiWiki
Sens. Spec. Sens. Spec. Sens. Spec.
1A ACD1 0.89 0.76 0.93 0.37 0.49 0.48
2A ACD3 0.61 0.84 0.22 0.68 0.24 0.75
3A ACD10 0.35 1 0.07 0.99 0.20 0.99
4A ACD30 0.27 1 0.04 1 0.20 1
5A ACD100 0.10 1 0.02 1 0.00 1
6D GREENSQL 0.12 1 0.63 1 1 1
7A SCALP sqlia 0.25 0.91 0 1 0.21 1
8N SNORT 2.8 0 1 0 1 0 1
9N SNORT 2.8 plus CR 0.59 1 1 1 0.5000 1 In our work we extend the analysis from the viewpoint of diversity. From the 9 IDS configurations, we can build a total of 36 two-version combinations (9C
2). The decision that a two-version IDS system would make on a given input will depend on how it does the voting on the results it receives from each of the individual systems. We therefore have two types of configurations for each of the 36 combinations:
- 1-out-of-2 (abbreviated 1oo2): an input is labelled malicious as long as any one of the two IDSs in a system determines that the input is malicious;
- 2-out-of-2 (abbreviated 2oo2): an input is labelled malicious only if both IDS in the pair determine that the input is malicious.
Receiver Operating Characteristic9 (ROC) curves are usually used to analyse the decisions of a binary classifier, and determine how a threshold should be set for a decision system to maximize the TP and minimize the FP rates. The systems in our study are already pre-configured, hence the ROC plots show only a point for each system. All the points for single and diverse systems are shown in the same plot to visualize which systems are configured most optimally for a given application.
attacks, since we were uncertain on how to classify the behavior of an IDS if it does not raise an alarm for an attack that is not successful.
3 III. DIVERSITY RESULTS
A. Overall Analysis by Type of IDS Combination
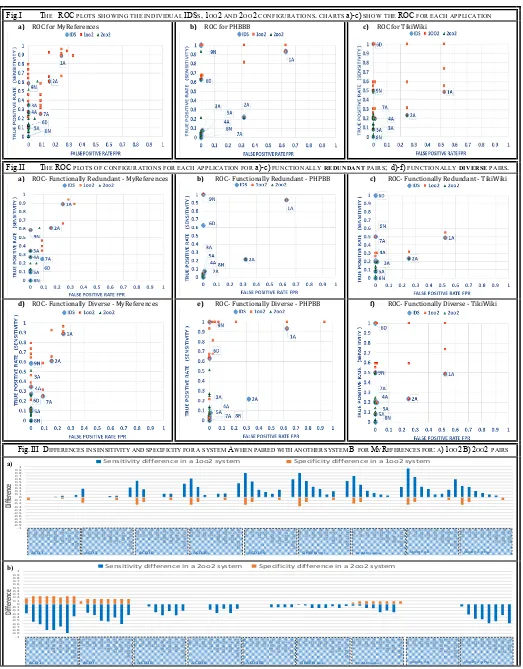
The technical report [2] contains tables outlining the full results for each of the applications that show the FP, TN, FN and TP values for the 1oo2 and 2oo2 system configurations. Figure I shows the three ROC plots that were constructed using these values: one for each of the three applications (MyReferences, phpBB and TikiWiki). On each plot: the blue diamonds represent the single IDS systems; the orange squares represent the 1oo2 systems; the green triangles represent the 2oo2 systems. The most optimal system in an ROC plot is one that appears on the top left-hand corner (i.e. with a true positive rate of 1 and a false positive rate of 0). We have one such system for phpBB and TikiWiki, but none for MyReferences. We observe that, compared with the best individual systems: the 1oo2 systems are better at detecting attacks (higher true positive rate); 2oo2 systems are better at correctly labelling benign traffic (lower FP rates). This is to be expected as:
- 1oo2 systems will in all cases perform: better or equal to the best single system in the pair for malicious traffic, as any alarm from either IDS will lead to an alarm in a 1oo2 system; equal or worse than the worst single system in the pair for benign traffic, as any alarm from either system for benign traffic will be incorrectly labelled as malicious.
- 2oo2 systems will in all cases perform: better or equal to the best single system for benign traffic as the 2oo2 system only raises an alarm for benign traffic if both systems in the pair do so; equal or worse than the worst single system in the pair for malicious traffic, as the 2oo2 system will only raise an alarm if both the systems in the pair do so.
What is important is how much better, or how much worse, would a diverse pair perform in these setups, and ROC curves allow us to assess these differences. Figure II gives ROCs per application again, but now we have split the points of the “functionally redundant” pairs (subfigures a-c) - those when two individual systems in the pair are of the same type (15 Application-only (AA); and 1 Network-only (NN) pairs); and “functionally diverse” (sub-figures d-f) pairs - those where the IDSs are of different types (12 Application and Network (AN); 6 Application and Database (AD): and 2 Database and Network (DN) pairs). Overall, we see that the functionally diverse pairs are performing better than functionally redundant pairs (as evident by more 1oo2 systems (squares) appearing in the top half of the plot, and more 2oo2 systems (triangles) appearing on the left of the plot in subfigures d-f, compared with those in a-c).
B. Differences Over a Single IDS Setup
So far the results are useful for a decision maker who choses any two IDSs for a diverse setup. However, organizations may already be using an IDS, and costs of switching to a different pair of IDSs may be prohibitively high (in terms of licensing, re-training staff, etc.) For these organizations it may be useful to know which IDS B they should choose to run alongside their existing IDS A in a diverse 1oo2 or 2oo2 AB setup. Figure III shows results for this type of comparison for MyReferences application. For
each IDS, we show the improvements (positive values in the y-axis), or deterioration (negative values in the y-y-axis), in Sensitivity (blue bars) and Specificity (orange bars) for 1oo2 (sub-figure a), and 2oo2 (sub-figure b). Each IDS can be paired with 8 other IDSs in our study. Thus, the blue boxes on the x-axis show the improvements for each IDS. Using the left-most box in subfigure a) as an example, the first orange bar shows the deterioration in specificity that a user of ACD1 would observe if they switched to a 1oo2 setup ACD1-ACD3. Since there is no corresponding blue bar it means there is no improvement in sensitivity for users of ACD1 from switching to a 1oo2 ACD1-ACD3 configuration. Note that for users of ACD3 the observation could be different, and indeed it is, as can be seen from the first bar in the second blue-box (ACD3).
From Figure III (a), for 1oo2 setups,we observe:
- For application-based IDSs, pairing with a functionally diverse IDS (“GreenSQL” or “Snort 2.8 plus Custom Rules”), in a 1oo2 setup brings considerable improvements in sensitivity at no cost to specificity;
- For GreenSQL (database IDS) pairing with the functionally-diverse “Snort 2.8 plus Custom Rules”, ACD10, ACD30 and ACD100 in a 1oo2 setup brings considerable improvements in sensitivity at no cost to specificity.
- For “Snort 2.8 plus Custom Rules” pairing with the functionally-diverse ACD10, ACD30 and ACD100, or with GreenSQL leads to improvements in sensitivity at no cost to specificity.
These observations about functional diversity pairings are consistent for phpBB and TikiWiki also (results are in [2]).
In 2oo2 setups (part (b) of Figure III) we observe some improvements in specificity but these are in most cases far outweighed by the significant deteriorations in sensitivity.
C. Averages for Different Diverse Setups
We conclude our analysis with a summary table (Table III) showing the average Sensitivity, Specificity and Accuracy for single IDSs compared with those for 1oo2 and 2oo2 configurations. We have subdivided these averages by type of configurations, and show them for each application. These results confirm the observations we have presented so far. For 1oo2 systems: improvements in sensitivity compared with individual systems are around 60% on average for the three applications, but come with around 10% specificity deterioration on average. For 2oo2 systems: improvements in specificity compared with individual systems are around 10% on average for the three applications, but come with around 60% sensitivity deterioration on average. The largest improvements for both setups are for functionally diverse pairs.
IV. RELATED WORK
4
Fig.I THE ROC PLOTS SHOWING THE INDIVIDUAL IDSS,1OO2 AND 2OO2 CONFIGURATIONS. CHARTS a)-c) SHOW THE ROC FOR EACH APPLICATION
a) ROC for MyReferences b) ROC for PHBBB c) ROC for TikiWiki
Fig.II THE ROC PLOTS OF CONFIGURATIONS FOR EACH APPLICATION FOR a)-c) FUNCTIONALLY REDUNDANT PAIRS; d)-f) FUNCTIONALLY DIVERSE PAIRS.
a) ROC- Functionally Redundant - MyReferences b) ROC- Functionally Redundant - PHPBB c) ROC- Functionally Redundant - TikiWiki
d) ROC- Functionally Diverse - MyReferences e) ROC- Functionally Diverse - PHPBB f) ROC- Functionally Diverse - TikiWiki
Fig.III DIFFERENCES IN SENSITIVITY AND SPECIFICITY FOR A SYSTEM A WHEN PAIRED WITH ANOTHER SYSTEM B FOR MYREFERENCES FOR: A)1OO2B)2OO2 PAIRS
-1 -0.9 -0.8 -0.7 -0.6 -0.5 -0.4 -0.3 -0.2 -0.10 0.1 0.2 0.3 0.4 0.5 0.6 0.7 0.8 0.91 AC D3 AC D1 0 AC D3 0 AC D1 00 GR EE NS QL SC AL P sq lia SN OR T 2. 8 SN OR T 2. 8 Pl us AC D1 AC D1 0 AC D3 0 AC D1 00 GR EE NS QL SC AL P sq lia SN OR T 2. 8 SN OR T 2. 8 Pl us AC D1 AC D3 AC D3 0 AC D1 00 GR EE NS QL SC AL P sq lia SN OR T 2. 8 SN OR T 2. 8 Pl us AC D1 AC D3 AC D1 0 AC D1 00 GR EE NS QL SC AL P sq lia SN OR T 2. 8 SN OR T 2. 8 Pl us AC D1 AC D3 AC D1 0 AC D3 0 GR EE NS QL SC AL P sq lia SN OR T 2. 8 SN OR T 2. 8 Pl us AC D1 AC D3 AC D1 0 AC D3 0 AC D1 00 SC AL P sq lia SN OR T 2. 8 SN OR T 2. 8 Pl us AC D1 AC D3 AC D1 0 AC D3 0 AC D1 00 GR EE NS QL SN OR T 2. 8 SN OR T 2. 8 Pl us AC D1 AC D3 AC D1 0 AC D3 0 AC D1 00 GR EE NS QL SC AL P sq lia SN OR T 2. 8 Pl us AC D1 AC D3 AC D1 0 AC D3 0 AC D1 00 GR EE NS QL SC AL P sq lia SN OR T 2. 8 Di ffe re nc e
Sensitivity difference in a 1oo2 system Specificity difference in a 1oo2 system
ACD1 ACD3 ACD10 ACD30 ACD100 GREEN SQL SCALP sqalia SNORT 2.8 SNORT 2.8 Plus
-1 -0.9 -0.8 -0.7 -0.6 -0.5 -0.4 -0.3 -0.2 -0.1 0 0.1 0.2 0.3 0.4 0.5 0.6 0.7 0.8 0.9 1 AC D3 AC D1 0 AC D3 0 AC D1 00 GRE EN SQ L SC AL P sq lia SN O RT 2 .8 SN O RT 2 .8 P lu s AC D1 AC D1 0 AC D3 0 AC D1 00 GRE EN SQ L SC AL P sq lia SN O RT 2 .8 SN O RT 2 .8 P lu s AC D1 AC D3 AC D3 0 AC D1 00 GRE EN SQ L SC AL P sq lia SN O RT 2 .8 SN O RT 2 .8 P lu s AC D1 AC D3 AC D1 0 AC D1 00 GRE EN SQ L SC AL P sq lia SN O RT 2 .8 SN O RT 2 .8 P lu s AC D1 AC D3 AC D1 0 AC D3 0 GRE EN SQ L SC AL P sq lia SN O RT 2 .8 SN O RT 2 .8 P lu s AC D1 AC D3 AC D1 0 AC D3 0 AC D1 00 SC AL P sq lia SN O RT 2 .8 SN O RT 2 .8 P lu s AC D1 AC D3 AC D1 0 AC D3 0 AC D1 00 GRE EN SQ L SN O RT 2 .8 SN O RT 2 .8 P lu s AC D1 AC D3 AC D1 0 AC D3 0 AC D1 00 GRE EN SQ L SC AL P sq lia SN O RT 2 .8 P lu s AC D1 AC D3 AC D1 0 AC D3 0 AC D1 00 GRE EN SQ L SC AL P sq lia SN O RT 2 .8 Di ffe re nc e
Sensitivity difference in a 2oo2 system Specificity difference in a 2oo2 system
ACD1 ACD3 ACD10 ACD30 ACD100 GREEN SQL SCALP sqalia SNORT 2.8 SNORT 2.8 Plus
a)
[image:5.595.33.556.48.717.2]5 TABLE III. THE AVERAGE SENSITIVITY,SPECIFICITY AND
ACCURACY FOR SINGLE IDSS AND THE 1OO2 AND 2002 PAIRS
SQL Injection vulnerabilities exist due to user inputs that are not adequately validated, and are considered one of the most dangerous type of attacks for web applications [14], [15], [16]. Several works try to provide a comprehensive analysis of IDSs for SQL injection (see survey in [17]). Given the relevance of these attacks, countermeasures have been investigated [18], [19], especially those capable of runtime detection and prevention of intrusions [20, 21].
V. CONCLUSIONS,LIMITATIONS AND FURTHER WORK In this paper we presented a well-documented, step-by-step analysis methodology for assessing the performance of two-version security decision support systems, which allows researchers and organizations to assess diversity in their setups. We illustrated the use of the approach with diverse two-system IDS configurations. The analysis is performed using a previously published dataset [1], using 9 individual IDS configurations that monitor 3 web applications, that were subjected to SQL injection attacks and benign crawling actions. The main conclusions from our analysis are: - For 1oo2 systems: improvements in sensitivity compared
with individual systems are around 60% on average for the three applications, but come with around 10% specificity deterioration on average. The largest improvements in sensitivity, with the least deterioration in specificity are from functionally-diverse pairs of IDSs; - For 2oo2 systems: improvements in specificity compared with individual systems are around 10% on average for the three applications, but come with around 60% sensitivity deterioration on average.
There are a few limitations of the dataset we have used, that may influence our observations:
- The dataset was gathered in 2010 and is limited to SQL
Injections. However, as we mentioned previously, SQL Injection attacks continue to be the most prevalent and typical threat for web applications, as they have been for the last decade. Moreover, realistic attack datasets are very difficult to create and to the best of our knowledge our dataset is the most realistic SQL injection attack dataset available.
- The dataset is for web applications only. However, web applications are the ones directly exposed to attackers. - The data is generated by a vulnerability and attack
injection tool. Though we should stress that it is difficult to get operational datasets, as organisations rarely share them, so we took extra care to select attacks that were representative of those seen in the field.
Current and future work is to assess the performance of diverse setups with more than two IDSs.
ACKNOWLEDGMENT
This research is supported by the UK EPSRC project D3S (Diversity and defence in depth for security: a probabilistic approach).
REFERENCES
1. Elia, I.A., J. Fonseca, and M. Vieira. Comparing SQL Injection Detection Tools Using Attack Injection: An Experimental Study. in IEEE ISSRE'2010, 2010.
2. Technical report: Diversity with Intrusion Detection Systems
https://www.sugarsync.com/pf/D2156856_368_967293555 3. Fonseca, J., et al., Analysis of Field Data on Web Security
Vulnerabilities. IEEE TDSC, 2014. 11(2): p. 89-100.
4. Kruegel, C. and G. Vigna. Anomaly detection of web-based attacks. 2003. ACM.
5. GreenSql, GreenSQL. GreenSQL, 2016. http://greensql.com 6. Mookhey, K.K. and N. Burghate, Detection of SQL injection and
cross-site scripting attacks. Symantec SecurityFocus, 2004. 7. Littlewood, B. and L. Strigini. Redundancy and diversity in
security. in ESORICS 2004, Springer-Verlag.
8. Garcia, M., et al., Analysis of operating system diversity for intrusion tolerance. Software: Practice and Experience, 2014. 44(6): p. 735-770.
9. Hiltunen, M.A., et al. Survivability through customization and adaptability: the Cactus approach. in DARPA Information Survivability Conference and Exposition, 2000.
10. Reynolds, J., et al. The Design and Implementation of an Intrusion Tolerant System. in DSN 2002, USA.
11. Gupta, V., et al., Dependability and Performance Evaluation of Intrusion-Tolerant Server Architectures, in LADC 2003, p. 81-101. 12. Bishop, et al. Diversity for Security: A Study with Off-the-Shelf
Antivirus Engines. in ISSRE 2011.
13. Milenkoski, A., et al., Evaluating Computer Intrusion Detection Systems: A Survey of Common Practices. ACM Comput. Surv., 2015. 48(1): p. 12:1-12:41.
14. IBM X-Force 2013 Mid-Year Trend and Risk Report. 2013. 15. Acunetix Web Application Vulnerability Report 2015. 2015. 16. Williams, J. and D. Wichers, Top 10 2013-Top 10 - OWASP. 2013. 17. Srivastava, S., A Survey On: Attacks due to SQL injection and their prevention method for web application. IJCSIT International Journal of Computer Science and IT, 2012. 3(1).
18. Halfond, W.G., J. Viegas, and A. Orso. A classification of SQL-injection attacks and countermeasures. 2006.
19. Howard, M. and D. LeBlanc, Writing Secure Code. 2 edition ed. 2004, Redmond, Wash: Microsoft Press. 800.
20. Halfond, W.G.J. and A. Orso. AMNESIA: analysis and monitoring for NEutralizing SQL-injection attacks. 2005. ACM Press. 21. Buehrer, G.T., B.W. Weide, and P.A.G. Sivilotti. Using parse tree