energies
Article
Three-Dimensional Peridynamic Model for Predicting
Fracture Evolution during the Lithiation Process
Hanlin Wang, Erkan Oterkus * and Selda Oterkus
Department of Naval Architecture, Ocean and Marine Engineering, University of Strathclyde, Glasgow G4 0LZ, UK; [email protected] (H.W.); [email protected] (S.O.) * Correspondence: [email protected]; Tel.: +44-141-548-3876
Received: 12 May 2018; Accepted: 31 May 2018; Published: 5 June 2018
Abstract:Due to its large electric capacity, silicon has become one of the most promising electrode materials for lithium ion batteries. However, silicon undergoes large volumetric expansion and material stiffness reduction during the charging process. This can lead to fracture and failure of lithium-ion batteries. Damage formation and evolution inside the electrode are influenced by the lithium ion concentration and electrode material. High stress gradients induced by heterogeneous deformation can lead to massive migration of lithium ions towards high geometrical singularity regions, such as crack edge regions, which increases the lithium ion concentration. Fully coupled mechanical diffusion equations are important in describing the mechanics of this problem. In this study, the three-dimensional peridynamic theory is presented to solve the coupled field problem. In addition, the newly developed peridynamic differential operator concept is utilized to convert partial differential equations into peridynamic form for the diffusion equation. Spherical and cylindrical shaped energy storage structures with different pre-existing penny-shaped cracks are considered to demonstrate the capability of the developed framework. It is shown that peridynamic theory is a suitable tool for predicting crack evolution during the lithiation process.
Keywords:lithium-ion battery; fracture analysis; peridynamics; pressure gradient effect
1. Introduction
In the marine industry, traditional propulsion systems with internal combustion engines cannot match the increasing strict standards for waste gas emissions (MARPOL Annex VI) [1]. Hence, the hybrid propulsion system, as an alternative approach to marine propulsion systems, has become popular in the shipping industry. Marine batteries, as primary energy storage devices, have been subject to excessive investigation [2]. The lithium ion battery is one of the most promising marine batteries due to its high energy to weight ratio, high energy density, low rate of self-discharge and long cycle life [3]. The performance of a lithium ion battery mainly depends on the material properties of its anode, cathode and electrolyte. The carbon group elements, carbon (C), silicon (Si), germanium (Ge), tin (Sn) and their alloys, can be selected as the anode material in lithium ion batteries [4,5]. In many commercial grade lithium ion batteries, graphitic carbon is the main component of the anode material due to its low expansion induced by lithiation during battery charging [4]. However, the major limitation of graphite carbon is its low electric capacity (372 mAhg−1) whereby it stores the lithium ion inside graphite sheets as (LiC6) [4–6] which cannot satisfy the demand for high electric capacity in marine batteries. On the other hand, silicon (Si) and germanium (Ge) have relatively high theoretical capacities as compared to graphite carbon (3579 mAhg−1and 1625 mAhg−1, respectively) [6] which can be considered to be suitable candidates for the anode material in lithium ion batteries. However, both Si and Ge anodes experience large volumetric changes during battery cycling. The Si anode can experience a volume expansion of up to 400% during the charging
Energies2018,11, 1461 2 of 22
process [7,8]. Similar to the Si anode, the Ge anode can expand 370% in volume during the lithiation process [9]. Frequent cycling of the lithium ion battery may lead to stress misdistribution, degradation and delamination of the battery components. This may then lead to failure or even pulverization of the battery anode.
Many efforts have been conducted to increase the electric capacity and to avoid the occurrence of defects inside the electrodes of lithium ion batteries. Winter et al. [10] suggested that some metals, such as aluminum (Al), tin (Sn) and antimony (Sb) can store more lithium ion than graphite carbon by forming alloys with lithium ions. However, the newly formed alloyed anode will experience a 500% volumetric expansion [4], which is the major barrier to becoming the anode material in rechargeable lithium ion batteries. Gao et al. [11] suggested carbon nanotubes as the anode material. Carbon nanotubes are tubular forms of graphite sheet with high conductivity, high tensile strength, high rigidity and low density. They increase the electric capacity of carbon by up to around 600 mAhg−1 without damage or pulverization. Metals or their alloys can also be added into the nanotube in composite form. Hence, the advantage of the high electric capacity of metal alloys and the low volumetric change in graphite carbon can be utilized in anode materials [12,13]. However, carbon nanotubes experience a loss of lithium ion capacity during cycling and a linear voltage drop during discharging [4].
In this study, the two-dimensional fully-coupled peridynamic model developed in Wang et al. [27] is extended to a three-dimensional peridynamic model. The effect of pressure gradient and material phase change during lithiation process (from Si to LixSi) are taken into consideration. Coupled field equations are used to describe the lithiation process with the help of the newly developed peridynamic differential operator [26]. To demonstrate the capability of the model, the fracture evolution inside the cylindrical and spherical shaped lithium ion battery anodes is presented.
2. Coupled Diffusion-Mechanical Deformation Formulation
Fick’s Second Law describes the basic principles of ion diffusion [28]. Due to silicon being the anode material, larger volume expansion occurs as lithium ions diffuse inside the anode. Hence, the diffusion-induced stress during battery cycling should be taken into account in Fick’s Second Law. The mechanical strain component,εMij, can be expressed by considering the influence of lithium ion diffusion as [16,17]:
εMij =εij−αCavgδij (1) where εij refers to the total strain, α represents the coefficient of expansion, Cavg represents the current average concentration value of the interacting material points, andδijis the Kronecker Delta. For three-dimensional cases, the stress-strain constitutive equation can be written as:
σxx σyy σzz σxy σxz σyz = E
(1+ν)(1−2ν)
1−ν ν ν 0 0 0
ν 1−ν ν 0 0 0
ν ν 1−ν 0 0 0
0 0 0 1−2ν
2 0 0
0 0 0 0 1−2ν
2 0
0 0 0 0 0 1−2ν
2
εMxx
εMyy
εMzz 2εMxy 2εMxz 2εMyz
(2)
By substituting Equation (2) into Equation (1), the coupled field normal stresses can be expressed as:
σxx= E
(1+ν)(1−2ν)
(1−ν)εxx+νεyy+νεzz− E
(1−2ν)αCmaxC (3)
σyy= E
(1+ν)(1−2ν)
νεxx+ (1−ν)εyy+νεzz− E
(1−2ν)αCmaxC (4)
σzz =
E
(1+ν)(1−2ν)
νεxx+νεyy+ (1−ν)εzz− E
(1−2ν)αCmaxC (5)
whereCis current value of the normalized lithium ion concentration, andCmaxis the maximum value of the lithium ion concentration. The total normal strain in all three dimensions can be expressed in terms of displacements as:
εxx= ∂u
∂x (6)
εyy= ∂v
∂y (7)
εzz= ∂w
∂z (8)
Energies2018,11, 1461 4 of 22
which will increase the lithium ion concentration. As a result, stress will release as volume expands. Hence, the general Fick’s Second Law should be modified by considering the pressure-gradient as:
∂C
∂t =MkBT
∂2C ∂x2 +
∂2C ∂y2 +
∂2C ∂z2
− MCΩ
NA
∂2eσ
∂x2 + ∂2eσ
∂y2 + ∂2eσ
∂z2
−MCΩ NA
∂C ∂x
∂eσ
∂x+ ∂C ∂y
∂eσ
∂y+ ∂C
∂z ∂eσ
∂z
(9)
where M is the molecular mobility, kB is Boltzmann constant, T is the absolute temperature, NAis Avogadro’s constant andeσis the hydrostatic stress.
Zhang et al. [29] emphasized that silicon has different lithiated stages during the charging process. In the early stage, since lithium ion concentration is low, silicon will transform into partial lithiated silicon (LixSi). As the lithium ion concentration increases, the partially lithiated silicon will further transform into fully lithiated silicon (Li15Si4). Moreover, since some material properties of lithiated silicon, such as the elastic modulus and fracture toughness, are lower than those of pure silicon, the lithiation process can also be regarded as a material softening process [30]. However, the size of the partially lithiated silicon region in a battery anode is very small compared to the anode’s geometry [29]. Therefore, in this study, only fully lithiated silicon was considered.
3. Peridynamic Theory
An extensive number of studies about fracture mechanics based on classic continuum mechanics (CCM) can be found in the literature. The CCM applies the spatial partial differential equations to describe the motion of a material point. Within the framework of CCM, various tools, such as the FEM, boundary element method (BEM) and cohesive zone method (CZM) [31–33], have been applied in numerical fracture analysis. However, since partial differential equations require continuous material geometry, CCM, as a local theory, may have difficulty performing the numerical analysis of problems with discontinuous geometry, such as cracks and kinks. By regarding damage as newly formed boundaries, a remeshing process may be inevitable in numerical analysis [34].
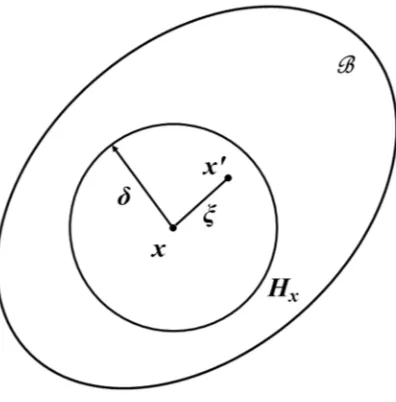
Peridynamic theory (PD) was firstly introduced by Silling and Askari [35] as an alternative numerical approach to CCM. Unlike FEM, the PD uses spatial integral equations instead of partial differential equations to describe the motion of material points. On the other hand, PD is a non-local theory. Material points can build up interactions, called peridynamic bonds, with surrounding neighbors within a certain distance (δ), as shown in Figure1. The collection of neighboring points is called the horizon (Hx). For neighboring points of material pointxbeyond the size of the horizon, it is assumed that the interactions are too weak and have little influence on point x, which can be ignored in a numerical simulation. By integrating the forces between material pointxand its neighboring points,x’, the equation of motion of material pointxcan be calculated and expressed as
ρu..(x,t) = Z
Hx
f u x0,t
−u(x,t),x0−x
dVx0+b(x,t), (10)
wherebrefers to the body force density andfis the pairwise force of each interaction (bond). Note that, in this study, the bond-based peridynamic theory is used for simplicity. However, extension of the formulation to the ordinary-state based formulation is straightforward [34,36].
In bond-based peridynamic theory, the bond force depends on the relative position and relative displacement of the material points associated with the bond which can be calculated as [37]:
f= ξ+η
|ξ+η|c s−αCavg
µ(t,ξ) (11)
where the relative position of material points x and x0 can be defined in the undeformed configuration as:
Energies2018,11, 1461 5 of 22
where the relative position of material points x and x′ can be defined in the undeformed configuration as:
= ′ −
[image:5.595.200.398.88.289.2]ξ x x (12)
Figure 1. Horizon of material point x.
Note that the bond force given in Equation (11) is calculated based on the deformed configuration. Therefore, the formulation has the capacity to capture large deformations. Moreover, the relative displacement can be expressed as:
( ) ( )
′
,
t
,
t
=
−
η u x
u x
(13)In Equation (11), α is the coefficient of expansion, s is the stretch of the bond and Cavg represents the average lithium ion concentration of material points x and x′. is the failure parameter and c is the bond constant. For a three-dimensional isotropic material, the bond constant can be expressed as:
4
12E c
πδ
= (14)
Note that for the three-dimensional, bond-based peridynamic theory, the Poisson’s ratio for a linear elastic isotropic material is equivalent to ν =1 4.
In CCM, damage is specially treated by using remeshing or a pre-defined crack propagation path. On the other hand, the damage is represented as “bond breakage” in peridynamic theory. For brittle elastic material, once the bond stretch exceeds a critical stretch value, sc, after deformation, the bond will break and cannot recover by itself. The critical stretch depends on the critical strain energy release rate (Gc). For a three-dimensional model, the rate definition of the critical strain energy release in peridynamics has been derived by Silling and Askari [35] as:
1 5
2 cos / 2 2 2
0 0 0 0
1 1
sin
2 2 5
z
c c c
G δ π δ ξ c sξ ξ φ φ ξ θd d d dz cs δ π
−
= =
(15)Hence, the critical stretch, sc, can be expressed as:
5 6
c c
G s
E
δ
= (16)
The failure condition of each bond can be represented by a failure parameter as:
( )
, 10 c
c
s s
t
s s
μ = ≤
>
ξ (17)
Figure 1.Horizon of material pointx.
Note that the bond force given in Equation (11) is calculated based on the deformed configuration. Therefore, the formulation has the capacity to capture large deformations. Moreover, the relative displacement can be expressed as:
η=u x0,t
−u(x,t) (13)
In Equation (11),αis the coefficient of expansion,sis the stretch of the bond andCavgrepresents the average lithium ion concentration of material pointsxandx0.µis the failure parameter andcis the bond constant. For a three-dimensional isotropic material, the bond constant can be expressed as:
c= 12E
πδ4 (14)
Note that for the three-dimensional, bond-based peridynamic theory, the Poisson’s ratio for a linear elastic isotropic material is equivalent toν=1/4.
In CCM, damage is specially treated by using remeshing or a pre-defined crack propagation path. On the other hand, the damage is represented as “bond breakage” in peridynamic theory. For brittle elastic material, once the bond stretch exceeds a critical stretch value,sc, after deformation, the bond will break and cannot recover by itself. The critical stretch depends on the critical strain energy release rate (Gc). For a three-dimensional model, the rate definition of the critical strain energy release in peridynamics has been derived by Silling and Askari [35] as:
Gc= Z δ
0 (
Z 2π
0 Z δ
0
Z cos−1z/ξ
0
1 2cξs
2 cξ2
sinφdφdξdθ )
dz= 1
2cs 2 c
δ5π 5
(15)
Hence, the critical stretch,sc, can be expressed as: sc=
r 5Gc
6Eδ (16)
The failure condition of each bond can be represented by a failure parameter as:
µ(t,ξ) = (
1 s≤sc 0 s>sc
(17)
Energies2018,11, 1461 6 of 22
ϕ(x,t) =1−
R
Hxµ(t,ξ)dVx0
R
HxdVx0
(18)
which represents the percentage of broken bonds associated with material pointx. The material point is totally damaged when the damage parameter is equivalent to 1, whereas it is undamaged when the damage parameter is equivalent to 0. Note that breakage of a single bond will not cause the emergence of a crack. Instead, all bonds passing through a crack surface should be broken for a crack to occur. In other words, as the number of broken bonds increases, cracks can emerge and eventually propagate inside the structure. Moreover, there is no need to define the crack path, as in some other existing approaches, such as the cracking particle method [38,39].
During the charging (lithiation) process, the anode will expand in volume, and high hydrostatic stresses will emerge inside the anode, especially at high singularity regions. For three-dimensional problems, the hydrostatic stress of a material point,x, can be calculated as [40]:
eσ= 1
3 σxx+σyy+σzz
(19)
The Cauchy stress tensor,σij, can be expressed in terms of the first Piola–Kirchoff stress,σ0, as [41]:
σ=Jσ0FT =
σxx σxy σxz
σyx σyy σyz
σzx σzy σzz
(20)
where the deformation gradient,F, and its determinant,J, are defined as: F= 9
4πδ4 Z
Hx 1 |x0−x|2 y
0−
y⊗ x0−xdVx0 (21)
and:
J=det(F) (22)
In Equation (21), x0− xrefers to the initial relative distance, andy0−yrefers to the relative distance after deformation. The stress is not directly expressed by the bond-based peridynamic theory. However, the first Piola–Kirchoff stress can be calculated using peridynamic parameters as:
σ0= Z
Hx
f⊗ x0−x
dVx0 (23)
Hence, the amount of hydrostatic stress depends on the displacement gradient and the lithium ion concentration, whereas the concentration change rate depends on the hydrostatic stress gradient and the lithium ion concentration gradient. Therefore, the coupled field equation is applied, as shown in Equation (9). In this study, the peridynamic form of partial differential equation given in Equation (9) was obtained by using peridynamic differential operator method developed by Madenci et al. [42].
4. Peridynamic Differential Operator Approach
The three-dimensional peridynamic differential operator can be derived by considering the Taylor series. Three-dimensional Taylor Series can be written by disregarding the higher order terms [41]:
f(x0) = f(x) +ξ1∂∂fx(x)
1 +ξ2 ∂f(x)
∂x2 +ξ3 ∂f(x)
∂x3 +
1 2!
∂2f(x) ∂x21 +
1 2!
∂2f(x) ∂x22
+2!1∂2f(x) ∂x23 +ξ1ξ2
∂2f(x) ∂x1∂x2 +ξ1ξ3
∂2f(x) ∂x1∂x3 +ξ2ξ3
∂2f(x) ∂x2∂x3
(24)
This is done by moving f(x)to the left-hand-side and multiplying each term in Equation (24) with a PD function,gp1p2p3
R
Hx
(f(x0)− f(x))gp1p2p3
3 (ξ)dVx0= ∂ f(x)
∂x1
R
Hx
ξ1g3p1p2p3(ξ)dVx0+∂ f(x)
∂x2
R
Hx
ξ2g3p1p2p3(ξ)dVx0
+∂f(x) ∂x3
R
Hx
ξ3g3p1p2p3(ξ)dVx0+∂ 2f(x)
∂x12
R
Hx 1 2!ξ21g
p1p2p3
3 (ξ)dVx0+ ∂ 2f(x)
∂x22
R
Hx 1 2!ξ22g
p1p2p3
3 (ξ)dVx0 +∂2f(x)
∂x23
R
Hx 1 2!ξ23g
p1p2p3
3 (ξ)dVx0+ ∂
2f(x) ∂x1∂x2
R
Hx
ξ1ξ2g3p1p2p3(ξ)dVx0
+∂2f(x) ∂x1∂x3
R
Hx
ξ1ξ3g3p1p2p3(ξ)dVx0+ ∂ 2f(x) ∂x2∂x3
R
Hx
ξ2ξ3g3p1p2p3(ξ)dVx0
(25)
The orthogonality property of the PD functions is invoked: 1
n1n2n3 Z
Hx
ξ1n1ξn22ξn33g3p1p2p3(ξ)dVx0=δn1p1δn2p2δn3p3 with(n1,n2,p1,p2=1, 2) (26) and Equation (26) is substituted into Equation (25); then, the partial differential equations can be expressed in peridynamic form as:
∂f(x) ∂x1 ∂f(x)
∂x2 ∂f(x)
∂x3 ∂2f(x)
∂x21 ∂2f(x)
∂x22 ∂2f(x)
∂x23 ∂2f(x)
∂x1∂x2 ∂2f(x)
∂x1∂x3 ∂2f(x) ∂x2∂x3
= Z Hx
f x0−f(x)
g1003 g0103 g001 3 g2003 g0203 g002 3 g1103 g1013 g0113
dVx0 (27)
In Equation (27), the peridynamic functions,gp1p2p3
3 (ξ), can be constructed by: gp1p2p3
3 (ξ) =a p1p2p3
100 ω100(|ξ|)ξ1+a010p1p2p3ω010(|ξ|)ξ2+a001p1p2p3ω001(|ξ|)ξ3+a200p1p2p3ω200(|ξ|)ξ21
+ap1p2p3
020 ω020(|ξ|)ξ22 +a002p1p2p3ω002(|ξ|)ξ23 +a110p1p2p3ω110(|ξ|)ξ1ξ2+a101p1p2p3ω101(|ξ|)ξ1ξ3
+ap1p2p3
011 ω011(|ξ|)ξ2ξ3
(28) The weight function,ωq1q2q3(|ξ|)can be expressed as:
ωq1q2q3(|ξ|) =
δ |ξ|
q1+q2+q3+1
(29)
whereq1,q2,q3= 0, 1, 2 and they cannot be equal to zero at the same time. According to Equation (28), the peridynamic functions,gp1p2p3
3 (ξ), are composed of elements with an unknown coefficient matrix,a, weight function,ωand bond length in thex,yandzdirections.
The unknown coefficient matrix, a, is derived from the peridynamic shape matrix, A, and the known coefficient matrix,b, via following relationship:
A a=b (30)
The elements of the peridynamic shape matrix,A, can be expressed as:
A(n1n2n3)(q1q2q3)= Z
Hx
ωq1q2q3(|ξ|)ξ n1+q2
1 ξ
n2+q2
2 ξ
n3+q3
3 dV (31)
Energies2018,11, 1461 8 of 22 A= 4
9πδ5 0 0 0 0 0 0 0 0
0 49πδ5 0 0 0 0 0 0 0
0 0 49πδ5 0 0 0 0 0 0
0 0 0 15πδ7 151πδ7 151πδ7 0 0 0
0 0 0 151πδ7 15πδ7 151πδ7 0 0 0
0 0 0 151πδ7 151πδ7 15πδ7 0 0 0
0 0 0 0 0 0 151πδ7 0 0
0 0 0 0 0 0 0 151πδ7 0
0 0 0 0 0 0 0 0 151πδ7
. (32)
The elements of the known matrix,b, can be expressed as:
bp1p2p3
n1n2n3 =n1!n2!n3!δn1p1δn2p2δn3p3 (33) Hence, the known coefficient matrixbcan be written as:
b=
1 0 0 0 0 0 0 0 0
0 1 0 0 0 0 0 0 0
0 0 1 0 0 0 0 0 0
0 0 0 2 0 0 0 0 0
0 0 0 0 2 0 0 0 0
0 0 0 0 0 2 0 0 0
0 0 0 0 0 0 1 0 0
0 0 0 0 0 0 0 1 0
0 0 0 0 0 0 0 0 1
(34)
According to Equation (30), the unknown matrixacan be computed as:
a= 9
4πδ5 0 0 0 0 0 0 0 0
0 49
πδ5 0 0 0 0 0 0 0
0 0 49
πδ5 0 0 0 0 0 0
0 0 0 12
πδ7
−3
πδ7
−3
πδ7 0 0 0
0 0 0 −3
πδ7
12
πδ7
−3
πδ7 0 0 0
0 0 0 −3
πδ7
−3
πδ7
12
πδ7 0 0 0
0 0 0 0 0 0 πδ157 0 0
0 0 0 0 0 0 0 15
πδ7 0
0 0 0 0 0 0 0 0 15
πδ7 (35)
Substituting Equations (29) and (35) back to Equation (28), the peridynamic functionsgp1p2p3
3 (ξ) can be calculated as:
g1003 = 9
4πδ3 1
|ξ|sinθcosφ (36)
g0103 = 9
4πδ3 1
|ξ|sinθsinφ (37)
g0013 = 9
4πδ3 1
|ξ|cosθ (38)
g2003 = 12
πδ4 1 |ξ|sin
2
θcos2φ− 3 πδ4
1 |ξ|sin
2
θsin2φ− 3 πδ4
1 |ξ|cos
2
θ (39)
g0203 = −3
πδ4 1 |ξ|sin
2
θcos2φ+ 12 πδ4
1 |ξ|sin
2
θsin2φ− 3 πδ4
1 |ξ|cos
2
g0023 = −3
πδ4 1 |ξ|sin
2
θcos2φ− 3 πδ4
1 |ξ|sin
2
θsin2φ+ 12 πδ4
1 |ξ|cos
2
θ (41)
g1103 = 15
πδ4 1 |ξ|sin
2
θcosφsinφ (42)
g1013 = 15
πδ4 1
|ξ|sinθcosθcosφ (43)
g0113 = 15
πδ4 1
|ξ|sinθcosθsinφ (44)
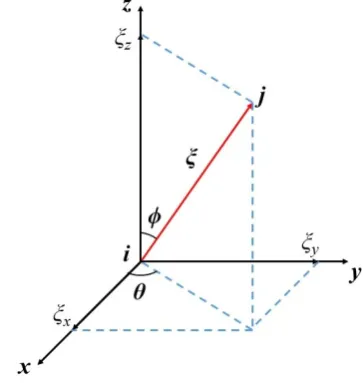
whereθrepresents the angle between the projection of the bond over thex-yplane andx-axis.φshows the angle between the bond and thez-axis, as shown in Figure2(red line shows the bond).
Energies 2018, 11, x 10 of 23
110 2
3 4
15 1
sin cos sin
g θ φ φ
πδ =
ξ (42)
101
3 4
15 1sin cos cos
g θ θ φ
πδ =
ξ (43)
011
3 15 14 sin cos sin
g θ θ φ
πδ =
ξ (44)
where θ represents the angle between the projection of thebond over the x-y plane and x-axis. φ
[image:9.595.203.385.252.444.2]shows the angle between the bond and the z-axis, as shown in Figure 2 (red line shows the bond).
Figure 2. Diagram of three-dimensional bond orientation.
Substituting Equations (36)–(44) in Equation (27), the partial derivative expressions in peridynamic form can be obtained. Therefore, the extension of Fick’s Second Law given in Equation (9) can be rewritten in peridynamic form as:
( ) ( )
{
}
{
( ) ( ) ( )}
( ) ( ){
}
{
( ) ( ) ( )}
( ) ( ){
}
( ){
( ) ( )}
( ) ( ) ( ){
}
( )200 020 002
3 3 3
200 020 002
3 3 3
100 100 3 3 010 3 , , , , , , , , , , x B H H A H H A H A C
Mk T C t C t g g g dV
t MC
t t g g g dV
N
MC C t C t g dV t t g dV
N MC
C t C t g dV
N σ σ σ σ σ ′ ′ ′ ′ ′ ∂ = ′ − + + ∂ Ω ′ − − + +
Ω ′ ′
− − −
Ω ′
− −
x x x x x x x x xx x ξ ξ ξ
x x ξ ξ ξ
x x ξ x x ξ
x x ξ
( ) ( )
{
}
( ) ( ) ( ){
}
( ){
( ) ( )}
( ) 010 3 001 001 3 3 , , , , , , x x H H H At t g dV
MC
C t C t g dV t t g dV
N σ σ σ ′ ′ ′ ′ −
Ω ′ ′
− − −
x
x
x x
x x ξ
x x ξ x x ξ
(45)
5. Numerical Studies
To demonstrate the capability of the current approach, spherical and cylindrical shaped anodes with different crack configurations were considered and the evolution of the damage during the lithiation process was investigated. In all cases, for the numerical solution, uniform spatial discretization was utilized with a grid size of 20 nm for the spherical model and 10 nm for the cylindrical model. Corresponding horizon sizes were specified as 60 nm and 30 nm, respectively.
Figure 2.Diagram of three-dimensional bond orientation.
Substituting Equations (36)–(44) in Equation (27), the partial derivative expressions in peridynamic form can be obtained. Therefore, the extension of Fick’s Second Law given in Equation (9) can be rewritten in peridynamic form as:
∂C
∂t = MkBT
R
Hx{C(x
0,t)−C(x,t)}
g3200(ξ) +g0203 (ξ) +g0023 (ξ) dVx0 −MCΩ
NA
R
Hx{eσ(x 0,t)−
e
σ(x,t)}g2003 (ξ) +g0203 (ξ) +g0023 (ξ) dVx0 −MCΩ
NA
nR Hx{C(x
0,t)−C(x,t)}g100 3 (ξ)dVx0
R Hx{eσ(x
0,t)− e
σ(x,t)}g1003 (ξ)dVx0
o
−MCΩ NA
nR Hx{C(x
0,t)−C(x,t)}g010 3 (ξ)dVx0
R Hx{eσ(x
0,t)− e
σ(x,t)}g0103 (ξ)dVx0
o
−MCNΩ A
n
R
Hx{C(x
0,t)−C(x,t)}g001 3 (ξ)dVx0
R
Hx{eσ(x 0,t)−
e
σ(x,t)}g0013 (ξ)dVx0
o
(45)
5. Numerical Studies
Energies2018,11, 1461 10 of 22
each equation was different, we chose the smaller value, i.e., 2×10⁻¹⁴s, to ensure the stability of the solution.
5.1. Spherical Model
In the first case, a spherical energy storage particle with a pre-existing penny-shaped crack was considered. The materials of this particle, including pure silicon and lithiated silicon, were regarded as brittle materials. In addition, the concentration values were normalized by the maximum concentration as shown in Table1. Before the charging started, the anode material remained as pure silicon. During the charging process, lithium ions at their maximum concentration were applied to the entire outer surface. Since the particle structure was free from any displacement constraints, it experienced free expansion during the charging process. For the three-dimensional bond-based peridynamic theory, the Poisson’s ratio is limited to 1/4. However, the Poisson’s ratio values of pure silicon and lithiated silicon, given in Table1, are very close to the constrained value. Therefore, the limitation of bond-based peridynamic theory regarding Poisson’s ratio would not be effective in this case. Other Poisson’s ratio values can be specified using the ordinary-state based peridynamic formulation. Since the geometry of the spherical energy storage particle was symmetric and the penny-shaped crack was horizontally oriented, the sample planes were selected along the longitude and latitude of the sphere, shown in red and black, respectively, in Figure3to show the lithium ion concentration and mechanical deformation clearly inside the particle.
Energies 2018, 11, x 11 of 23
However, the recently introduced dual-horizon concept [20,22] can also be applied to improve the numerical efficiency of the solution. For the time integration, two different critical time step sizes for Equations (10) and (45) were determined as given in [34]. Since the critical time step size for each equation was different, we chose the smaller value, i.e., 2 × 10⁻¹⁴ s, to ensure the stability of the
solution.
5.1. Spherical Model
[image:10.595.217.377.357.520.2]In the first case, a spherical energy storage particle with a pre-existing penny-shaped crack was considered. The materials of this particle, including pure silicon and lithiated silicon, were regarded as brittle materials. In addition, the concentration values were normalized by the maximum concentration as shown in Table 1. Before the charging started, the anode material remained as pure silicon. During the charging process, lithium ions at their maximum concentration were applied to the entire outer surface. Since the particle structure was free from any displacement constraints, it experienced free expansion during the charging process. For the three-dimensional bond-based peridynamic theory, the Poisson’s ratio is limited to 1/4. However, the Poisson’s ratio values of pure silicon and lithiated silicon, given in Table 1, are very close to the constrained value. Therefore, the limitation of bond-based peridynamic theory regarding Poisson’s ratio would not be effective in this case. Other Poisson’s ratio values can be specified using the ordinary-state based peridynamic formulation. Since the geometry of the spherical energy storage particle was symmetric and the penny-shaped crack was horizontally oriented, the sample planes were selected along the longitude and latitude of the sphere, shown in red and black, respectively, in Figure 3 to show the lithium ion concentration and mechanical deformation clearly inside the particle.
Figure 3. Spherical energy storage particle with a pre-existing penny-shaped crack.
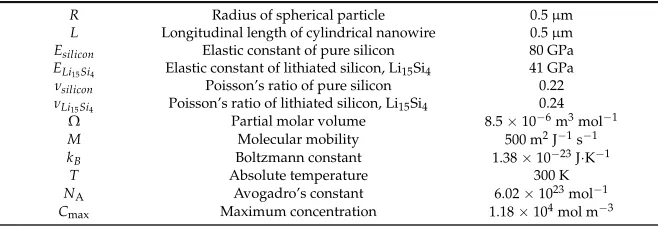
Table 1. Geometrical parameters and material properties of energy storage models.
R Radius of spherical particle 0.5 μm
L Longitudinal length of cylindrical nanowire 0.5 μm silicon
E Elastic constant of pure silicon 80 GPa
4 15Si
Li
E Elastic constant of lithiated silicon, Li15Si4 41 GPa
silicon
ν Poisson’s ratio of pure silicon 0.22
4 15Si
Li
ν Poisson’s ratio of lithiated silicon, Li15Si4 0.24
Ω Partial molar volume 8.5 × 10⁻⁶ m3 mol−1
M Molecular mobility 500 m2 J−1 s−1
B
k Boltzmann constant 1.38 × 10⁻²³ J·K−1
T Absolute temperature 300 K
NA Avogadro’s constant 6.02 × 10²³ mol−1
max
[image:10.595.134.463.578.691.2]C Maximum concentration 1.18 × 10⁴ mol m−3
Figure 3.Spherical energy storage particle with a pre-existing penny-shaped crack.
Table 1.Geometrical parameters and material properties of energy storage models.
R Radius of spherical particle 0.5µm
L Longitudinal length of cylindrical nanowire 0.5µm
Esilicon Elastic constant of pure silicon 80 GPa
ELi15Si4 Elastic constant of lithiated silicon, Li15Si4 41 GPa
νsilicon Poisson’s ratio of pure silicon 0.22
νLi15Si4 Poisson’s ratio of lithiated silicon, Li15Si4 0.24
Ω Partial molar volume 8.5×10⁻⁶m3mol−1
M Molecular mobility 500 m2J−1s−1
kB Boltzmann constant 1.38×10⁻²³J·K−1
T Absolute temperature 300 K
NA Avogadro’s constant 6.02×10²³mol−1
Cmax Maximum concentration 1.18×10⁴mol m−3
Energies2018,11, 1461 11 of 22
emerged at the particle surface region, whereas tensile stresses formed at the particle central region, especially around the crack tip location. Hence, according to Equation (9), high hydrostatic stress affects the lithium ion distribution inside the spherical structure.
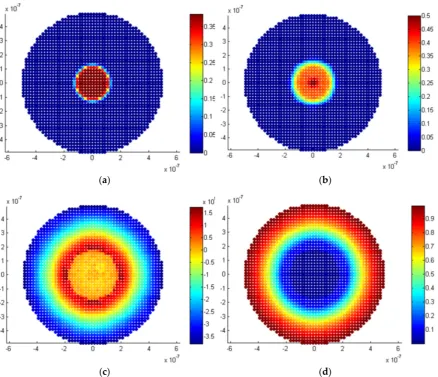
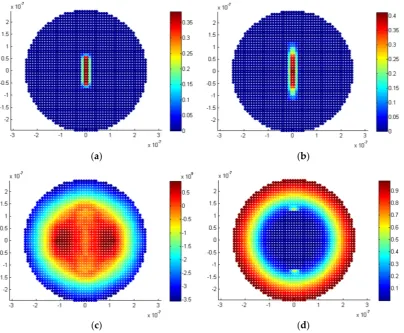
The results of lithium ion diffusion and diffusion-induced deformation during the charging process are shown in Figures4and5. In order to have a clear understanding of the lithiation-induced damage in the three-dimensional structure, results are presented in both the x-z plane and x-y plane (crack surface plane). Due to the heterogeneous distribution of deformation in the spherical structure, high hydrostatic stresses arose at the edge of the penny-shaped crack where high geometrical singularity lies, as shown in Figures4c and5c. As the lithium ion diffused further into the spherical structure, the lithium ion concentration at the crack edge regions started to increase compared with the surrounding regions. However, since the penny-shaped crack had just started to propagate, as shown in Figures4b and5b, the change in lithium-ion concentration may not be very obvious from the concentration plot. The hydrostatic stress value around the crack edge region was around 1.5 GPa which led to a bond stretch far beyond the critical stretch of amorphous silicon. Hence, the penny-shaped crack would have continued to propagate until the stretch of the bonds at the crack tip region reduced below the critical stretch value given in Equation (16).
The penny-shaped crack was located in the central region of the anode structure. The diameter of the penny-shaped crack was half of the diameter of the anode and the crack was horizontally oriented, as shown in Figure 3. As lithiation progressed, the material at the anode surface region became lithiated silicon (Li15Si4) first. Hence, the surface region experienced relatively large deformation while the central region remained undeformed. Due to this mechanical deformation state, compressive stresses emerged at the particle surface region, whereas tensile stresses formed at the particle central region, especially around the crack tip location. Hence, according to Equation (9), high hydrostatic stress affects the lithium ion distribution inside the spherical structure.
The results of lithium ion diffusion and diffusion-induced deformation during the charging process are shown in Figures 4 and 5. In order to have a clear understanding of the lithiation-induced damage in the three-dimensional structure, results are presented in both the x-z plane and x-y plane (crack surface plane). Due to the heterogeneous distribution of deformation in the spherical structure, high hydrostatic stresses arose at the edge of the penny-shaped crack where high geometrical singularity lies, as shown in Figures 4c and 5c. As the lithium ion diffused further into the spherical structure, the lithium ion concentration at the crack edge regions started to increase compared with the surrounding regions. However, since the penny-shaped crack had just started to propagate, as shown in Figures 4b and 5b, the change in lithium-ion concentration may not be very obvious from the concentration plot. The hydrostatic stress value around the crack edge region was around 1.5 GPa which led to a bond stretch far beyond the critical stretch of amorphous silicon. Hence, the penny-shaped crack would have continued to propagate until the stretch of the bonds at the crack tip region reduced below the critical stretch value given in Equation (16).
(a) (b)
[image:11.595.102.497.321.701.2](c) (d)
Figure 4. Results for a penny-shaped, cracked anode in the x-z mid-plane: (a) initial damage; (b) new damage; (c) hydrostatic stress; and (d) lithium ion concentration.
Energies2018,11, 1461 12 of 22
Energies 2018, 11, x 13 of 23
(a) (b)
[image:12.595.82.521.88.465.2](c) (d)
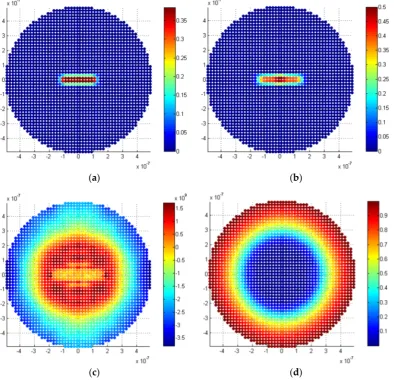
Figure 5. Results for a penny-shaped, cracked anode in the x-y mid-plane (crack surface plane): (a) initial damage; (b) new damage; (c) hydrostatic stress; and (d) lithium ion concentration.
5.2. Cylindrical Model
In this section, several different pre-damaged models are considered to investigate the fracture evolution in the silicon nanowire. The silicon nanowire is represented by a cylindrical-shaped structure. The fracture analysis of cases with different crack orientations is separately discussed in the following sections.
5.2.1. Penny-Shaped Crack along the Horizontal Plane
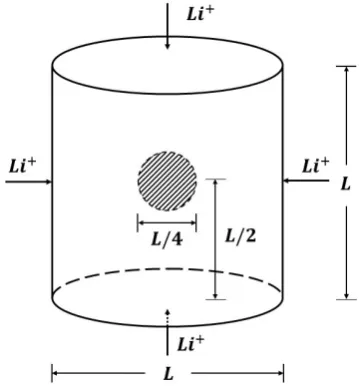
A cylindrical-shaped structure with diameter L, shown in Figure 6, was considered to represent a silicon nanowire. A penny-shaped crack (marked as shadow lines in Figure 6), L/4 in diameter, was horizontally oriented at the center of the cylindrical structure. The material properties of the cylindrical anode were the same as for the spherical model in Table 1. Before charging the battery, the cylindrical material was pure silicon. During the charging process, lithium ions at maximum concentration was applied to the outer surface of the cylindrical structure. As a result, the material properties changed as the lithium ions diffused inside the electrode and the cylindrical structure deformed. Similar to the spherical model, the results are shown in two different plane views in order to present detailed fracture information.
Figure 5. Results for a penny-shaped, cracked anode in the x-ymid-plane (crack surface plane): (a) initial damage; (b) new damage; (c) hydrostatic stress; and (d) lithium ion concentration.
5.2. Cylindrical Model
In this section, several different pre-damaged models are considered to investigate the fracture evolution in the silicon nanowire. The silicon nanowire is represented by a cylindrical-shaped structure. The fracture analysis of cases with different crack orientations is separately discussed in the following sections.
5.2.1. Penny-Shaped Crack along the Horizontal Plane
Energies 2018, 11, x 14 of 23
Figure 6. Cylindrical anode structure with a pre-existing horizontal crack.
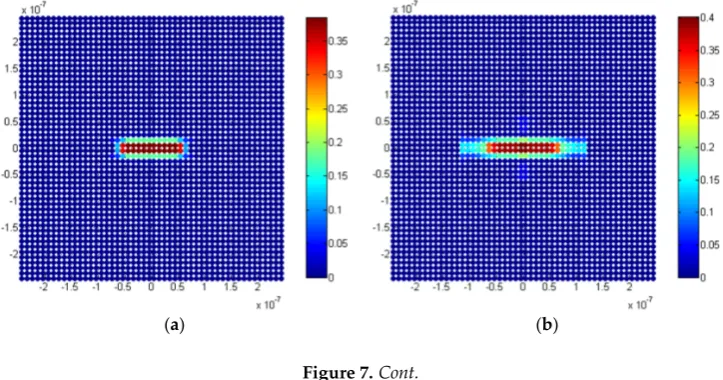
Due to the material phase change during the charging process, material points at the surface region expanded as pure silicon changed into lithiated silicon, whereas material points in the central region remained undeformed. Therefore, the hydrostatic stress in the outer surface region is shown as compression stress which is marked as blue in Figures 7c and 8c. The hydrostatic stress in the inner region of the cylindrical anode is shown as tensile stress, which is marked in red, especially at the crack tip region. In this case, the crack propagation is obvious. The penny-shaped crack edge lies close to the material phase boundary, as shown Figures 7b and 8b. Hence, according to Equation (9), the lithium ion concentration at the crack edge region is relatively higher than in the surrounding regions as shown in Figures 7d and 8d. Since the hydrostatic stress at the crack tip region is around 2.3 GPa, it leads to the bond stretching far beyond the critical stretch of the lithiated silicon. Therefore, the crack propagation will not stop until the stretch values of the bonds at the crack edge regions reduce below the critical stretch value.
[image:13.595.117.479.516.706.2](a) (b)
Figure 6.Cylindrical anode structure with a pre-existing horizontal crack.
Due to the material phase change during the charging process, material points at the surface region expanded as pure silicon changed into lithiated silicon, whereas material points in the central region remained undeformed. Therefore, the hydrostatic stress in the outer surface region is shown as compression stress which is marked as blue in Figures7c and8c. The hydrostatic stress in the inner region of the cylindrical anode is shown as tensile stress, which is marked in red, especially at the crack tip region. In this case, the crack propagation is obvious. The penny-shaped crack edge lies close to the material phase boundary, as shown Figures7b and8b. Hence, according to Equation (9), the lithium ion concentration at the crack edge region is relatively higher than in the surrounding regions as shown in Figures7d and8d. Since the hydrostatic stress at the crack tip region is around 2.3 GPa, it leads to the bond stretching far beyond the critical stretch of the lithiated silicon. Therefore, the crack propagation will not stop until the stretch values of the bonds at the crack edge regions reduce below the critical stretch value.
Energies 2018, 11, x 14 of 23
Figure 6. Cylindrical anode structure with a pre-existing horizontal crack.
Due to the material phase change during the charging process, material points at the surface region expanded as pure silicon changed into lithiated silicon, whereas material points in the central region remained undeformed. Therefore, the hydrostatic stress in the outer surface region is shown as compression stress which is marked as blue in Figures 7c and 8c. The hydrostatic stress in the inner region of the cylindrical anode is shown as tensile stress, which is marked in red, especially at the crack tip region. In this case, the crack propagation is obvious. The penny-shaped crack edge lies close to the material phase boundary, as shown Figures 7b and 8b. Hence, according to Equation (9), the lithium ion concentration at the crack edge region is relatively higher than in the surrounding regions as shown in Figures 7d and 8d. Since the hydrostatic stress at the crack tip region is around 2.3 GPa, it leads to the bond stretching far beyond the critical stretch of the lithiated silicon. Therefore, the crack propagation will not stop until the stretch values of the bonds at the crack edge regions reduce below the critical stretch value.
(a) (b)
Energies2018,11, 1461 14 of 22
Energies 2018, 11, x 15 of 23
[image:14.595.116.481.87.258.2](c) (d)
Figure 7. Result plots of the cylindrical anode with a single horizontal crack in the x-z mid-plane: (a) initial damage; (b) damage after deformation; (c) hydrostatic stress; and (d) lithium ion concentration.
(a) (b)
[image:14.595.118.483.327.620.2](c) (d)
Figure 8. Result plots of the cylindrical anode with a single horizontal crack in the x-y mid-plane (crack surface plane): (a) initial damage; (b) damage after deformation; (c) hydrostatic stress; and (d) lithium ion concentration.
5.2.2. Penny-Shaped Crack along the Vertical Plane
In contrast to the spherical energy storage particle model presented earlier, the cylindrical silicon nanowire model may show different fracture behaviors in the radial direction and longitudinal direction. Hence, in this case study, the penny-shaped crack along the longitudinal (z-direction) direction is under investigation. A penny-shaped crack with a diameter of L/4 was located at the central position in the cylinder model, as shown in Figure 9. However, in contrast to the case study
Figure 7. Result plots of the cylindrical anode with a single horizontal crack in the x-z
mid-plane: (a) initial damage; (b) damage after deformation; (c) hydrostatic stress; and (d) lithium ion concentration.
Energies 2018, 11, x 15 of 23
(c) (d)
Figure 7. Result plots of the cylindrical anode with a single horizontal crack in the x-z mid-plane: (a) initial damage; (b) damage after deformation; (c) hydrostatic stress; and (d) lithium ion concentration.
(a) (b)
(c) (d)
Figure 8. Result plots of the cylindrical anode with a single horizontal crack in the x-y mid-plane (crack surface plane): (a) initial damage; (b) damage after deformation; (c) hydrostatic stress; and (d) lithium ion concentration.
5.2.2. Penny-Shaped Crack along the Vertical Plane
In contrast to the spherical energy storage particle model presented earlier, the cylindrical silicon nanowire model may show different fracture behaviors in the radial direction and longitudinal direction. Hence, in this case study, the penny-shaped crack along the longitudinal (z-direction) direction is under investigation. A penny-shaped crack with a diameter of L/4 was located at the central position in the cylinder model, as shown in Figure 9. However, in contrast to the case study
Figure 8. Result plots of the cylindrical anode with a single horizontal crack in thex-ymid-plane (crack surface plane): (a) initial damage; (b) damage after deformation; (c) hydrostatic stress; and (d) lithium ion concentration.
5.2.2. Penny-Shaped Crack along the Vertical Plane
in Section5.2.1, the crack was vertically oriented (or along thex-zmid-plane). Before charging the lithium ion battery, the cylinder was composed of pure silicon and the lithium ion concentration was zero throughout the whole structure. During the charging process, the lithium ion concentration at maximum value was applied to the entire outer surface of the cylinder. As the lithium ion concentration increased, pure silicon transformed into fully lithiated silicon which led to volume expansion. The stress and damage induced by this volume expansion are shown in Figures9and10.
Energies 2018, 11, x 16 of 23
[image:15.595.207.387.182.377.2]in Section 5.2.1, the crack was vertically oriented (or along the x-z mid-plane). Before charging the lithium ion battery, the cylinder was composed of pure silicon and the lithium ion concentration was zero throughout the whole structure. During the charging process, the lithium ion concentration at maximum value was applied to the entire outer surface of the cylinder. As the lithium ion concentration increased, pure silicon transformed into fully lithiated silicon which led to volume expansion. The stress and damage induced by this volume expansion are shown in Figures 9 and 10.
Figure 9. Cylindrical anode structure with a pre-existing vertical crack.
(a) (b)
[image:15.595.118.480.417.713.2](c) (d)
Figure 10. Result plots of cylindrical anode with a single vertical crack in the y-z mid-plane: (a) initial damage; (b) damage after deformation; (c) hydrostatic stress; and (d) lithium ion concentration.
Figure 9.Cylindrical anode structure with a pre-existing vertical crack.
Energies 2018, 11, x 16 of 23
in Section 5.2.1, the crack was vertically oriented (or along the x-z mid-plane). Before charging the lithium ion battery, the cylinder was composed of pure silicon and the lithium ion concentration was zero throughout the whole structure. During the charging process, the lithium ion concentration at maximum value was applied to the entire outer surface of the cylinder. As the lithium ion concentration increased, pure silicon transformed into fully lithiated silicon which led to volume expansion. The stress and damage induced by this volume expansion are shown in Figures 9 and 10.
Figure 9. Cylindrical anode structure with a pre-existing vertical crack.
(a) (b)
(c) (d)
Figure 10. Result plots of cylindrical anode with a single vertical crack in the y-z mid-plane: (a) initial damage; (b) damage after deformation; (c) hydrostatic stress; and (d) lithium ion concentration.
Energies2018,11, 1461 16 of 22
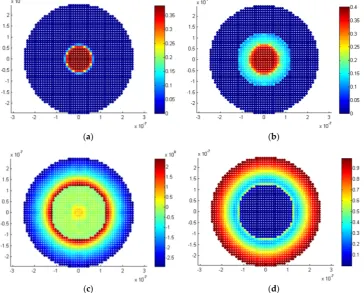
The results are presented in thex-zmid-plane view (Figure10) andx-ymid-plane view (Figure11). During the charging process, the material points in the outer surface region were first lithiated and then expanded whereas the material points in the central region remained undeformed. As a result, a deformation gradient from outer surface to central cylinder was produced, and hydrostatic stress increased, especially at the crack edge regions, in accordance with Equations (19)–(23). Figures10c and11c, show the location of compression stress at the outer surface region, which is represented in blue in the figure. Tension stress exists in the central cylinder region, especially at crack edge regions where geometrical singularity exists, which is represented as red in the figure. As the crack propagated, the crack opened which caused relatively high tension stress near the crack surface. Since the crack propagated close to the material phase boundary, the lithium ion concentration was relatively higher than surrounding regions in accordance with to Equation (9), as shown in Figures10d and11d.
Energies 2018, 11, x 17 of 23
The results are presented in the x-z mid-plane view (Figure 10) and x-y mid-plane view (Figure 11). During the charging process, the material points in the outer surface region were first lithiated and then expanded whereas the material points in the central region remained undeformed. As a result, a deformation gradient from outer surface to central cylinder was produced, and hydrostatic stress increased, especially at the crack edge regions, in accordance with Equations (19)–(23). Figures 10c and 11c, show the location of compression stress at the outer surface region, which is represented in blue in the figure. Tension stress exists in the central cylinder region, especially at crack edge regions where geometrical singularity exists, which is represented as red in the figure. As the crack propagated, the crack opened which caused relatively high tension stress near the crack surface. Since the crack propagated close to the material phase boundary, the lithium ion concentration was relatively higher than surrounding regions in accordance with to Equation (9), as shown in Figures 10d and 11d.
(a) (b)
[image:16.595.99.504.250.583.2](c) (d)
Figure 11. Result plots of cylindrical anode with a single vertical crack in the x-y mid-plane: (a) initial damage; (b) damage after deformation; (c) hydrostatic stress; and (d) lithium ion concentration.
5.2.3. Twin Penny-Shaped Cracks along Horizontal Planes
The case studies in Sections 5.2.1 and 5.2.2 focused on the fracture analysis of a single crack on the symmetry plane of the cylinder structure. Hence, due to symmetric geometry and loading, the penny-shaped crack propagated along the crack surface plane. However, in reality, multiple cracks can occur at any position inside the battery electrode. Hence, in this case study, a silicon cylinder with two cracks not on the symmetry plane was investigated. As shown in Figure 12, twin cracks were located at the central region with diameters equal to L/4 and the distance between these cracks was also L/4. Both of the cracks were horizontally oriented. Before charging the battery, the cylindrical nanowire was composed of pure silicon only. During the charging process, lithium ions at maximum concentration were applied on the entire outer surface of the cylinder. As a result, the material points on the surface became lithiated and expanded while the material points in the central region
Figure 11.Result plots of cylindrical anode with a single vertical crack in thex-ymid-plane: (a) initial damage; (b) damage after deformation; (c) hydrostatic stress; and (d) lithium ion concentration.
5.2.3. Twin Penny-Shaped Cracks along Horizontal Planes
on the surface became lithiated and expanded while the material points in the central region remained undeformed. The heterogeneous deformation led to an increase in hydrostatic stress in regions with geometrical singularity and sped up the diffusion process, as shown in Figure13.
Energies 2018, 11, x 18 of 23
[image:17.595.169.428.141.397.2]remained undeformed. The heterogeneous deformation led to an increase in hydrostatic stress in regions with geometrical singularity and sped up the diffusion process, as shown in Figure 13.
Figure 12. Cylindrical anode structure with pre-existing twin horizontal cracks.
(a) (b)
[image:17.595.119.480.435.723.2](c) (d)
Figure 13. Result plots of a silicon cylinder with twin horizontal cracks in the x-z mid-plane: (a) initial damage; (b) damage after deformation; (c) hydrostatic stress; and (d) lithium ion concentration.
Figure 12.Cylindrical anode structure with pre-existing twin horizontal cracks.
Energies 2018, 11, x 18 of 23
remained undeformed. The heterogeneous deformation led to an increase in hydrostatic stress in regions with geometrical singularity and sped up the diffusion process, as shown in Figure 13.
Figure 12. Cylindrical anode structure with pre-existing twin horizontal cracks.
(a) (b)
(c) (d)
Figure 13. Result plots of a silicon cylinder with twin horizontal cracks in the x-z mid-plane: (a) initial damage; (b) damage after deformation; (c) hydrostatic stress; and (d) lithium ion concentration.
Energies2018,11, 1461 18 of 22
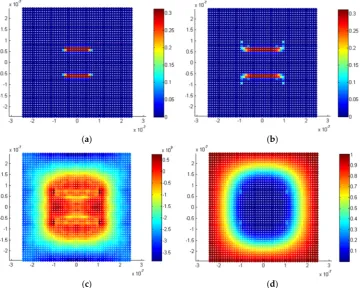
Compared with the case in Section5.2.1, the crack propagation behavior was different. At the initial stage of the charging process, both cracks propagated along the crack surface plane. However, as the charging process continued, the upper crack propagated upward from its edge and the lower crack propagated downwards from its edge. These cracks repelled each other, as shown in Figure13b. Due to the heterogeneous volume expansion inside the cylinder, a deformation gradient formed from surface of the cylinder to the central cylinder. As a result, the hydrostatic stress increased, especially at the crack edge regions, in accordance with Equations (19)–(23). Since material points at the surface region experienced expansion during the charging process, the compression stresses were evident, as represented in Figure13c. The expansion of these material points caused tensile stress for the material points in the central region, especially around the crack edge region, as shown in Figure13c. Since the crack edge is close to the material phase boundary, lithium ions would have diffused into regions around the crack edge with higher priority in accordance with Equation (9). Hence, the lithium ion concentration was relatively higher than surrounding regions, as shown in Figure13d.
5.2.4. Twin Penny Shape Cracks along Vertical Planes
After the analysis of twin cracks along horizontal planes, a case with twin cracks along vertical planes was also considered. In this case study, twin vertical oriented cracks were arranged in the center region of a silicon cylinder, as shown in Figure14. The diameters of both cracks wereL/4 and the distance between these cracks was alsoL/4. Before charging the battery, the silicon cylinder was made of pure silicon. During the charging process, lithium ions at maximum concentration were applied on the entire outer surface of the cylinder. Hence, the material particles inside the outer surface region became lithiated and expanded. This influenced the lithium ion diffusion and hydrostatic stress inside the cylinder, as shown in Figure15.
Energies 2018, 11, x 19 of 23
Compared with the case in Section 5.2.1, the crack propagation behavior was different. At the initial stage of the charging process, both cracks propagated along the crack surface plane. However, as the charging process continued, the upper crack propagated upward from its edge and the lower crack propagated downwards from its edge. These cracks repelled each other, as shown in Figure 13b. Due to the heterogeneous volume expansion inside the cylinder, a deformation gradient formed from surface of the cylinder to the central cylinder. As a result, the hydrostatic stress increased, especially at the crack edge regions, in accordance with Equations (19)–(23). Since material points at the surface region experienced expansion during the charging process, the compression stresses were evident, as represented in Figure 13c. The expansion of these material points caused tensile stress for the material points in the central region, especially around the crack edge region, as shown in Figure 13c. Since the crack edge is close to the material phase boundary, lithium ions would have diffused into regions around the crack edge with higher priority in accordance with Equation (9). Hence, the lithium ion concentration was relatively higher than surrounding regions, as shown in Figure 13d.
5.2.4. Twin Penny Shape Cracks along Vertical Planes
[image:18.595.195.400.413.615.2]After the analysis of twin cracks along horizontal planes, a case with twin cracks along vertical planes was also considered. In this case study, twin vertical oriented cracks were arranged in the center region of a silicon cylinder, as shown in Figure 14. The diameters of both cracks were L/4 and the distance between these cracks was also L/4. Before charging the battery, the silicon cylinder was made of pure silicon. During the charging process, lithium ions at maximum concentration were applied on the entire outer surface of the cylinder. Hence, the material particles inside the outer surface region became lithiated and expanded. This influenced the lithium ion diffusion and hydrostatic stress inside the cylinder, as shown in Figure 15.
Figure 14. Cylindrical anode structure with pre-existing twin vertical cracks.
Figure 15a shows the initial damage in the view of the x-z mid-plane. Early in the charging process, penny shape cracks propagated along their crack surfaces. However, as the charging process continued, the left crack propagated towards the left and the right crack propagated towards the right. Generally, these cracks repelled each other, as shown in Figure 15b. Heterogeneous volume expansion led to the formation of a deformation gradient from the surface region to the central region. Therefore, hydrostatic stress rose inside the cylinder in accordance with Equations (19)–(23). The heterogeneous expansion during lithiation introduced compression stress on material points at the cylinder surface region, which is marked in blue in Figure 15c. As a consequence, the material points at the central cylinder region would have suffered from the tensile stress, marked in red. As the crack edge reached the material phase boundary, the lithium ion would have diffused into material points
Figure 14.Cylindrical anode structure with pre-existing twin vertical cracks.
the material phase boundary, the lithium ion would have diffused into material points in the crack edge region first. Hence, a relatively high lithium ion concentration at the crack edge region as compared with its surrounding region was observed, as shown in Figure15d.
Energies 2018, 11, x 20 of 23
in the crack edge region first. Hence, a relatively high lithium ion concentration at the crack edge region as compared with its surrounding region was observed, as shown in Figure 15d.
(a) (b)
[image:19.595.88.515.142.489.2](c) (d)
Figure 15. Result plots of twin vertical cracks cylinder in the x-z mid-plane: (a) initial damage; (b) damage after deformation; (c) hydrostatic stress; and (d) lithium ion concentration.
5.3. Discussion
The results presented show that lithiation can influence the fracture behavior of a battery electrode. In the perspective of peridynamic theory, crack propagation is calculated based on the bond stretch which depends on the deformation of the structure. Hence, crack propagation generally depends on deformation which is induced by lithiation during battery charging. Since the pure silicon transforms into lithiated silicon, the material properties also change which leads to change in the critical bond stretch value. The comparison between fracture behavior with and without material phase change has been discussed in previous works [26,27]. In this article, since the material phase change during the charging process was also under consideration, the critical bond stretch was also influenced by the material properties.
For an electrode structure with symmetric geometry, the method of crack propagation is different depending on the position of the initial crack. If the initial cracks lie on the symmetry plane, cracks will propagate along the crack surface plane, since the geometry and loading are symmetric. However, if the initial cracks do not lie on the symmetry plane, the newly formed cracks may not align with the initial crack. For the twin cracks cases, the two-dimensional penny-shaped cracks turned into three-dimensional bowl-shaped cracks after the battery as charged. This is because of the material softening phenomenon during lithiation, as described in [32]. Due to the increase in lithium ion concentration, pure silicon at the crack edge regions will transform into lithiated silicon (Li15Si4). As a consequence, the critical bond stretch is reduced. Hence, the bonds at crack edge region reach a critical stretch value earlier which leads the crack edge to propagate towards the high lithium ion
Figure 15. Result plots of twin vertical cracks cylinder in the x-zmid-plane: (a) initial damage; (b) damage after deformation; (c) hydrostatic stress; and (d) lithium ion concentration.
5.3. Discussion
The results presented show that lithiation can influence the fracture behavior of a battery electrode. In the perspective of peridynamic theory, crack propagation is calculated based on the bond stretch which depends on the deformation of the structure. Hence, crack propagation generally depends on deformation which is induced by lithiation during battery charging. Since the pure silicon transforms into lithiated silicon, the material properties also change which leads to change in the critical bond stretch value. The comparison between fracture behavior with and without material phase change has been discussed in previous works [26,27]. In this article, since the material phase change during the charging process was also under consideration, the critical bond stretch was also influenced by the material properties.