City, University of London Institutional Repository
Citation
:
Gashi, I. ORCID: 0000-0002-8017-3184 and Ul Asad, H. (2018). Diversity in
Open Source Intrusion Detection Systems. In: Computer Safety, Reliability, and Security.
SAFECOMP 2018. . Cham, Switzerland: Springer. ISBN 978-3-319-99129-0
This is the accepted version of the paper.
This version of the publication may differ from the final published
version.
Permanent repository link:
http://openaccess.city.ac.uk/19901/
Link to published version
:
Copyright and reuse:
City Research Online aims to make research
outputs of City, University of London available to a wider audience.
Copyright and Moral Rights remain with the author(s) and/or copyright
holders. URLs from City Research Online may be freely distributed and
linked to.
City Research Online:
http://openaccess.city.ac.uk/
publications@city.ac.uk
Systems
Hafizul Asad1, Ilir Gashi1
1 Centre for Software Reliability, City, University of London, UK
{hafiz.ul-asad.1, ilir.gashi.1}@city.ac.uk
Abstract. We present an analysis of the diversity that exists in the rules and blacklisted IP addresses of the Snort and Suricata Intrusion Detection Systems (IDSs). We analysed the evolution of the rulesets and blacklisted IP addresses of these two IDSs over a 5-month period between May and October 2017. We used three different off-the-shelf default configurations of the Snort IDS and the Emerging Threats (ET) configuration of the Suricata IDS. Analysing the differences in these systems allows us to get insights on where the diversity in the behaviour of these systems comes from and how does it evolve over time. This gives insight to Security architects on how they can combine and layer these systems in a defence-in-depth deployment. To the best of our knowledge a similar experiment has not been performed before. We will also show results on the observed diversity in behaviour of these systems, when they analysed the network data of the DMZ network of City, University of London.
Keywords: security assessment; security tools; intrusion detection systems; design diversity
1
Introduction
An important part of design for security is defence-in-depth, consisting of “layers” of defence that reduce the probability of successful attacks. Guidance documents now advocate defence in depth as an obvious need1 but their qualitative guidance ignores the decision problems. Crucially, these questions concern diversity: defences should be diverse in their weaknesses. Any attack that happens to defeat one defence should with high probability be stopped or detected by another one. Ultimately, diversity and defence in depth are two facets of the same defensive design approach. The important questions are not about defence in depth being "a good idea", but about whether a set of specific defences would improve security more than another set; and about – if possible – quantifying the security gains.
Network Intrusion Detection Systems (IDSs) are some of the most widely used security defence tools. Some of these IDSs are available open-source, and the most widely used open-source IDSs are Snort and Suricata. Both of these tools are
based and rely on rules to identify malicious activity. The rules identify malicious activity based on content, protocols, ports etc., as well as on the origin of the activity/traffic - in this latter case, the suspicious IP addresses are “blacklisted” and traffic originating from these IPs are alerted. Depending on the configuration of the IDS the traffic can be alerted but allowed, or alerted and dropped – the latter happens when the IDS is running in Intrusion Prevention System (IPS) mode.
In this paper, we present an analysis of the diversity that exists between the Snort and Suricata rules and blacklisted IP addresses. We analysed the evolution of the rulesets and blacklisted IP addresses of these two IDSs over a 5-month period between May and October 2017. We used three different off-the-shelf default configurations of the Snort IDS and the Emerging Threats configuration of the Suricata IDS. Analysing the differences in these systems and how they evolve over time, allows us to get insights on where the diversity in the behaviour of these systems comes from. To the best of our knowledge a similar experiment has not been performed before. We will also show results on the observed diversity in behaviour of these systems, when they analysed the network data of the DMZ network of City, University of London.
The rest of the paper is organised as follows: Section 2 describes the experimental architecture. The next three sections present results of diversity analysis of the following aspects of Snort and Suricata: blacklists (Section 3); rulesets (Section 4); behaviour on real network traffic (Section 5). Section 6 presents a discussion of the results and limitations. Section 7 presents related work and finally Section 8 presents conclusions and further work.
2
Description of the Experiment and the Architecture
We ran an experiment for 5 months from 20th May 2017 to 31st October 2017. During these dates we did the following. We downloaded and saved snapshots of the blacklisted IP addresses of Snort and Suricata as they were on each day of the experiment. To retrieve the rules we used the pulledpork tool2. For Snort, the blacklisted files3 were downloaded every 15 minutes for the duration of the experiment. We therefore have a total of 15,812 blacklist files for Snort. Note that the total duration of the experiment is 165 days for which there should have been 15,840 files, but in some cases there were no updates for blacklisted IPs in every 15-minute slot of our collection period. The blacklisted IP addresses for Suricata are located inside the rules files4, so we extracted the blacklisted IP addresses from these rule files. We also ran pulledpork every 15 minutes for Suricata, but contrary to Snort, the rate of updates of the Suricata ET blacklists appear to be on daily basis rather than every 15 minutes.
We downloaded and saved the rules of Snort for three different default rule configurations available from the Snort webpages (Community rules, Registered rules, and Subscribed rules). The difference between these rules are explained in the Snort
2https://github.com/shirkdog/pulledpork 3http://labs.snort.org/feeds/ip-filter.blf
website5. In summary, the website states the following for these different rules: the Subscribed (paid) rules are the ones that are available to users in real-time as they are released; the Registered rules are available to registered users 30 days after the Subscribed users; the Community rules are a small subset of the subscribed/registered rule sets and are freely available to all users. For Suricata we used the Emerging Threats (ET) ruleset. We ran the pulledpork to update the rules every 15 minutes, but we observed that rules were updated on average every 24 hours. Similar to blacklisted files, we saved snapshots of these rules files on each day of the experiment.
The University’s IT team saved copies of the network traffic (in packet capture (pcap) format) for retrospective analysis of attacks and incidents. We replayed the pcap traffic collected over a one week From 2 May to 8 May 2017, to the three different versions of Snort outlined above and to Suricata ET.
The data collection and analysis infrastructure runs on a virtualized environment based on VMware VSphere data center. This data collection setup has five data hosts each having, 150TB storage capacity, 200GB RAM, and 32 x 2.3GHz of CPU processing speed. At the start of the experiment, we installed the latest versions of these IDSs on the FreeBSD operating system: Snort 2.9.9.0 and Suricata 3.2.1.
3
Diversity in the IP Blacklists of Snort and Suricata
3.1 Analysis of each individual IDS
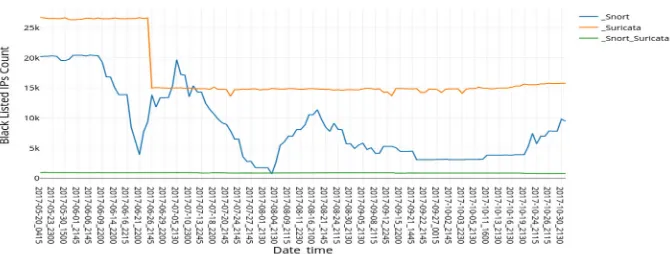
In this section, we present the analysis of our research on how blacklisted IP addresses evolve over time in Snort and Suricata. As we mentioned previously, we obtained these blacklisted IPs from May 20 2017 to October 31 2017, at a sampling rate of every 15 minutes. We kept the same sampling frequency for Suricata to make the analysis as comparable as possible, though we observed that the rate of change of the blacklisted files was, in some cases, less frequent than every fifteen minutes for Snort and further less frequent for Suricata (which tended to be every 24 hours). Figure 1 shows the evolution of the blacklisted IP addresses as obtained from Snort (left plot) and Suricata (right plot). The y-axis shows the total count of the blacklisted IPs and x-axis shows the data collection points. From Figure 1 we observe a large fluctuation in the number of blacklisted IP addresses over time. For example around 21 June 2017 a large number of IP addresses were removed from the blacklists. However, afterwards, the number of blacklisted IP addresses increased again. In Suricata we also saw a large drop in the number of blacklisted IP addresses around this time, but the total number of blacklisted IPs did not increase again as it did for Snort.
We note that some IP addresses remained blacklisted for the entire duration of our experiment (or change their states only once, e.g., they are removed from the blacklists), whereas we observed other IP addresses that changed state twice or more (e.g. blacklisted, removed, blacklisted etc.) We therefore divide the IP addresses into those that remained “continuously” blacklisted IP addresses (or change their states only
once) and “discrete” blacklisted IP addresses (those that changed state more than once). General statistics are given in Table 1: the second column shows counts of the total number of files containing blacklisted IP addresses for the whole experiment period; the third column shows the total number of distinct IP addresses; the fourth and fifth columns show the counts of the “continuous” and “discrete” IP addresses.
Fig. 1. Count of Blacklisted IPs in Snort and Suricata in our collection period Table 1. General Statistics of Blacklisted IP Addresses
Blacklisted IP Source
Count of Files
Count of IP Addresses
Count of IPs that do not change state (“continuous”)
Count of IPs that change state
(“discrete”)
Snort 15,812 46,701 5,383 41,318
Suricata 129 135,791 28,883 106,908
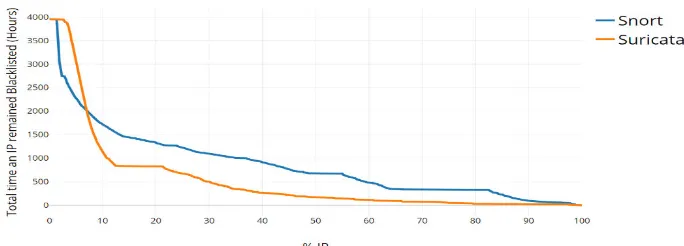
Figure 2 gives the distribution of total time blacklisted for all the IP addresses over the entire period of our experiment. We plotted the proportion of IP addresses (x-axis) against the total time a particular IP remained blacklisted (y-axis). We observe that IP addresses stayed blacklisted longer in Snort than in Suricata.
[image:5.595.124.466.545.668.2]3.2 Diversity analysis of the blacklisted IP Addresses
[image:6.595.130.465.334.461.2]We then analysed the similarity and diversity in the Snort and Suricata blacklisted IP addresses. We compared blacklisted IP addresses from the Snort and Suricata sources at exact time/date points (to the nearest second). In total, out of 15,812 Snort files, and 129 of Suricata, 128 files had a common date/time overlap. The analysis on this section is based on this overlap. Figure 3 shows the date/time slots for which the analysis was carried out (in the x-axis) and the counts of different categories of blacklisted IP addresses (y-axis). We have three main categories of interest: IP addresses which were blacklisted in Snort only (depicted as “_snort” in the graph), IP addresses which were blacklisted in Suricata only (“_suricata”), and IP addresses which were blacklisted in both Snort and Suricata (“_snort_suricata”). We observe that the overlap between the two blacklisted IP addresses sets is relatively small and the total number of IPs that appear in blacklists of both Snort and Suricata is relatively constant for the duration of our experiment.
Table 2. Statistics of the datapoints observed in Snort and Suricata overlapping periods
Total number of IPs in the 128 files of Snort 46,187
Total number of IPs in the 128 files of Suricata 135,308
Total number of IPs observed in either Snort or Suricata 177,504
Total number of IPs observed in both Snort and Suricata 3,991
Total number of data points (IP/date pairs) observed in Snort and Suricata overlapping periods.
Snort only (01) 1,129,180
Suricata only (10) 2,219,330
Snort and Suricata (11) 113,152
Table 3. Statistics of blacklisted IPs observed in Snort and Suricata overlapping periods
Single states Count of
IPs
Multiple states
Count of
IPs
Observed first
in:
Count of
IPs
Snort only (01) 42,196(01,10) only 79 Snort (01) 35
Suricata (10) 44
Suricata only (10) 131,317(01,11) only 2,834 Snort (01) 1,257
Both (11) 1,577
Both Snort and Suricata only (11)
588(10,11) only 250 Snort (01) 84
Both (11) 166
(01,10,11) only
240 Snort (01) 102
Snort (01) 82
Both (11 56
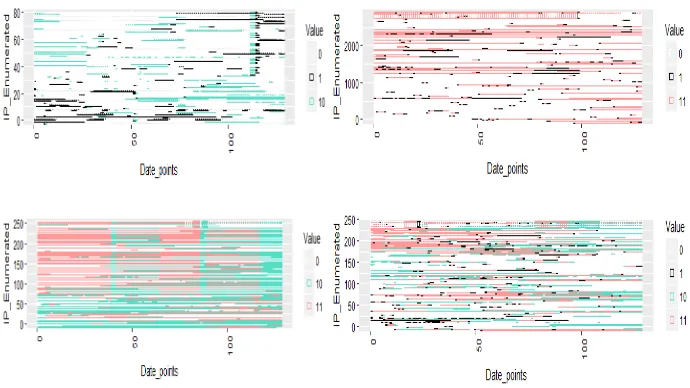
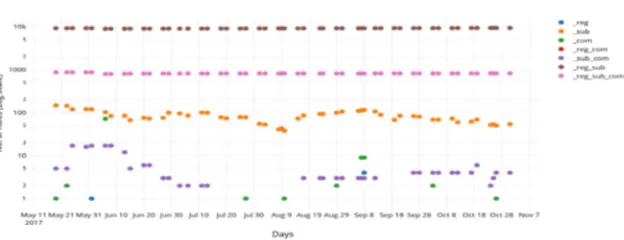
[image:7.595.125.470.463.657.2]Figure 4 shows the IP addresses for which we observed multiple states (i.e. those of columns three and four from Table 3). The x-axis shows the number of date/time points and the y-axis shows the enumeration of those blacklisted IP addresses. We kept the same ordering of the plots as the corresponding rows in column 3 of Table 3: the top-left plot shows the 79 IP addresses that were either observed in both Snort and Suricata but not at the same time, the top right the 2,834 observed in Snort only, or both Snort and Suricata at the same time etc.) The bottom-left plot shows an interesting behavior for IPs that are either in Suricata or in both. From time to time it appears many IP addresses are being removed from Snort, before being reinstated again (we can see blocks of red (Snort and Suricata) becoming green (Suricata only), and then red again).
4
Diversity in Rules used by Snort and Suricata
4.1 Overall Analysis
In this section, we present results of the quantitative analysis of the diversity in Snort and Suricata rulesets. For this analysis, we collected rulesets of Snort and Suricata from 20 May 2017 to 31 October 2017. We considered the following Snort rulesets available from the Snort website: Community, Registered and Subscribed. For Suricata we used the Emerging Threats (ET) rulesets. Similar to blacklisted IP addresses, our sampling rate was every 15 minutes. However, the rate at which the rules were updated was much lower compared with blacklisted IP addresses: mainly every 24 hours, but sometimes with lags of 5 days with no updates. Snort Community rules are an exception where we noticed an update of 4 rules multiple times a day. We present the analysis from comparing the rulesets across all versions once every 24 hours.
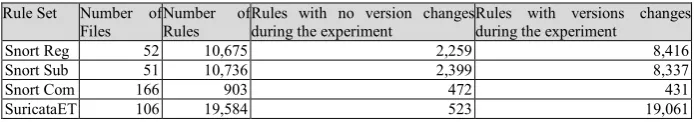
Table 4 shows the details of the data that we used for this analysis. The total number of rules for Suricata is double that for Snort Registered and Snort Subscribed (which are very similar), while the total number of rules in Snort Community is much smaller. Additionally, we looked at how the rules change. We noticed that for some rules the SID (Signature ID) remains the same, but the version number of that rule may change: columns four and five of Table 3 give these counts. More than 80% of the Snort Registered and Subscribed rulesets, and 97% of Suricata ET rulesets reported version changes during the experiment.
Table 4. General Statistics of Different Rule Sets Rule Set Number of
Files
Number of Rules
Rules with no version changes during the experiment
Rules with versions changes during the experiment
Snort Reg 52 10,675 2,259 8,416
Snort Sub 51 10,736 2,399 8,337
Snort Com 166 903 472 431
SuricataET 106 19,584 523 19,061
Figure 5 shows the count of rules of each of these rulesets as they evolve over the duration of the experiment. We notice that the total number of rules in each set remains relatively constant for the duration of the experiment.
4.2 Snort Diversity analysis
[image:8.595.124.472.432.493.2]Fig. 5. Snort and Suricata rule counts over the duration of the experiment
Fig. 6. Time Progression of Diversity in Snort Rules
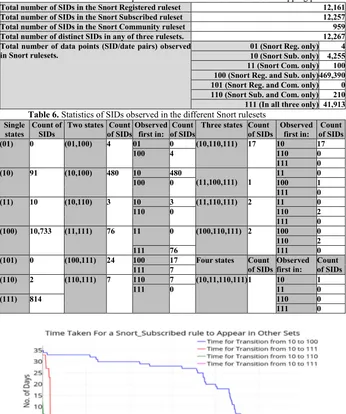
[image:9.595.144.456.328.448.2]Table 5 Statistics of the datapoints observed in the Snort rulesets overlapping periods
Total number of SIDs in the Snort Registered ruleset 12,161
Total number of SIDs in the Snort Subscribed ruleset 12,257
Total number of SIDs in the Snort Community ruleset 959
Total number of distinct SIDs in any of three rulesets. 12,267
Total number of data points (SID/date pairs) observed in Snort rulesets.
01 (Snort Reg. only) 4
10 (Snort Sub. only) 4,255
11 (Snort Com. only) 100
100 (Snort Reg. and Sub. only) 469,390
101 (Snort Reg. and Com. only) 0
110 (Snort Sub. and Com. only) 210
111 (In all three only) 41,913 Table 6. Statistics of SIDs observed in the different Snort rulesets
Single states
Count of SIDs
Two states Count of SIDs
Observed first in:
Count of SIDs
Three states Count of SIDs
Observed first in:
Count of SIDs
(01) 0 (01,100) 4 01 0 (10,110,111) 17 10 17
100 4 110 0
111 0
(10) 91 (10,100) 480 10 480
(11,100,111) 1
11 0
100 0 100 1
111 0
(11) 10 (10,110) 3 10 3 (11,110,111) 2 11 0
110 0 110 2
111 0
(100) 10,733 (11,111) 76 11 0 (100,110,111) 2 100 0
110 2
111 76 111 0
(101) 0 (100,111) 24 100 17 Four states Count
of SIDs
Observed first in:
Count of SIDs
111 7
(110) 2 (110,111) 7 110 7 (10,11,110,111)1 10 1
111 0 11 0
(111) 814 110 0
111 0
Fig. 7. The time lag for Subscribed rules to appear in the other Snort Rulesets
4.3 Diversity Analysis of Snort and Suricata Rules
the ‘content’ field represents the important signatures information for a malicious traffic that these IDSs are intended to detect/capture. Not all Snort and Suricata rules have the ‘content’ field so the analysis in this section is based on only those rules that have it (73.4% of the rules of Snort Registered and Subscribed have this field, 77.8% of Suricata ET and 97.7% of Snort Community rules have the “content” field).
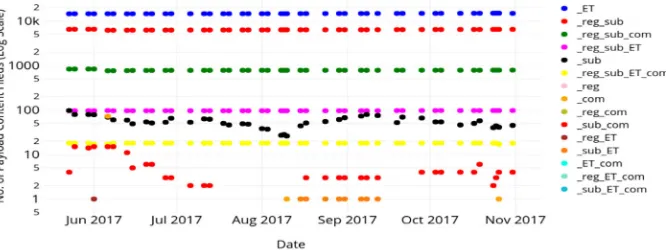
Figure 8 shows the diversity of Snort and Suricata rulesets based on the content field. Here, the x-axis shows the days and the y-axis the number of SIDs with content fields, in log scale. The shortcut notation is the same as previous (e.g., “_ET” represents the SIDs observed only in the Suricata ET ruleset etc.) The largest overlap between Suricata and Snort is in the rules that exist in ET, Registered and Subscribed rulesets (the magenta dotted line that hovers around the 100 mark in the y-axis).
[image:11.595.130.463.374.499.2]Tables 7 and 8 show a similar analysis to what we described in Tables 5 and 6, but constrained to just the rules with the “content” field, and also including Suricata ET. In addition to the binary shorthands we used in Table 5, we also use “1000”, “1001” etc., to represent Suricata ET and their overlaps with the different rulesets of Snort. These tables confirm that there is relatively little overlap between Suricata ET and Snort rules.
[image:11.595.124.472.522.687.2]Fig. 8. Diversity in Time of the Snort and Suricata rulesets Table 7. Datapoints observed in Snort and Suricata for rules with the contents field
Total number of SIDs in Snort Reg. ruleset with content field 7,840
Total number of SIDs in Snort Sub. ruleset with content field 7,901
Total number of SIDs in Snort Com. ruleset with content field 883
Total number of SIDs in Sur. ET ruleset with the contents field 15,239
Total of distinct SIDs with content field in any of the rulesets above 23,014
Total number of data points (SID/date pairs) observed in Snort and Suricata rulesets for SIDs with content field. Abbreviations (not seen in previous tables):
“1000” – Suricata ET only “1001” – ET and Reg. only “1010” – ET and Sub. only “1011” – ET and Com. only “1100” – ET and Reg. and Sub. only “1101” – ET and Reg. and Com. only “1110” – ET and Sub and Com. only
“1111” – ET and Reg. and Sub. And Com. only
Data point count
Data point count
1000 644,159
01 11001 0
10 2,4431010 8
11 741011 0
100 278,9111100 4,236
101 01101 0
110 1771110 0
Table 8. Statistics of SIDs with content field in the different Snort and Suricata rulesets Single
states
Count of SIDs
Two states No. SIDs
Observed first in:
Count of SIDs
Three states Count of SIDs
Observed first in:
Count of SIDs
10 57 (01,100) 1 01 0 (10,110,111) 18 10 18
100 1 110 0
111 0
100 6,548 (10,100) 315 10 314 (11,110,111)
2
11 0
100 1 110 2
111 0
110 2 (10,110) 2 10 2 (1000,1010,1100) 1 1000 1
110 0 1010 0
1100 0
111 760 (11,111) 72 11 0
111 72
1000 15,113 (100,111) 3 100 3
111 0
1100 96 (110,111) 7 110 7
111 0
1111 17
5
Diversity in the Behavior of Snort and Suricata
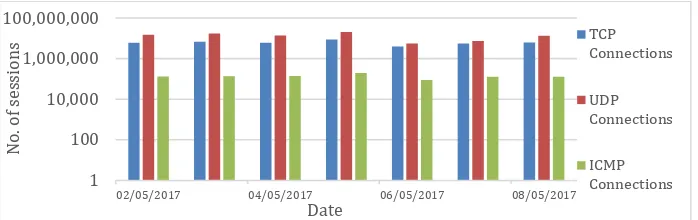
So far, we looked at the diversity that exists in the internals of these products and the way in which they evolve. In this section, we will analyse how this diversity in design manifests itself in the alerting behavior of these products when analyzing network traffic. We analysed 7 days of pcap data from 2 May to 8 May 2017. The data was captured in the DMZ network of the City, University of London. In those 7 days, we had 326GB, 330GB, 280GB, 252GB, 186GB, 204GB and 316GB of network data respectively. The breakdown of the traffic based on different types of protocols is listed in Figure 9.
Fig. 9. Count of sessions per protocol for each day of experiment
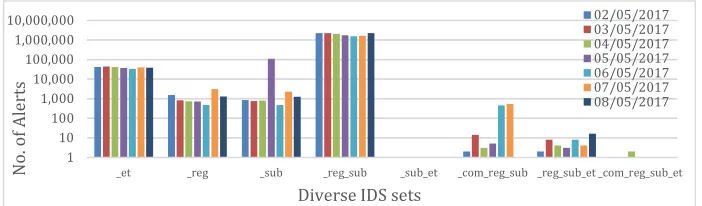
We analysed this data using Snort and Suricata with the rulesets discussed so far (we used one snapshot of the ruleset for the analysis). Figure 10 presents the results. We used the same notations as in Sections 3 and 4 (e.g. “_et” means alerted by Suricata ET only). We noticethat Snort Registered and Subscribed rules generated alerts of an order of magnitude more than Suricata ET. As observed in the ruleset and blacklisted IP addresses analysis from Sections 3 and 4, there is little overlap in the alerts of Suricata
1 100 10,000 1,000,000 100,000,000
02/05/2017 04/05/2017 06/05/2017 08/05/2017
[image:12.595.125.474.496.606.2]ET and Snort, which means these systems exhibit very diverse alerting behavior when analysing this traffic.
Fig. 10. Number of Alerts generated by different combinations of rulesets of Snort and Suricata
6
Discussion and Limitations
The results are intriguing, and they show that there is a large amount of diversity in the rules and blacklists of Snort and Suricata. Whether this diversity is helpful or harmful for a given deployment depends on the context. The rules and blacklists alert for potentially harmful behavior that has been observed somewhere in the world by users of these products. In a different deployment, the alerts from some of these rules may not cause harm. For example, a service or port for which a rule alerts may not exist in that environment. Hence even if the alerts are for malicious traffic it is likely that this attack will not cause any harm in the systems of that deployment. The dataset we used in Section 5, real traffic that the University’s IT team gave us access to, is unfortunately not labelled, so we cannot do a conventional analysis of sensitivity and specificity of these IDSs and their diverse combinations. We did share the findings with the University’s IT team and they found the results interesting. Currently they use a smaller subset of Suricata ruleset for analysis. Interestingly, they mentioned that even if the alerts are for services that they do not run (hence would be harmless in their environment) they would like to know about them as it gives them insight on security exposure for services that users may request in the future, and also because they can use the alerts to check if they are precursors for attacks on other services that they value.
How can individual user organizations decide whether diversity is a suitable option for them, with their specific requirements and usage profiles? The cost is reasonably easy to assess: costs of the software products, the required middleware (if any), added complexity of management, hardware costs, run-time costs and possibly more complex diagnosis and more laborious alert sifting. The gains in improved security (from protection to attacks and exploits) are difficult to predict except empirically. This uncertainty will be compounded, for many user organizations, by the lack of trustworthy estimates of their baseline security. We note that, for some users, the evidence we have presented would already indicate that diversity to be a reasonable and relatively cheap precautionary choice, even without predictions of its effects. These are users who have serious concerns about security (e.g., high costs for interruptions of service or undetected exploits), and sufficient extra personnel to deal with a larger number of alerts.
1 10 100 1,000 10,000 100,000 1,000,000 10,000,000
_et _reg _sub _reg_sub _sub_et _com_reg_sub _reg_sub_et _com_reg_sub_et
N o . o f A le rt s
Diverse IDS sets
7
Related Work
The security community is well aware of diversity as potentially valuable [2], [3]. Discussion papers argue the general desirability of diversity among network elements, like communication media, network protocols, operating systems etc. Research projects studied distributed systems using diverse off-the-shelf products for intrusion tolerance (e.g. the U.S. projects Cactus [4], HACQIT [5] and SITAR6; the EU MAFTIA project7), but only sparse research exists on how to choose diverse defenses (some examples in [6], [7] [3, 8]).
A very extensive survey on evaluation of intrusion detection systems is presented in [9]. This survey analyses and systematizes a vast number of research works on the field. The main features analyzed in the survey are the workloads used to test the IDSs, the metrics utilised for the evaluation of the collected experimental data, and the used measurement methodology. The survey demonstrates that IDS evaluation is a key research topic and that one of the main benefits that IDSs evaluation can bring are related with guidelines on how to improve IDS technologies.
8
Conclusions
In this paper, we presented an analysis of the diversity that exists between the Snort and Suricata rules and blacklisted IP addresses. We analysed the evolution of the rulesets and blacklisted IP addresses of these two IDSs over a 5-month period between May and October 2017. We used three different off-the-shelf default configurations of the Snort IDS and the Emerging Threats configuration of the Suricata IDS. We performed the analysis to provide insight to Security architects on how they can combine and layer these systems in a defence-in-depth deployment. We also showed results on the observed diversity in behaviour of these systems, when they analysed the network data of the DMZ network of City, University of London.
The main conclusions from our analysis are:
- There is a significant amount of diversity in the blacklists of Snort and Suricata, and this is maintained throughout our observation period. The amount of overlap between these IPs is relatively small. Depending on the adjudication mechanism that a system architect wishes to deploy, having access to a larger pool of blacklisted IP addresses may be beneficial to increase protection against a larger pool of malicious sources. However, if a user observes a large number of false positives from these blacklists at a given period of time, then diversity can be help to keep the false positive rate low (for example by only raising alarms only if an IP appears in multiple blacklist) until the vendors “clean up” the blacklists;
- We observe a significant amount of diversity in the rules of Snort and Suricata. When analyzing the rules based on the “content” field, only 1% of the rules of Snort and Suricata return a match. This indicates that these systems would alert on
6http://people.ee.duke.edu/~kst/sitar.html
potentially very diverse traffic. This is indeed confirmed from a small experiment that we ran with real traffic from City, University of London. There was very little overlap in the alerting behavior of these products.
We have underscored that these results are only prima facie evidence for the usefulness of diversity. What is important is to assess these products in real deployment on their capability to improve the security of a given system. The results presented here will, we hope, provide the security architects with the evidence on the diversity that exists in the design of these products and whether this diversity remains as these products evolve.
As further work, we plan to investigate the diversity with IDSs and other defence-in-depth tools in real deployments, with labelled datasets, to assess the benefits as well as potential harm that diversity may bring due to the interplay between the risks from false negatives and false positives. Currently we are investigating the adjudication mechanisms that can help balance the risks associated with these failures.
Acknowledgment
This work was supported by the UK EPSRC project D3S and in part by the EU H2020 framework DiSIEM project.
References
1. Elia, I.A., J. Fonseca, and M. Vieira. Comparing SQL Injection Detection Tools Using Attack Injection: An Experimental Study. in 2010 IEEE 21st International Symposium on Software Reliability Engineering. 2010.
2. Littlewood, B. and L. Strigini. Redundancy and diversity in security. in ESORICS 2004, 9th European Symposium on Research in Computer Security. 2004. Sophia Antipolis, France: Springer-Verlag.
3. Garcia, M., et al., Analysis of operating system diversity for intrusion tolerance.
Software: Practice and Experience, 2014. 44(6): p. 735-770.
4. Hiltunen, M.A., et al. Survivability through customization and adaptability: the Cactus approach. in DARPA Information Survivability Conference and Exposition, 2000. DISCEX '00. Proceedings. 2000.
5. Reynolds, J., et al. The Design and Implementation of an Intrusion Tolerant System. in DSN 2002, International Conference on Dependable Systems and Networks. 2002. Washington, D.C., USA.
6. Sanders, W.H., et al. Probabilistic Validation of Intrusion Tolerance. in DSN 2002, International Conference on Dependable Systems and Networks, Fast Abstracts Supplement. 2002. Bethesda, Maryland.
8. Bishop, et al. Diversity for Security: A Study with Off-the-Shelf Antivirus Engines. in 22nd IEEE International Symposium on Software Reliability Engineering (ISSRE 2011). 2011.