City, University of London Institutional Repository
Citation
:
Ghosh, S. ORCID: 0002-1992-2289 and Rahman, B. M. A. ORCID: 0000-0001-6384-0961 (2018). Design of On-chip Hybrid Plasmonic Mach-Zehnder Interferometer for Temperature and Concentration Detection of Chemical Solution. Sensors and Actuators B: Chemical, 279, pp. 490-502. doi: 10.1016/j.snb.2018.09.070This is the accepted version of the paper.
This version of the publication may differ from the final published
version.
Permanent repository link: http://openaccess.city.ac.uk/id/eprint/20978/
Link to published version
:
http://dx.doi.org/10.1016/j.snb.2018.09.070Copyright and reuse:
City Research Online aims to make research
outputs of City, University of London available to a wider audience.
Copyright and Moral Rights remain with the author(s) and/or copyright
holders. URLs from City Research Online may be freely distributed and
linked to.
1
Design of On-chip Hybrid Plasmonic Mach-Zehnder
Interferometer for Temperature and Concentration
Detection of Chemical Solution
Souvik Ghosh and B. M. A. Rahman
School of Mathematics, Computer Science, and Engineering, City, University of London, UK
*Corresponding Author, souvik.ghosh.1@city.ac.uk
Tel: +44-7405137454
Highlights
• A novel metal strip loaded horizontal slot hybrid plasmonic waveguide with a refractometric sensitivity of 1.13 is proposed.
• Optimized waveguide design shows a high 59.23% and 82.04% quasi-TM field confinement in the slot and sensing (slot + clad) region, respectively.
• A compact Mach-Zehnder interferometer is designed for detection of temperature and volume concentration of isopropanol/water solution, although it is also suitable for any other liquid chemical.
• Asymmetric power splitting scheme enhances the interference fringe visibility to the ideal value (𝐹′ ≃ 1).
• A single on-chip sensor design shows a high temperature sensitivity of 243.9 pm/oC and volume concentration sensitivity of 437.3 nm/RIU.
• The device incorporates a simple design scheme which is highly resilient to the fabrication tolerances.
Keywords
2
Abstract
We report a compact lab-on-chip design of a Mach-Zehnder interferometer (MZI) incorporating a novel metal strip loaded horizontal slot hybrid plasmonic waveguide (HSHPW) in the sensing arm and a dielectric horizontal slot (DHS) waveguide in the reference arm. The HSHPW is optimized to confine a high ~60% and ~82% evanescent optical field in the low index dielectric slot and an
active sensing region, respectively which enhance the device sensitivity with a comparative lower propagation loss than a typical plasmonic waveguide. We report here a single MZI configuration which not only exhibits an excellent temperature sensitivity of 243.9 pm/oC but also liquid concentration sensitivity of 437.3 nm/RIU for a 40 𝜇m long HSHPW. To mitigate loss arising from each section such as butt coupling and plasmonic modal losses, the HSHPW has been optimized by incorporating an asymmetric power splitter which shows a considerable improvement in the fringe visibility and device insertion loss. Thus, the proposed single MZI design shows an excellent response to the temperature and liquid concentration sensing with a maximum total loss and extinction ratio of 2.56 dB and >25 dB, respectively. A much simpler CMOS friendly compact design is also found to have a great robustness to the fabrication tolerances.
1.
Introduction
On-chip integrated photonic and plasmonic waveguides [1 – 4] have great potential in applications for biochemical industries, real-time rapid medical diagnosis, early-stage detection of critical diseases, DNA characterizations, environmental monitoring, food and water quality screening, pharmaceutical industries, particle tracing and tweezing etc. [5 – 8]. Several electronic and mechanical sensors have already been commercialized to achieve these functionalities but with a lower detection accuracy, bulky design and high-power consumption. In recent years, integrated optical technology-based sensors are gaining interests as attractive alternative approaches to the electronic technology due to its immunity from electromagnetic interference (EMI), compact portable lab-on-a-chip scale design for low-cost mass production, suitable for real-time monitoring, low power requirements, remote operation, fast response and above all, a much higher sensitivity for accurate detection of targets even at the atomic level. Monitoring and control of most fundamental parameters of organic, inorganic, and hazardous chemical solution such as temperature and concentration of analytes represent a major concern to the biochemical industries and health organizations for their improvement of manufacturing producibility and protection of public health from hazardous accidents. Instead of the commonly used thermocouple and resistance thermometer, optical temperature sensors are attracting substantial interests. Refractometric based photonic sensors incorporating guiding materials with large thermo-optic coefficients (TOC) are promising in many biochemical applications, such as DNA, RNA, and protein precipitation from aqueous solution [9, 10] and temperature sensitive biochemical characterizations where distinct chemical behaviors depend on a small fractional change in temperature [11].
3
microstructured optical fibers (MOFs) [15, 19] have been developed and investigated for temperature monitoring. However, on-chip integrated optical temperature sensors based on ring resonators [20, 21], Fabry-Perrot cavities [22], Bragg reflectors [23, 24], and interferometers [25, 26] have also been demonstrated and are envisaged to be favorable candidates for integration with electronic circuits for lab-on-a-chip information processing and calibration compared with their fiber-optic siblings. All these sensing mechanisms are restricted to a much lower temperature sensitivity of around ~70-80 pm/°C. Recently published reports by Guan et al. [27] and Zhang et al. [28] have demonstrated an improved sensitivity of 172 pm/°C and 162.9 pm/°C for Si/SU-8 hybrid waveguide assisted MZI sensor and Si/SU-8 based photonic crystal nanobeam cavities, respectively. Besides temperature sensing, an accurate detection of chemical concentration is of considerable interest in biomedical research and chemical industries [9, 10, 29, 30]. Different exotic waveguide schemes such as disk [31], ring [32, 33] and straight resonators [34, 35], sub-wavelength gratings [36], and interferometers [37, 38] have also been proposed and evaluated as biochemical sensors depending on the changes of mode effective index (𝑛𝑒𝑓𝑓) by homogeneous or bulk sensing and localized or surface sensing. A recent report shows a maximum isopropanol refractometric sensitivity of 160 nm/RIU for a hollow hybrid plasmonic MZI liquid sensor [39].
In this paper, we introduce a novel metal strip loaded horizontal slot hybrid plasmonic waveguide (HSHPW) assisted asymmetric unbalanced Mach-Zehnder interferometer (MZI) with dynamic sensing ability. In HSHPW, a nano-scale low index plasmonic slot region is formed by suspending a high index silicon (Si) slab on top of a thin silver (Ag) layer deposited on silica (𝑆𝑖𝑂2) buffer layer. The key objective of a sensor design would be to enhance light-matter interactions in the low index slot region to obtain a high waveguide sensitivity to a small refractive index change in the sensing material. Dominant quasi-TE mode of a vertical slot waveguide is highly sensitive to the sidewall roughness caused by the dry-etching fabrication process, which results in high scattering loss. On the other hand, the dominant quasi-TM mode suffers less scattering loss as the horizontal interfaces are relatively smoother due to the wet-etching technology used. Thus, the horizontal dielectric slot suffers lower loss [40] compared to vertical one and higher sensitivity in bio-chemical and gas sensing applications [41–44]. The waveguide design parameters optimizations for the maximum sensitivity have been investigated by using our in-house accurate full-vectorial finite element method (FV-FEM). However, this type of HSHPW being different than standard silicon nanowire or dielectric slot guide, so we have considered the design variation to reduce the junction losses. The least squares boundary residual method (LSBR) along with the FV-FEM has also been used to obtain scattering matrices at waveguide discontinuity junctions. The MZI consists of non-identical waveguides in sensing and reference arms. The HSHPW
incorporating sensing arm with isopropanol in the cover and slot regions provides a negative temperature dependent phase change, whereas the reference arm with 𝑆𝑖𝑂2 clad Si/𝑆𝑖𝑂2/Si dielectric horizontal slot (DHS) waveguide incurs a positive temperature dependent phase change. Thus, the opposite phase changes in both arms offer a much higher cumulative phase difference for a small temperature variation. This same MZI configuration is also capable of detecting a small fractional change of isopropanol concentration in a water/isopropanol binary solution for a fixed temperature. Thus, our proposed MZI sensor not only have a high response to refractive index-based temperature sensing but also have an excellent ability to detect liquid concentration which is promising for a lab-on-chip sensor arrays. To the best of our knowledge, no such on-chip integrated photonic device has been reported which shows a single optimized device design which
4
2.
Theory and design schemes
2.1 Design principle
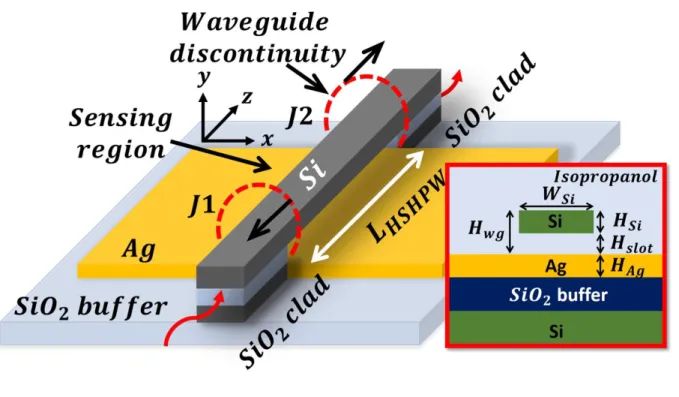
The metal strip loaded HSHPW supports a plasmon assisted slot confined mode in the low index area which is a combination of photonics and plasmonic modes arise from dielectric-dielectric (Si/isopropanol) and dielectric-metal (isopropanol/Ag) interfaces, respectively. The 3D schematic of HSHPW structure is shown in Fig. 1(a) which contains a nano-dimension slot in between suspended Si slab and a lower Ag layer deposited on top of the 𝑆𝑖𝑂2 buffer layer. The HSHPW is
butt coupled to 𝑆𝑖𝑂2 clad Si/𝑆𝑖𝑂2/Si dielectric horizontal slot (DHS) waveguides at both ends.
Thus, the Si slab forms a bridge over the metal layer and offers a plasmonic slot which is exploited as a sensing region in our proposed design. Inset of Fig. 1(a) shows the cross-section view of the HSHPW. The plasmonic waveguide design, optimizations and performance analyses require an accurate mode solver to solve the partial differential equations (PDEs). In most cases, the PDEs for plasmonic problems are much complex to be solved by using conventional analytical and semi-analytical approaches. Our in-house H-field based full-vectorial finite element method (FV-FEM) has been developed [45] and refined [34, 44, 46, 47] over last thirty years is used for modal solutions. The variational formulation used for FV-FEM is modified by considering local dielectric constant of each discretized element for the elimination of spurious modes, particularly useful for plasmonic waveguides [44, 47] so that their Euler equations not only follow the Helmholtz’s equation but also satisfy the Maxwell’s divergence equation.
𝑘02 = (𝜔
𝑐)
2
= 〈𝜖̂𝑟
−1
(𝛁 × 𝑯), (𝛁 × 𝑯)〉 + 〈𝜖̂𝑟−1(𝛁 ⋅ 𝑯), (𝛁 ⋅ 𝑯)〉
〈𝜇̂ 𝑯, 𝑯〉𝑟
(1)
Here 𝑘0, 𝜔, 𝜖̂ and 𝜇̂ denote the wavenumber, angular frequency, relative permittivity and permeability tensor, respectively and 𝑘02 represents the eigenvalue. The modal phase constant (𝛽) and effective index (𝑁𝑒𝑓𝑓 = 𝑛𝑒𝑓𝑓− 𝑗𝑘𝑒𝑓𝑓 = 𝛽/𝑘0− 𝑗 𝛼/𝑘0) can be evaluated from the eigenvalues. Here 𝛼 is the mode attenuation constant in nepers per micrometer (Np/𝜇m) and 𝑘0 = 2𝜋/𝜆0 is the plane wave phase constant in free space and 𝜆0 is free-space wavelength of light. An accurate solution of a plasmonic waveguide requires a sufficient dense mesh distribution around the metal film to resolve the sub-wavelength field confinement. Our flexible meshing technique associated with FV-FEM helps in this regard. The mode propagation length (𝐿𝑝 = 𝜆/4𝜋𝑘𝑒𝑓𝑓, the
waveguide length where the guided mode power is 1/𝑒 times of its initial value) and mode power attenuation (𝛼′(𝑑𝐵/𝜇𝑚) = 4.343/𝐿𝑝; 𝛼′(𝑑𝐵/𝜇𝑚) = 20 ⋅ 𝑙𝑜𝑔10𝑒 ⋅ 𝛼(𝑁𝑝/𝜇𝑚)) are also important in evaluation of plasmonic waveguides. Optimization to maximum waveguide sensitivity requires a rigorous assessment of power confinement factor (Γ) in the specific regions (slot and sensing regions) which can be defined as
Γ = ∬ 𝑅𝑒(𝑬 × 𝑯
∗). 𝑧̂ 𝑑𝑥𝑑𝑦 Δ
∬ 𝑅𝑒(𝑬 × 𝑯∗). 𝑧̂ 𝑑𝑥𝑑𝑦 ∞
(2)
5
Poynting vector (𝑆𝑧 = (𝑬 × 𝑯∗). 𝑧̂). Two butt-coupling junctions of the HSHPW and DHS
waveguide in the MZI sensing arm create waveguide discontinuities. The least squares boundary residual (LSBR) method [48] is used in conjugation with FV-FEM for rigorous investigations of power transfer and transmission loss of these two butt-coupled waveguides. Minimization of the vector functional 𝑑𝑮 = 0 satisfy the continuity of the both tangential E and H field components on both sides of a waveguide junction and provides a stationary solution by least squares means. The functional can be represented as
𝑮 = ∫ [|𝑬𝑡1− 𝑬 𝑡
2|2+ 𝑚. 𝑍
02|𝑯1𝑡− 𝑯𝑡2|2]𝑑𝑥𝑑𝑦 (3)
The subscript 𝑡, superscripts numbers (1 and 2), 𝑍02 and 𝑚 represents the transverse components of fields (E and H), the mode fields belonging to the right and the left side of the junction, free-space impedance and a weighting factor, respectively.
A single output, unbalanced, asymmetric arm and unequal power split/combine MZI is used as a transducer device in the detection of a small refractive index change of isopropanol depending on either temperature and volume concentration of isopropanol solution. The complete optical characterization set-up and a schematic diagram of HSHPW (in sensing arm) and DHS (in reference arm) incorporated MZI are shown in Figs. 2(a) and (b), respectively. The light from a tunable CW laser can be launched into MZI with the help of a grating coupler. The isolator can be used to prevent unwanted feedback to the CW laser cavity. The polarization controller is set-up at the input for allowing only TM mode. At the device end, an optical fiber is used to carry the characterization response to a high precision optical spectrum analyzer (OSA) for further analyses. The HSHPW is inserted in between fixed length 𝑆𝑖𝑂2 clad DHS waveguides (𝐿𝐷𝐻𝑆 = 10 𝜇m) on both sides (Fig. 1(a)), together they form the sensing arm of length, 𝐿𝑆𝑒𝑛 = 2𝐿𝐷𝐻𝑆+ 𝐿𝐻𝑆𝐻𝑃𝑊. On the other hand, the reference arm of length 𝐿𝑅𝑒𝑓 consists of only 𝑆𝑖𝑂2 clad DHS with four 90° bends of radius 𝑅𝐵 = 5 𝜇m (very low bending loss, thus, neglected in further calculations) and straight sections (𝐿𝑅1, 𝐿𝑅2, 𝑎𝑛𝑑 𝐿𝑅3) to make the device feasible to change the arm length for
calibration of frequency spectral range (FSR) and sensitivity (𝑆𝐷). Thus, the 𝐿𝑅𝑒𝑓 can be expressed
as, 𝐿𝑅𝑒𝑓 = (2𝜋𝑅𝐵) + 𝐿𝑅1+ 𝐿𝑅2+ 𝐿𝑅3. The DHS straight section, 𝐿𝑅2 is considered to have same length as 𝐿𝐻𝑆𝐻𝑃𝑊 in sensing arm. Therefore, only 𝐿𝑅1 and 𝐿𝑅3 (𝐿𝑅1 = 𝐿𝑅3) are left free of length calibration. The MZI has 𝑆𝑖𝑂2 cladding as cover medium except for HSHPW that creates a sensing window, by which the liquid isopropanol is infiltrated in the sensing region (slot + cover medium). During sensing, the differential phase change (Δ𝜙) between both arms depends on the optical path difference (OPD) arises due to a refractive index change of isopropanol as
Δ𝜙 =2𝜋
6
𝑃𝑜𝑢𝑡 = 1
4. 𝑃𝑖𝑛 (𝑒
−2𝛼𝑅𝑒𝑓𝐿𝑅𝑒𝑓+ 𝑒−2𝛼𝑆𝑒𝑛𝐿𝑆𝑒𝑛). (1 +𝐹cos Δ𝜙) (5)
Here 𝛼𝑅𝑒𝑓, 𝛼𝑆𝑒𝑛 represent the attenuation constants in Np/𝜇m associated with the reference and sensing arms waveguides, respectively and 𝐹 represents the fringe visibility of MZI output given as:
𝐹 = 2𝑒
−𝛼𝑅𝑒𝑓𝐿𝑅𝑒𝑓𝑒−𝛼𝑆𝑒𝑛𝐿𝑆𝑒𝑛
𝑒−2𝛼𝑅𝑒𝑓𝐿𝑅𝑒𝑓 + 𝑒−2𝛼𝑆𝑒𝑛𝐿𝑆𝑒𝑛 (6)
It is being assumed that the input power is distributed equally (𝑃𝑖𝑛) in both the arms. The HSHPW in the sensing arm has a significant amount of quasi-TM modal loss compared to the DHS which can be assumed to be loss-less (quasi-TM) [40] i.e. 𝛼𝑅 = 0 and the transmittance, 𝑒−2𝛼𝑅𝐿𝑅𝑒𝑓 = 1 for a short length waveguide. Small scattering loss in both the branches can be included separately if necessary. The mode propagation loss in HSHPW and butt-coupling losses at the junction 1 and 2 (𝐽1 and 𝐽2) in sensing arm (Fig. 2(b)) affect the overall device output power and its fringe visibility (𝐹). However, it can be compensated by tuning the coupling section (𝐿𝑥) of the input directional coupler so that, the sensing arm receives more power to balance the device insertion loss and thus, improve the interference fringe visibility. Furthermore, the only unaccounted loss comes from the small attenuation perturbation (Δ𝛼𝑆) in the sensing HSHPW during homogeneous refractometric changes of isopropanol solution. Therefore, the formulation of the MZI output power (𝑃𝑜𝑢𝑡) can be shown to be as:
𝑃𝑜𝑢𝑡 =
1
2[𝑃𝑖𝑛𝑅+ (𝑃𝑖𝑛𝑆. 𝜏𝐽1. 𝜏𝐽2. 𝑒
−2(𝛼𝐻𝑆𝐻𝑃𝑊±Δ𝛼𝑆)𝐿𝐻𝑆𝐻𝑃𝑊)](1 +𝐹′. cos Δ𝜙) (7)
Where the modified fringe visibility (𝐹′) is given by
𝐹′= 2√𝑃𝑖𝑛𝑅 . 𝑃𝑖𝑛𝑆. 𝜏𝐽1. 𝜏𝐽2 . 𝑒
−(𝛼𝐻𝑆𝐻𝑃𝑊±Δ𝛼𝑆)𝐿𝐻𝑆𝐻𝑃𝑊
𝑃𝑖𝑛𝑅+ 𝑃𝑖𝑛𝑆. 𝜏𝐽1. 𝜏𝐽2. 𝑒−2(𝛼𝐻𝑆𝐻𝑃𝑊±Δ𝛼𝑆)𝐿𝐻𝑆𝐻𝑃𝑊 (8)
The 𝑃𝑖𝑛𝑅 and 𝑃𝑖𝑛𝑆 represent the unequally distributed input power at the reference and sensing
arms, respectively. The 𝜏𝐽1 and 𝜏𝐽2 denote the transmittance at the waveguide discontinuities 𝐽1
and 𝐽2, respectively and 𝛼𝐻𝑆𝐻𝑃𝑊 is the quasi-TM mode attenuation constant of the HSHPW. The frequency spectral range (FSR) of the MZI is calculated by
𝐹𝑆𝑅 = 𝜆
2
[(𝑛𝑔,𝐷𝐻𝑆𝐿𝐷𝐻𝑆+ 𝑛𝑔,𝐻𝑆𝐻𝑃𝑊𝐿𝐻𝑆𝐻𝑃𝑊) − 𝑛𝑔,𝐷𝐻𝑆𝐿𝑅𝑒𝑓] (9)
where 𝜆, 𝑛𝑔,𝐷𝐻𝑆 and 𝑛𝑔,𝐻𝑆𝐻𝑃𝑊 are the operating wavelength and group index of DHS and HSHPW,
7
to increase the differential phase change between the two arms. This is achieved by the light guiding through materials with negative and positive TOCs in sensing and reference arms, respectively. The temperature sensitivity (𝑆𝑇) of the MZI device i.e. the wavelength shift (Δ𝜆) of
destructive fringes with respect to temperature (𝑇) is defined as [50]
𝑆𝑇 =
𝐹𝑆𝑅. [{(𝑑𝑛𝑒𝑓𝑓,𝐷𝐻𝑆𝑑𝑇 ) . 𝐿𝐷𝐻𝑆+ (
𝑑𝑛𝑒𝑓𝑓,𝐻𝑆𝐻𝑃𝑊
𝑑𝑇 ) . 𝐿𝐻𝑆𝐻𝑃𝑊} − (
𝑑𝑛𝑒𝑓𝑓,𝐷𝐻𝑆
𝑑𝑇 ) . 𝐿𝑅𝑒𝑓]
𝜆
(10)
2.2 Waveguide materials
The wavelength and temperature dependent Si refractive indices are obtained from the Sellmeier equation [51], valid for the wavelength and temperature range of 1.2 to 14 𝜇m and -173 to 476 °C, respectively. 𝑆𝑖𝑂2 has positive TOC (𝑑𝑛/𝑑𝑇) of +1.1 × 10⁻⁵ /°C and its refractive indices have
been calculated by the Sellmeier equation [52]. Besides, the liquid isopropanol has a high negative TOC of −4.5 × 10⁻⁴/°C and its refractive index as a function of wavelength is obtained from a least-squares approximation based Sellmeier equation [53] acceptable for the wavelength range of 0.185 – 2.8 𝜇m. The temperature dependent complex refractive index of the metal (Ag) is evaluated by the Drude model [54], can be expressed as
𝜖(𝜆) = 𝜖𝑟+ 𝑗𝜖𝑖 = 𝜖∞−
𝜔𝑝2
𝜔(𝜔 + 𝑗𝜔𝑐)
(11)
here the parametric values of 𝜖∞ and collision frequency (𝜔𝑐) for Ag are taken as 3.1 and 0.31 × 10¹⁴ rad/s. The plasma frequency (𝜔𝑝) has a strong temperature dependency and is given by, 𝜔𝑝 = 𝜔𝑝0. 𝑒−𝐴𝑉(𝑇0).(𝑇−𝑇0)/2 , where 𝜔𝑝0, 𝐴𝑉 are the plasma frequency at the ideal/room temperature, 𝑇0 and volume expansion coefficient (Α𝑉 = 3Α𝐿 = 5.7 × 10⁻⁵ /°C) of Ag,
respectively.
By considering the TOC (𝑑𝑛/𝑑𝑇), the variation of isopropanol refractive index with temperature is obtained by, 𝑛𝑇 = 𝑛𝑇0+ (𝑇 − 𝑇0)𝑑𝑛/𝑑𝑇, where 𝑛𝑇0 and 𝑛𝑇 are the refractive indices of the isopropanol at a known and desired temperature 𝑇0 and 𝑇, respectively. Additionally, the refractive index variation of isopropanol/water solution depends on the volume concentration of isopropanol and is determined by using the Lorentz-Lorenz equation [44] for a binary solution.
3.
Analyses and results
3.1 Optimization of waveguide parameters
8
slot above the metal. This in turn increases the power confinement in the slot and sensing region (slot + cover medium) compared to a conventional dielectric horizontal slot waveguide. The HSHPW dimensions, such as waveguide width (𝑊𝑆𝑖), metal thickness (𝐻𝐴𝑔), Si slab height (𝐻𝑆𝑖),
and slot height (𝐻𝑠𝑙𝑜𝑡) are optimized to confine the maximum power inside the low index slot
region at the operating wavelength of 1550 nm. In this case, the slot and cover medium are considered to be filled with 100% isopropanol. Throughout the FV-FEM simulations, existing one-fold symmetry is exploited and only half of the waveguide is discretized with 1,280,000 non-uniform triangular elements with a minimum element size of 0.2 nm close to the metal surface to resolve the sub-wavelength field confinement accurately. Figures 3(a) and (b) depict 𝐸𝑦 field
distributions of the quasi-TM fundamental mode of DHS and HSHPW, respectively. The dominant
𝐸𝑦 field is mostly confined in the low index horizontal slot region of the DHS and HSHPW.
However, compared to 𝑆𝑖𝑂2 clad DHS waveguide, the HSHPW confined more power in the horizontal slot region containing isopropanol, as preferred. In Fig. 3(c), the solid blue and red dashed lines depict the normalized 1D filed plots of 𝐸𝑦 (top) and 𝐻𝑥 (bottom) fields along y-axis
of HSHPW and DHS waveguide, respectively. The quasi-TM 𝐻𝑥 field of the DHS (red dashed line) is continuous, showing its two peaks in the top and bottom Si layers and a lower value in the low index 𝑆𝑖𝑂2 slot. The dominant 𝐸𝑦 field of the similar waveguide shows a symmetric
distribution along y-axis with a maximum confinement in the slot. The quasi-TM 𝐻𝑥 field of the HSHPW shows a positive peak in the Si layer, and a small negative peak at the interface of thin Ag layer and low index slot region. On the other hand, the dominant 𝐸𝑦 field is confined maximally
in the low index isopropanol contained slot, and moderately in the top clad region (blue solid line). This 𝐸𝑦 field is useful for the detection of a small refractometric change. Additionally, the
Ag+𝑆𝑖𝑂2 buffer layer of HSHPW only confines a very low ~0.1% of light. Therefore, the rest of the guided light is considered to enhance the slot and sensing region confinement, and also sensitivity of the waveguide.
The variations of 𝑛𝑒𝑓𝑓, 𝛼′(dB/𝜇m), and slot confinement (Γ𝑠𝑙𝑜𝑡) of HSHPW with 𝐻𝐴𝑔 are shown in Fig. 4. The inset figure shows the confinement in the Ag layer (Γ𝐴𝑔) against 𝐻𝐴𝑔. Other parameters, 𝑊𝑆𝑖, 𝐻𝑆𝑖 and 𝐻𝑠𝑙𝑜𝑡 are kept fixed at 700, 150, and 100 nm, respectively. It can be observed that for the fixed values of 𝑊𝑆𝑖, 𝐻𝑆𝑖, and 𝐻𝑠𝑙𝑜𝑡, the 𝐻𝐴𝑔 variations within the range of 80
to 1000 nm have no visible effect on 𝑛𝑒𝑓𝑓, 𝛼′, and Γ𝑠𝑙𝑜𝑡. But for any value of 𝐻𝐴𝑔 lower than 80 nm, all four parameters increase rapidly. Γ𝑠𝑙𝑜𝑡 increases from its base value of 58.59% to 59%
shows a very small change. Besides, the confinement in the lossy Ag layer (Γ𝐴𝑔) shows a rapid increment from its base value of 0.101% to a high 4.044%, which results in a larger change in mode attenuation from 0.037 dB/𝜇m to 0.12 dB/𝜇m, that may be unacceptable for some designs. With the variation of the temperature, Ag metal thickness may be expanded in the normal direction. Thus, over the complete range of temperature variation (20°C – 60°C), using the augmented thermal expansion coefficient expression Α′𝐿 = Α𝐿1+𝜇
1−𝜇, shows only a 0.16% 𝐻𝐴𝑔 increment in its
thickness, where 𝜇 = 0.37 is the Poisson number of Ag. Such a small thickness variation of the Ag metal film with temperature would have a negligible effect on the 𝑛𝑒𝑓𝑓, 𝛼 (Np/𝜇m) and Γ𝑠𝑙𝑜𝑡. The contour plots in Figs. 5(a) and (b) show a combined effect of 𝑊𝑆𝑖 and 𝐻𝑆𝑖 on the 𝑛𝑒𝑓𝑓 and Γ𝑠𝑙𝑜𝑡, respectively. Here, 𝐻𝐴𝑔 and 𝐻𝑠𝑙𝑜𝑡 are fixed at 150 and 100 nm, respectively. In this case, 𝑛𝑒𝑓𝑓
increases faster with the 𝐻𝑆𝑖 for a fixed 𝑊𝑆𝑖 than that of the 𝑊𝑠𝑖increases for a fixed 𝐻𝑠𝑖. The Γ𝑠𝑙𝑜𝑡
9
range of 700 to 800 nm and 100 to 180 nm, respectively. An abrupt Γ𝑠𝑙𝑜𝑡 variation is observed when 𝑊𝑆𝑖 > 800 nm and 𝐻𝑆𝑖 is in the range of ~150 to 300 nm. This local change has been identified due to the occurrence of second order quasi-TE mode (more light confines in the Si slab) within a close proximity of quasi-TM fundamental mode. In this range, further investigations were carried out to identify the optimum values of these design parameters. Figure 6(a) shows the Γ𝑠𝑙𝑜𝑡, Γ𝑐𝑙𝑎𝑑
and Γ𝑠𝑙𝑜𝑡+𝑐𝑙𝑎𝑑 variations against 𝑊𝑆𝑖 when the 𝐻𝑠𝑙𝑜𝑡 and 𝐻𝑆𝑖 = 𝐻𝐴𝑔 are fixed at 100 and 150 nm, respectively. The Γ𝑠𝑙𝑜𝑡 increases with 𝑊𝑆𝑖, reaches a maximum value of 59.24% for 𝑊𝑆𝑖= 740 nm and then decreases. On the other hand, Γ𝑐𝑙𝑎𝑑 shows a linear reduction with the increase of 𝑊𝑆𝑖. As a result, the resultant Γ𝑠𝑙𝑜𝑡+𝑐𝑙𝑎𝑑 also decreases with the increase of 𝑊𝑆𝑖. The optimum value of 𝑊𝑆𝑖 is considered to be 740 nm which gives maximum slot confinement, Γ𝑠𝑙𝑜𝑡 = 59.24% and corresponding Γ𝑠𝑙𝑜𝑡+𝑐𝑙𝑎𝑑 = 82.04%. Similarly, these confinement variations with 𝐻𝑆𝑖 have been
shown in Fig. 6(b). In this case, the Γ𝑠𝑙𝑜𝑡 increases with 𝐻𝑆𝑖 shows a maximum confinement of
59.60% at 𝐻𝑆𝑖 = 140 nm and then decreases. However, 𝐻𝑆𝑖 = 140 nm has slightly higher loss (𝛼′ =
0.038 𝑑𝐵/𝜇m) compared to the 150 nm (𝛼′= 0.036 𝑑𝐵/𝜇m). The Γ𝑐𝑙𝑎𝑑 decreases in a hyperbolic nature and shows Γ𝑐𝑙𝑎𝑑 = 22.80% when 𝐻𝑠𝑖 = 150 nm. Therefore, with the Γ𝑠𝑙𝑜𝑡+𝑐𝑙𝑎𝑑 = 82.04%, the optimum value of 𝐻𝑆𝑖 is considered to be 150 nm.
Figures 7(a) and (b) show the quasi-TM and TE power confinements (Γ𝑠𝑙𝑜𝑡, Γ𝑐𝑙𝑎𝑑, and Γ𝑠𝑙𝑜𝑡+𝑐𝑙𝑎𝑑)
with 𝐻𝑠𝑙𝑜𝑡 when 𝑊𝑆𝑖, 𝐻𝑆𝑖 and 𝐻𝑠𝑙𝑜𝑡 are kept fixed at 740, 150 and 150 nm, respectively. Figure
7(a) shows that with the increment of 𝐻𝑠𝑙𝑜𝑡, the Γ𝑠𝑙𝑜𝑡 of quasi-TM mode, shown by a black solid line, increases and reaches its maximum value of 59.38% at 𝐻𝑠𝑙𝑜𝑡 = 90 nm and then decreases gradually with further increase. The Γ𝑐𝑙𝑎𝑑 increases with the 𝐻𝑠𝑙𝑜𝑡 shown by a red dashed line and shows a 22.80% power confinement for 𝐻𝑠𝑙𝑜𝑡 = 100 nm. The resultant Γ𝑠𝑙𝑜𝑡+𝑐𝑙𝑎𝑑, shown by a blue dashed-dotted line, shows a bell-shaped variation with its peak value of Γ𝑠𝑙𝑜𝑡+𝑐𝑙𝑎𝑑 = 82.04% for 100 nm slot height (shown by the right-hand side scale). On the other hand, the HSHPW with 𝐻𝑠𝑙𝑜𝑡 = 90 nm has a comparatively higher loss (0.040 dB/𝜇m) than that of the 100 nm (0.036 dB/𝜇m). Likely, Fig. 7(b) shows a similar variation with the 𝐻𝑠𝑙𝑜𝑡 for the fundamental quasi-TE mode.
Within the complete range (40 to 150 nm) of 𝐻𝑠𝑙𝑜𝑡, the slot and clad region confine a much lower
power (Γ𝑠𝑙𝑜𝑡 and Γ𝑐𝑙𝑎𝑑) than that of the quasi-TM mode. As a result, the sensing region shows only
~30 to 34% power confinement (Γ𝑠𝑙𝑜𝑡+𝑐𝑙𝑎𝑑) within the range of 𝐻𝑠𝑙𝑜𝑡. The lower power confinement in the low index slot makes the quasi-TE mode less sensitive to the small refractometric changes of liquid isopropanol.
Summarizing the above studies, we can conclude that the fundamental quasi-TM mode of HSHPW is highly sensitive to slot refractometric changes. With the optimizing design parameters, the metal strip loaded HSHPW has shown an enhanced performance in terms of the slot, sensing region power confinement (Γ𝑠𝑙𝑜𝑡 = 59.24%, Γ𝑠𝑙𝑜𝑡+𝑐𝑙𝑎𝑑 = 82.04%) and the mode power attenuation, 𝛼𝐻𝑆𝐻𝑃𝑊′ = 0.036 dB/𝜇m. Finally, all the optimized HSHPW dimensions with 100% isopropanol can be summarized as, Si slab/waveguide width (𝑊𝑆𝑖) = 740 nm, height (𝐻𝑆𝑖) = 150 nm, slot height (𝐻𝑠𝑙𝑜𝑡) = 100 nm and the thickness of Ag strip (𝐻𝐴𝑔) = 150 nm for the operating wavelength of 𝜆
= 1550 nm.
3.2 MZI design with HSHPW and DHS waveguide
10
mode propagation loss of the HSHPW. These waveguide discontinuities have been analyzed by using the LSBR (Eq. 3) method and the result shows the transmission coefficient at the HSHPW-DHS junction is 𝜌𝐽1 = 𝜌𝐽2= 0.85339. Thus, the junction transmittance has the value of 𝜏𝐽1 =
𝜏𝐽2 = |𝜌|2 = 0.73 which yields the insertion loss at each junction of 1.377 dB. For the MZI design
purpose, we have considered three different HSHPW lengths (𝐿𝐻𝑆𝐻𝑃𝑊) such as 20, 30 and 40 𝜇m.
These three waveguide lengths provide the transmittance (𝜏𝐻𝑆𝐻𝑃𝑊 = 𝑒−2𝛼𝐻𝑆𝐻𝑃𝑊𝐿𝐻𝑆𝐻𝑃𝑊) values of 0.84, 0.78 and 0.71, respectively. Thus, the total transmittance values (𝜏𝑆𝑒𝑛 = 𝜏𝐽1. 𝜏𝐽2. 𝜏𝐻𝑆𝐻𝑃𝑊) of the HSHPW incorporated sensing arm for 𝐿𝐻𝑆𝐻𝑃𝑊 = 20, 30, and 40 𝜇m are 0.45, 0.41, and 0.38, respectively. An equal power division (50:50) at the reference and sensing arms of this type of plasmonic waveguide assisted MZI will result in an imbalance of light intensity at both the arms which in turn provides a poor interference fringe visibility (𝐹) at the output (𝑃𝑜𝑢𝑡). This
shortcoming can be mitigated by using asymmetric power splitting in the sensing and reference arms. To obtain unequal power splitting, the coupling section (𝐿𝑥) of the input directional coupler
can be adjusted depending on the power requirements in the sensing arm, 𝑃𝑖𝑛−𝑆𝑒𝑛 = 1/(1 + 𝜏𝑆𝑒𝑛)
and reference arm, 𝑃𝑖𝑛−𝑅𝑒𝑓 = (1 − 𝑃𝑖𝑛−𝑆𝑒𝑛). Figure 8(a) shows a graphical representation of the 𝑃𝑖𝑛−𝑆𝑒𝑛 and 𝑃𝑖𝑛−𝑅𝑒𝑓 requirement depending on the length of HSHPW used for sensing. As the junction (𝐽1 and 𝐽2) losses due to waveguide discontinuities are constant, so the only variable loss is considered for power fraction calculation is the modal loss due to different 𝐿𝐻𝑆𝐻𝑃𝑊. With the increment of 𝐿𝐻𝑆𝐻𝑃𝑊 from 10 to 50 𝜇m, the mode propagation loss increases from 0.36 to 1.84 dB. To counter that, the input power distribution ratio (𝑃𝑖𝑛−𝑆𝑒𝑛/𝑃𝑖𝑛−𝑅𝑒𝑓) needs to be changed from
67% / 33% to 74% / 26%. The required 𝑃𝑖𝑛−𝑆𝑒𝑛 and 𝑃𝑖𝑛−𝑅𝑒𝑓 for 𝐿𝐻𝑆𝐻𝑃𝑊 = 20, 30, and 40 𝜇m are 0.69, 0.71, 0.72, and 0.31, 0.29 and 0.28 respectively, shown by the red and blue lines. These unequal power distributions not only compensate for the losses in sensing arm but also improve the 𝑃𝑜𝑢𝑡 with a very high interference fringe visibility (𝐹′~1), which is highly required for an
accurate measurement. The asymmetric power distribution demands an appropriate tuning of coupling section at the input directional coupler. Figure 8(b) represents the desired coupling section (𝐿𝑥) variations of 𝑆𝑖𝑂2 clad DHS waveguide based directional coupler (inset of Fig. 8(b)) as a function of gap (separation) between two DHS waveguides and the 𝐿𝐻𝑆𝐻𝑃𝑊. The desired length of the coupling section (𝐿𝑥) can be calculated from the original coupling length (𝐿𝑐) and the 𝑃𝑖𝑛−𝑆𝑒𝑛 as, 𝐿𝑥 = (2𝐿𝑐/𝜋). cos−1√𝑃
𝑖𝑛−𝑆𝑒𝑛. The 𝐿𝑥 value increases as the gap increases form 250
nm to 450 nm. Moreover, with the increase of 𝐿𝐻𝑆𝐻𝑃𝑊 the 𝐿𝑥 linearly decreases a constant gap. For a smaller gap, the 𝐿𝑥 has a smaller value than for a larger gap. Hence, depending on the user’s
preferences, one can easily choose a suitable gap and the corresponding 𝐿𝑥 values for different
𝐿𝐻𝑆𝐻𝑃𝑊. As an example, for the gaps of 350 and 400 nm, the 𝐿𝑥 values for 𝐿𝐻𝑆𝐻𝑃𝑊 = 20, 30 and
40 𝜇m are 10.99, 10.64, 10.29 𝜇m and 13.98, 13.53 and 13.09 𝜇m, respectively, to achieve the required asymmetric power distributions.
3.3 Device performance as a sensor
A well designed MZI sensor needs a significant attention on the calibration of free spectral range (FSR) and interference fringe visibility (𝐹′) of the output power, 𝑃𝑜𝑢𝑡. After setting up the
optimized waveguide design parameters for the MZI arms, 𝐿𝐻𝑆𝐻𝑃𝑊 and 𝐿𝑥 for the input directional
coupler, the FSR and 𝐹′ parameters are investigated and evaluated as a function of 𝐿𝑅𝑒𝑓 and
11
arm light output thus degrade the interference fringe visibility. With the unequal power distributions, more power is launched at the sensing arm input which not only balance the losses but also provides an equal output at both MZI arms. Figure 9(a) depicts the advantages of using an unequal power distribution over the more traditional 50:50 power splitting. The black line indicates a significant reduction of the 𝐹 parameter with the increase of 𝐿𝐻𝑆𝐻𝑃𝑊. However, the unequal power splitting shows a significant improvement with almost an ideal value of 𝐹′≃ 1. Under this condition, the 𝐹′ parameters are calculated with the augmented visibility equation (Eq. 7) and the results show a very high fringe visibility (𝐹′≃ 1) for all 𝐿𝐻𝑆𝐻𝑃𝑊s in expenses with increasing insertion loss. For these three 𝐿𝐻𝑆𝐻𝑃𝑊s (20, 30 and 40 𝜇m) incorporating unequal power splitting the device insertion losses are 2.06, 2.32 and 2.56 dB, respectively when 100% isopropanol is used at temperature T = 20 °C. Beside the visibility, the FSR is another important parameter which indicates the frequency spacing of the MZI transmission peaks. A unit wavelength changes with very small power change results in a large FSR which may be unacceptable due to added difficulties in detection of the interference wavelength by optical spectrum analyzer (OSA). Thus, as a compromise, a relatively small FSR values of 10 and 15 nm have been considered and the arm lengths are calibrated accordingly. The FSR is calculated as a function of 𝐿𝑅𝑒𝑓 and 𝐿𝑆𝑒𝑛 (Eq. 8) and the results are shown in Fig. 9(b). The variations indicate
that the lower FSR requires higher 𝐿𝑅𝑒𝑓 for a fixed 𝐿𝐻𝑆𝐻𝑃𝑊. The horizontal black dashed lines indicate the 10 and 15 nm FSR and its corresponding 𝐿𝑅𝑒𝑓 values for a fixed 𝐿𝐻𝑆𝐻𝑃𝑊. In our design, the 𝐿𝑅𝑒𝑓 calibration only demands the change in the straight waveguide sections (𝐿𝑅1, 𝐿𝑅2 and
𝐿𝑅3) as the bending sections of radius 5 𝜇m cover a fixed length of 𝐿𝐵 = 31.42 𝜇m. For the three
fixed 𝐿𝐻𝑆𝐻𝑃𝑊 values (20, 30 and 40 𝜇m) the reference arm length (𝐿𝑅𝑒𝑓 = 2𝜋𝑅𝐵+𝐿𝑅1+ 𝐿𝑅2+
𝐿𝑅3 ) with different sections to obtain FSR = 10 and 15 nm are tabulated in Table 1.
Our aim is to design the MZI for the temperature and the volume concentration sensing of any liquid. In this study, we have considered liquid isopropanol for our investigations. The quasi-TM effective index difference (TM-Δ𝑛𝑒𝑓𝑓) of the optimized HSHPW and the DHS waveguide with the temperature for 100% isopropanol are shown in Fig. 10(a). The red line shows a positive and linear Δ𝑛𝑒𝑓𝑓 variation of 𝑆𝑖𝑂2 clad DHS waveguide, whereas, the blue dashed line shows the same Δ𝑛𝑒𝑓𝑓 variation of the HSHPW but in the negative direction. The positive and negative TM-Δ𝑛𝑒𝑓𝑓 variations of the HSHPW and the DHS provides a temperature dependent opposite phase change in both arms which enhance the temperature sensitivity of the device. The quasi-TM effective index variation with temperature (𝑑𝑛𝑒𝑓𝑓/𝑑𝑇) of both the HSHPW and DHS are -4.61×10⁻⁴/°C and +6.62×10⁻⁵/°C, respectively. The black line in Fig. 9(b) represent a negative quasi-TM Δ𝑛
𝑒𝑓𝑓
variation of the optimized HSHPW with the volume fraction of isopropanol in the isopropanol/water solution at a fixed temperature, T = 20 °C. During volume concentration sensing, the temperature is kept fixed so that the only refractive index change occurs at the HSHPW due to the different concentration of isopropanol in the solution. The refractometric sensitivity of the HSHPW can be evaluated as, 𝑆𝐻𝑆𝐻𝑃𝑊 = Δ𝑛𝑒𝑓𝑓/Δ𝑛 = 1.13. The HSHPW shows
a higher refractive index sensitivity compared to a recently published complex hollow hybrid plasmonic design scheme [39].
12
(varied from 20°C to 60°C) of 100% isopropanol infiltrated in the sensing HSHPW region. It can be clearly observed that with the temperature increment the MZI transmission spectra show the red shift (towards the right) because of a larger TOC of isopropanol compared to other materials such as Si, Ag, and 𝑆𝑖𝑂2. It should be noted that the wavelength shifts (Δ𝜆𝑇) increase with the
increment of 𝐿𝐻𝑆𝐻𝑃𝑊 and FSR. A temperature variation from 20°C to 60°C for the MZI design
with 𝐿𝐻𝑆𝐻𝑃𝑊 = 20, 30, and 40 𝜇m shows the Δ𝜆𝑇 of 4.25, 5.66, and 6.87 nm red shift, respectively, for FSR = 10 nm. Similarly, for the same temperature variations with aforementioned 𝐿𝐻𝑆𝐻𝑃𝑊 lengths the output transmission spectra are red shifted more by 5.48, 7.43, and 9.76 nm for FSR = 15 nm. Device insertion losses for 20, 30, and 40 𝜇m long HSHPW have the values around 2.06, 2.32, and 2.58 dB, respectively and the corresponding extinction ratios are larger than 25 dB. Figures 11(g) and (h) illustrate a linear increasing relationship of Δ𝜆𝑇 with the temperature (T) with 100% isopropanol concentration for 10 and 15 nm FSR, respectively. For the temperature ranging from 20°C - 60°C, the Δ𝜆𝑇 increases linearly with the increment of the T for all MZI designs with 𝐿𝐻𝑆𝐻𝑃𝑊 = 20, 30, and 40 𝜇m are shown by black, red, and blue lines, respectively. Changes for FSR = 10 nm are shown in Fig. 11(g) and for FSR = 15 nm in Fig. 11(h) by dashed and dashed-dotted lines, respectively. The device sensitivities (𝑆𝑇) can be evaluated from the slope of the fitted curves with the 𝑅2 value of 0.999. Thus, for the MZI with 𝐿
𝐻𝑆𝐻𝑃𝑊 = 20, 30, and 40
𝜇m has the temperature sensitivity (𝑆𝑇) values of 105.2 pm/°C, 140.6 pm/°C, and 172 pm/°C for
FSR = 10 nm, respectively and 138.1 pm/°C, 187 pm/°C, and 243.9 pm/°C, respectively for FSR = 15 nm which indicate much higher values compared to the recent published reports [27, 28]. Additionally, our proposed design works well in a wide temperature range from room temperature (~20°C) to the boiling point of isopropanol (82°C). Even other liquid chemicals with high boiling point could be used for temperature detection. Moreover, the sensing range (𝐹𝑆𝑅/𝑆𝑇) of the designed device with 𝐿𝐻𝑆𝐻𝑃𝑊 = 40 𝜇m can be derived for 10 and 15 nm FSR as ~58°C and ~61°C,
respectively. Detection limit (𝐷𝐿𝑇) is another important characteristic of a sensor that illustrate the
efficiency to resolve a smallest refractometric change of the target and it can be defined as the ratio of resolution of the transmission spectra (𝜆𝑅𝑒𝑠) to the device sensitivity (𝑆𝑇). The 𝜆𝑅𝑒𝑠 of a device depends not only on the resolution of the source and the measurement equipment (OSA) but also influenced by the extinction of the device and the noise present on the measured spectra. Thus, instead of using a specific 𝜆𝑅𝑒𝑠 value for a laser source and OSA, we have considered the device 𝜆𝑅𝑒𝑠 as 1 pm (approx.) for our theoretical investigations and as a result, our design with 40 𝜇m HSHPW can have the temperature detection limit or resolution (𝐷𝐿𝑇) of 0.0058°C and 0.004°C for the 10 and 15 nm FSR, respectively.
Next, the feasibility of the same MZI senor for the detection of volume concentration of isopropanol in the isopropanol/water solution at a constant temperature is also studied. For this study, we kept the temperature fixed at 20°C. Figures 12 (a) – (c) show the MZI transmission responses of the 20, 30, and 40 𝜇m long HSHPW as a refractometric sensor with the FSR value of 10 nm and Figs. 12 (d), (e), and (f) for FSR = 15 nm. The black spectrum represents the transmission output for 100% isopropanol at T = 20°C. Different colored spectra indicate different volume fraction of isopropanol and they also show a red shift of the wavelength (Δ𝜆𝐶) with the isopropanol volume concentration. These wavelength shifts (Δ𝜆𝐶) increase with the increment of both the 𝐿𝐻𝑆𝐻𝑃𝑊 and FSR. The extinction ratios for the device have the values larger than 20 dB and the insertion losses were almost similar to those calculated with 100% isopropanol at T = 20°C. These Δ𝜆𝐶s with the refractometric changes of the isopropanol solution are plotted in the
13
linearly increases with the reduction of isopropanol volume concentration. The horizontal x-axis indicates the refractive indices of isopropanol/water solution depending on the volume concentration (100% to 0%) of isopropanol. Therefore, the concentration sensitivities (𝑆𝐶) are
determined from the slope of the linearly fitted curves with 𝑅2 = 0.999. Thus, for the detection of isopropanol volume concentration, the sensitivity (𝑆𝐶) of the designed MZI with 𝐿𝐻𝑆𝐻𝑃𝑊 = 20, 30
and 40 𝜇m reaches 144.6 nm/RIU, 222.2 nm/RIU, and 290.3 nm/RIU, respectively for FSR = 10 nm and 218.1 nm/RIU, 327.6 nm/RIU, and 437.3 nm/RIU, respectively for FSR = 15 nm. It can be noted that the sensitivity increases linearly with the FSR and sensor length, 𝐿𝐻𝑆𝐻𝑃𝑊. For the
same device wavelength resolution (𝜆𝑅𝑒𝑠 = 1 pm), our MZI sensor with 40 𝜇m long HSHPW shows a considerable potential to measure the refractometric changes as small as 3.44 × 10⁻⁶ and
2.28 × 10⁻⁶ RIU for the 10 and 15 nm FSR, respectively. These results show an improved refractometric sensitivity compared to the hybrid plasmonic MZI design reported recently [39].
The HSHPW incorporated MZI device can also be used for surface sensing applications. We considered an ultra-thin biolayer of different thickness (𝑡𝑏𝑖𝑜 = 5, 10, and 15 nm) having refractive
index of 1.45 [34] on both the Si slab and slot region. The cover medium and the slot is filled with water solution. Figures 13(a) and (b) show the MZI output power spectra (𝑃𝑜𝑢𝑡) with 𝐿𝐻𝑆𝐻𝑃𝑊 = 40
𝜇m for the FSR values of 10 and 15 nm, respectively. The black curve represents the output spectrum for 𝑡𝑏𝑖𝑜 = 0 nm. Different colored spectra for different biolayer thickness (𝑡𝑏𝑖𝑜 = 5, 10,
and 15 nm) show blue shifts. These wavelength shifts (Δ𝜆𝑏𝑖𝑜) for two different FSR values (10
and 15 nm) are plotted against biolayer thickness (𝑡𝑏𝑖𝑜) in Fig. 13(c), shown by the blue dashed
and red dashed-dotted lines. The Δ𝜆𝑏𝑖𝑜 shows a linear decrement with 𝑡𝑏𝑖𝑜 for both the FSR values.
The MZI sensitivities (𝑆𝑏𝑖𝑜) for the detection of surface binding biomolecules are evaluated from the slope of the linear fitted curves with 𝑅2 = 0.999. The surface sensitivity (𝑆
𝑏𝑖𝑜) of the device
for the FSR values of 10 and 15 nm are -605.10 pm/nm and -920.30 pm/nm, respectively. It is also worth to notice that the extinction ratio of the proposed during surface sensing is larger than -25 dB.
4.
Conclusion
In conclusion, we report here the design of a novel metal strip loaded HSHPW which with its optimized designed parameters shows an enhanced power confinement of 59.24% and 82.04% in the low-index slot and possible total sensing region along with a low and acceptable loss. By integrating this HSHPW with the 𝑆𝑖𝑂2 clad DHS waveguide results in a compact on-chip MZI
sensing system, which not only shows a high sensitivity to the liquid temperature but also have a great potential in the detection of the liquid concentration. Waveguide optimizations, junction analyses and device performance have been studied theoretically with our in-house accurate FV-FEM and the LSBR methods. Our optimized HSHPW design shows a much higher refractometric sensitivity of 1.13. The MZI temperature sensitivity (𝑆𝑇) are 105.2 pm/°C and 138.1 pm/°C for 20
𝜇m long HSHPW in the sensing arm for the FSR values of 10 and 15 nm, respectively, and it can be increased to 172 pm/°C and 243.9 pm/°C with the 40 𝜇m 𝐿𝐻𝑆𝐻𝑃𝑊. The same device is also
14 exhibits the surface sensitivities of -605.10 pm/nm and -920.30 pm/nm for the FSR values of 10 and 15 nm, respectively. The effect of HSHPW modal loss and the junction losses are mitigated by using unequal power splitting at the MZI input which results in very high interference fringe visibility i.e. 𝐹′≃ 1. The low insertion loss, high fringe visibility, high extinction ratio, and most importantly enhanced sensitivities make the design attractive for bio-sensing and chemical analyses. On the other hand, the waveguide materials such as Si, 𝑆𝑖𝑂2, and noble metal (Ag) have high melting points and also nonreactive to biofluids, oils, and common liquid chemicals. Therefore, a broad range of liquids with enough high temperature could be tested by the HSHPW incorporated MZI sensor. Thus, our proposal serves the successful demonstration of an on-chip compact MZI sensor that can be realized with the help of well-matured state-of-the-art CMOS fabrication technologies. Both temperature and concentration sensors can be integrated in an on-chip arrayed design for simultaneous detection of both. Based on the preliminary results, this MZI sensor shows a great potential to be employed as a refractometric based temperature, liquid concentration, and surface sensing device.
Acknowledgements
This work was supported by City, University of London and in part by Erasmus Mundus AREAS+ PhD fellowship and SPIE Optics and Photonics Education Scholarship 2017 program for PhD and research funding.
References
[1] R. F. Oulton, V. J. Sorger, D. A. Genov, D. F. P. Pile, & X. Zhang, A hybrid plasmonic waveguide for subwavelength confinement and long-range propagation, Nature Photonics 2 (2008) 496
[2] D. Dai and S. He, A silicon-based hybrid plasmonic waveguide with a metal cap for a nano-scale light confinement, Opt. express 17 (2009) 16646 – 16653
[3] P. D. Flammer, J. M. Banks, T. E. Furtak, C. G. Durfee, R. E. Hollingsworth, and R. T. Collins, Hybrid plasmon/dielectric waveguide for integrated silicon-on-insulator optical elements, Opt. express 18 (2010) 21013 – 21023
[4] H. S. Chu, E. P. Li, P. Bai, and R. Hegde, Optical performance of single-mode hybrid dielectric-loaded plasmonic waveguide-based components, Appl. Phys. Lett. 96 (2010) 221103-1 – 3
[5] V. M. N. Passaro, C. de Tullio, B. Troia, M. L. Notte, G. Giannoccaro, and F. De Leonardis, Recent advances in integrated photonic sensors, Sens. 12 (2012) 15558 – 15598
[6] V. M. N. Passaro, M. La Notte, B. Troia, L. Passaquindici, F. De Leonardis, G. Giannoccaro, Photonic structures based on slot waveguides for nanosensors: state of the art and future developments, Int. J. Rev. Appl. Sci. 11 (2012) 8 – 26
15
[8] J. Homola, Present and future of surface plasmon resonance biosensors, Anal. Bioanal. Chem. 377 (2003) 528 – 539
[9] S. C. Tan, and B. C. Yiap, DNA, RNA, and protein extraction: the past and the present, J. Biomed. Biotechnol. 2009 (2009) 1 – 10
[10] H. Chen, M. Rangasamy, S. Y. Tan, H. Wang, B. D. Seigfried, Evaluation of five methods for total DNA extraction from western corn rootworm beetles, PLoS ONE 5 (2010) 1 – 6
[11] H. Chen, M. Ramachandra, and R. Padmanabhan, Biochemical characterization of a temperature-sensitive adenovirus DNA polymerase, Virology 205 (1994) 364 – 370
[12] N. Hirayama and Y. Sano, Fiber Bragg grating temperature sensor for practical use, ISA Trans. 39 (2000) 169 – 173
[13] Y. J. Rao, D. J. Webb, D. A. Jackson, L. Zhang, and I. Bennion, In-fiber Bragg grating temperature sensor system for medical applications, J. Lightwave Technol. 15 (1997) 779 – 784
[14] M. Sun, B. Xu, X. Dong, and Y. Li, Optical fiber strain and temperature sensor based on an in-line Mach-Zehnder interferometer using thin core fiber, Opt. Commun. 285 (2012) 3721 – 3725
[15] S. J. Qiu, Y. Chen, F. Xu, and Y. Q. Lu, Temperature sensor based on an isopropanol-sealed photonic crystal fiber in-line interferometer with enhanced refractive index sensitivity, Opt. Lett. 37 (2012) 863 – 865
[16] Q. Sun, X. Sun, W. Jia, Z. Xu, H. Luo, D. Liu, and L. Zhang, Graphene-assisted microfiber for optical-power based temperature sensor, IEEE Photonics Technol. Lett. 28 (2016) 383 – 386
[17] Z. Zhu, L. Liu, Z. Liu, Y. Zhang, and Y. Zhang, Surface-plasmon-resonance-based optical-fiber temperature sensor with high sensitivity and high figure of merit, Opt. Lett. 42 (2017) 2948 – 2951
[18] S. Weng, L. Pei, J. Wang, T. Ning, and J. Li, High sensitivity D-shaped hole fiber temperature sensor based on surface plasmon resonance with liquid filling, Photon. Res. 5 (2017) 103 – 107
[19] M. Deng, L. Liu, Y. Zhao, G. Yin, and T. Zhu, Highly sensitive temperature sensor based on an ultra-compact Mach-Zehnder interferometer with side-opened channels, Opt. Lett. 42 (2017) 3549 – 3552
[20] G. -D. Kim, H.-S. Lee, C. H. Park, S. S. Lee, B. T. Lim, H. K. Bae, and W. G. Lee, Silicon photonic temperature sensor employing a ring resonator manufactured using a standard CMOS process, Opt. Express 18 (2010) 22215 – 22221
16
[22] N. N. Klimov, T. Purdy, and Z. Ahmed, Fabry-Perot cavity-based silicon photonic thermometers with ultra-small footprint and high sensitivity, in Advanced Photonics 2015, OSA Technical Digest, paper SeT4C.4.
[23] C. M. Chang, and O. Solgaard, Fano resonances in integrated silicon Bragg reflectors for sensing applications, Opt. Express 21 (2013) 27209 – 27218
[24] N. N. Kilmov, S. Mittal, M. Berger, and Z, Ahmed, On-chip silicon waveguide Bragg grating photonic temperature sensor, Opt. Lett. 40 (2015) 3934 – 3936
[25] A. Irace, and G, Breglio, All-silicon optical temperature sensor based on Multi-Mode Interference, Opt. Express 11 (2003) 2807 – 28112
[26] J. F. Tao, H. Cai, Y. D. Gu, J. Wu, and A. Q. Liu, Demonstration of a photonic-based linear temperature sensor, IEEE Photonics Technol. Lett. 27 (2015) 249 – 271
[27] X. Guan, X. Wang, and L. H. Frandsen, Optical temperature sensor with enhanced sensitivity by employing hybrid waveguides in a silicon Mach-Zehnder interferometer, Opt. Express 24 (2016) 16349 – 16356
[28] Y. Zhang, P. Liu, S. Zhang, W. Liu, J. Chen, and Y. Shi, High sensitivity temperature sensor based on cascaded silicon photonic crystal nanobeam cavities, Opt. Express 24 (2016) 23037 – 23043
[29] Q. Liu, X. Tu, W. Kim, J. S. Kee, Y. Shin, K. Han, Y.-J. Yoon, G.-Q. Lo, and M. K. Park, Highly sensitive Mach-Zehnder interferometer biosensor based on silicon nitride slot waveguide, Sens. and Actuators B Chem. 188 (2013) 681 – 688
[30] S. Y. Nam, H. J. Chun, and Y. Mo Lee, Pervaporation separation of water-isopropanol mixture using carboxymethylated poly(vinyl alcohol) composite membranes, J. Appl. Polym. Sci. 72 (1999) 241 – 249
[31] X. Wang, X. Guan, Q. Huang, J. Zheng, Y. Shi, and D. Dai, Suspended ultra-small disk resonator on silicon for optical sensing, Opt. Lett. 38 (2013) 5405 – 5408
[32] T. Claes, J. G. Molera, K. D. Vos, E. Schacht, R. Baets, and P. Bienstman, Label-free biosensing with a slot-waveguide based ring resonator in silicon-on-insulator, IEEE Photon. J. 1 (2009) 197 – 204
[33] S. Chandran, R. K. Gupta, and B. K. Das, Dispersion enhanced critically coupled ring resonator for wide range refractive index sensing, IEEE J. Sel. Top. Quantum Electron. 23 (2017) 82000109 – 1 – 8200109 – 9
[34] S. Ghosh, and B. M. A. Rahman, An innovative straight resonator incorporating a vertical slot as an efficient bio-chemical sensor, IEEE J. Sel. Top. Quantum Electron. 23 (2017) 5200108 – 1 – 5200108 – 8
17
[36] J. Flueckiger, S. Schmidt, V. Donzella, A. Sherwali, D. M. Ratner, L. Chrostowski, and K. C. Cheung, Sub-wavelength grating for enhanced ring resonator biosensor, Opt. Express 24 (2016) 15672 – 15686
[37] X. Sun, D. Dai, L. Thylen, and L. Wosinski, High-sensitivity liquid refractive-index sensor based on Mach-Zehnder interferometer with a double-slot hybrid plasmonic waveguide, Opt. Express 23 (2015) 25688 – 25699
[38] M. S. Kwon, Theoretical investigation of an interferometer-type plasmonic biosensor using a metal-insulator-silicon waveguide, Plasmonics 5 (2010) 347 – 354
[39] X. Sun, L. Thylen, and L. Wosinski, Hollow hybrid plasmonic Mach-Zehnder sensor, Opt. Lett. 42 (2017) 807 – 810
[40] R. Sun, P. Dong, N. Feng, C. Hong, J. Michel, M. Lipson, and L. Kimerling, Horizontal single and multiple slot waveguides: optical transmission at 𝜆 = 1550 nm, Opt. Express 15 (2007) 17967 – 17972
[41] S. Ghosh and B. M. A. Rahman, Full vectorial finite element modelling: a composite plasmonic horizontal slot waveguide as a bio-sensor, in: 13th International Conference on Fiber Optics and Photonics, Tech. Digest OSA, 2016, paper Tu5C.3
[42] B. Kumari, a. Barh, R. K. Varshney, and B. P. Pal, Silicon-on-nitride slot waveguide: a promising platform as mid-IR trace gas sensor, Sens. and Actuators B Chem. 236 (2016) 759 – 764
[43] B. Kumari, R. K. Varshney, and B. P. Pal, Design of chip scale silicon rib slot waveguide for sub-ppm detection of N2O gas at mid-IR band, Sens. and Actuators B Chem. 255 (2017) 3409 – 3416
[44] S. Ghosh and B. M. A. Rahman, A compact Mach-Zehnder interferometer using composite plasmonic waveguide for ethanol vapor sensing, J. Lightwave Technol. 35 (2017) 3003 – 3011
[45] B. M. A. Rahman and J. B. Davies, Finite-element solution of integrated optical devices, J. Lightwave Technol. 2 (1984) 682 – 688
[46] B. M. A. Rahman and J. B. Davies, Penalty-function improvement of waveguide solution by finite element, IEEE Trans. Microwave Theory Tech. 32 (1984) 922 – 928
[47] S. Ghosh and B. M. A. Rahman, Evolution of plasmonic modes in a metal nano-wire studied by a modified finite element method, J. Lightwave Technol. 36 (2018) 809 – 818
[48] B. M. A. Rahman, and J. B. Davies, Analysis of optical waveguide discontinuities, J. Lightwave Technol. 6 (1988) 52 – 57
[49] P. Berini, Bulk and surface sensitivities of surface plasmon waveguides, New. J. Phys. 10 (2008) 105010 – 1- 105010 – 37
18
[51] H. H. Li, Refractive index of silicon and germanium and its wavelength and temperature derivatives, J. Phys. Chem. Ref. Data 9 (1980) 561 – 658
[52] I. H. Malitson, Interspecimen comparison of the refractive index of fused silica, J. Opt. Soc. Am. 55 (1965) 1205 – 1208
[53] E. Sani and A. Dell’Oro, Spectral optical constants of ethanol and isopropanol from ultraviolet to far infrared, Opt. Mater. 60 (2016) 137 – 141
19
Figure captions
Fig. 1 3D schematic of metal (Ag) strip loaded horizontal slot hybrid plasmonic waveguide (HSHPW) butt-coupled with 𝑆𝑖𝑂2 clad horizontal slot waveguide (DHS) at both ends. Inset
shows the cross-section of the HSHPW which works as an active sensing region. The red dashed lines indicate the waveguide discontinuities at the HSHPW and DHS waveguide junctions.
Fig. 2 Optical characterization set-up (a) and schematic top view (b) of the metal strip loaded HSHPW incorporated asymmetric MZI. The HSHPW is butt-coupled with 𝑆𝑖𝑂2 clad dielectric
horizontal slot (DHS) waveguide at both ends in the sensing arm of length, 𝐿𝑅𝑒𝑓 = 2𝐿𝐷𝐻𝑆+ 𝐿𝐻𝑆𝐻𝑃𝑊. Only DHS is employed in the reference arm having four bending sections of radius, 𝑅𝐵 = 5 𝜇m and three straight sections, 𝐿𝑅1, 𝐿𝑅2, and 𝐿𝑅3. Thus, total length of the reference
arm is 𝐿𝑅𝑒𝑓 = 2𝜋𝑅𝐵+ 𝐿𝑅1+ 𝐿𝑅2+ 𝐿𝑅3.
Fig. 3 (a) and (b) depict FV-FEM simulated 𝐸𝑦 field distributions of the quasi-TM
fundamental mode of 𝑆𝑖𝑂2 clad DHS waveguide and HSHPW, respectively. Distribution of
left-sided colour bars exhibit higher slot power confinement in HSHPW (b) compared to DHS waveguide (a). Blue solid and red dashed lines in top and bottom figure of (c) represent line
plots of dominant 𝐸𝑦 and 𝐻𝑥 fields, respectively along y-axis for both waveguides. Maximum
𝐸𝑦 field confines in the slot region and the peaks of 𝐻𝑥 field distributions show the position
of metal and high index dielectric materials in DHS and HSHPW.
Fig. 4 Effective index (𝑛𝑒𝑓𝑓), mode power attenuation (𝛼′), and slot confinement (Γ𝑠𝑙𝑜𝑡)
variations with thickness (𝐻𝐴𝑔) of silver metal film deposited on top of 𝑆𝑖𝑂2 buffer layer. The
inset figure shows the power confinement (Γ𝐴𝑔) variation of the Ag layer against 𝐻𝐴𝑔. Other
parameters such as, Si slab width (𝑊𝑆𝑖), height (𝐻𝑆𝑖), and slot height (𝐻𝑠𝑙𝑜𝑡) are kept fixed at
700, 150, and 100 nm, respectively.
Fig. 5 The 2D contour plots in (a) and (b) show the variations of 𝑛𝑒𝑓𝑓 and Γ𝑠𝑙𝑜𝑡, respectively
as a function of 𝑊𝑆𝑖 and 𝐻𝑠𝑙𝑜𝑡. The 𝐻𝑠𝑙𝑜𝑡 and 𝐻𝐴𝑔 are kept fixed at 100 and 150 nm,
respectively. A noticeable abrupt Γ𝑠𝑙𝑜𝑡 variation occurred when 𝑊𝑆𝑖 > 800 nm and 𝐻𝑆𝑖 is
within ∼150 to 300 nm.
Fig. 6 Variations of power confinement in slot (Γ𝑠𝑙𝑜𝑡), clad (Γ𝑐𝑙𝑎𝑑), and sensing region
20 dashed, and blue dashed-dotted curves represent the Γ𝑠𝑙𝑜𝑡, Γ𝑐𝑙𝑎𝑑, and Γ𝑠𝑙𝑜𝑡+𝑐𝑙𝑎𝑑 variations,
respectively. 𝑊𝑆𝑖, 𝐻𝑠𝑙𝑜𝑡, and 𝐻𝑆𝑖 are kept fixed at 740, 100, and 150 nm, respectively.
Fig. 7 (a) and (b) show the power confinement variations in the horizontal slot, clad, and sensing region (slot + clad) of the quasi-TM and TE modes, respectively against slot height (𝐻𝑠𝑙𝑜𝑡). Other parameters such as 𝑊𝑆𝑖, 𝐻𝑆𝑖, and 𝐻𝐴𝑔 are kept fixed at 740, 150, and 150 nm,
respectively.
Fig. 8 (a) depicts the input power requirements in the sensing and the reference arms depending on the HSHPW length in the MZI sensing arm. (b) shows desired coupling section (𝐿𝑥) variations of the input directional coupler as a function of HSHPW length and gap.
Fig. 9 (a) shows the fringe visibility (𝐹 and 𝐹′) of the MZI interference output with equal and
unequal power splitting schemes. For the 50:50 equal and unequal power splitting, the fringe visibility parameters are calculated using Eqs. 6 and 8, respectively. (b) illustrates FSR variations as a function of reference arm length (𝐿𝑅𝑒𝑓) for fixed 𝐿𝐻𝑆𝐻𝑃𝑊𝑠.
Fig. 10 (a) Blue dashed and red solid lines represent the variation of quasi-TM effective index
change (TM-Δ𝑛𝑒𝑓𝑓) of HSHPW and DHS waveguides, respectively with the surrounding
temperature. Positive and negative linear variations with slopes +6.62×10⁻⁵/°C and -4.61×10
-4/°C are obtained for DHS and HSHPW, respectively. (b) depicts a negative linear TM-Δ𝑛
𝑒𝑓𝑓
variation of the HSHPW with isopropanol volume concentration for a fixed temperature (20°C). The slope of the curve gives the waveguide refractive index sensitivity of 1.13.
Fig. 11 (a) – (f) MZI transmitted output responses for the temperature sensing of 100% liquid isopropanol. Figures (a), (b), and (c) on the left column indicate the transmission spectra with an FSR value of 10 nm. The right-sided figures (d), (e), and (f) indicate the same with an FSR value of 15 nm. Figures in each row (a, d), (b, e), and (c, f) depict the MZI output responses for 20, 30, and 40 𝜇m long HSHPW, respectively. (g) and (h) represent the
wavelength shift (Δ𝜆𝑇) variations with the changing temperature of isopropanol for 10 and
15 nm FSR values, respectively. Slope of each linear curve represents MZI sensitivity (𝑆𝑇) as
a temperature sensor.
Fig. 12 (a) – (f) indicate the MZI transmitted spectra for the volume concentration sensing of isopropanol-water solution at a fixed temperature of 20°C. The figures (a), (b), and (c) on the
21 row (a, d), (b, e) and (c, f) depict the output responses of the MZI with 𝐿𝐻𝑆𝐻𝑃𝑊 = 20, 30, and
40 𝜇m, respectively. (g) and (h) represent the linear variations of wavelength shift (Δ𝜆𝐶) with
the volume concentration of isopropanol for 10 and 15 nm FSR values, respectively. Slope of each linear curve represents the MZI sensitivity (𝑆𝐶) as a chemical concentration sensor.
Fig. 13 Surface sensing by asymmetric MZI sensor. (a) and (b) show the MZI transmitted
output power spectra for the FSR values of 10 and 15 nm, respectively for 𝐿𝐻𝑆𝐻𝑃𝑊 = 40 𝜇m.
5, 10, and 15 nm ultra-thin biolayers having refractive index of 1.45 are considered for
surface sensing. (c) represents linear variations of wavelength shift (Δ𝜆𝑏𝑖𝑜) against biolayer
thickness (𝑡𝑏𝑖𝑜). Slope of each linear curve denotes device sensitivity (𝑆𝑏𝑖𝑜) to detect binding
of biomolecules at the sensing region.
Figures
24 Fig. 4
32