Australia and New Zealand
John-Sebastian Eden,a,bJohn Kovaliski,c,dJanine A. Duckworth,c,eGrace Swain,aJackie E. Mahar,a,fTanja Strive,c,f Edward C. Holmesa
Marie Bashir Institute for Infectious Diseases and Biosecurity, Charles Perkins Centre, School of Biological Sciences and Sydney Medical School, The University of Sydney, Sydney, NSW, Australiaa
; Centre for Virus Research, Westmead Millennium Institute, Westmead, NSW, Australiab
; Invasive Animals Cooperative Research Centre, University of Canberra, Bruce, ACT, Australiac
; Biosecurity South Australia, Adelaide, SA, Australiad
; Landcare Research, Wildlife Ecology & Management, Lincoln, New Zealande ; Commonwealth Scientific and Industrial Research Organisation–Biosecurity Flagship, Black Mountain, ACT, Australiaf
ABSTRACT
The introduction of rabbit hemorrhagic disease virus (RHDV) into Australia and New Zealand during the 1990s as a means of controlling feral rabbits is an important case study in viral emergence. Both epidemics are exceptional in that the founder vi-ruses share an origin and the timing of their release is known, providing a unique opportunity to compare the evolution of a sin-gle virus in distinct naive populations. We examined the evolution and spread of RHDV in Australia and New Zealand through a genome-wide evolutionary analysis, including data from 28 newly sequenced RHDV field isolates. Following the release of the Australian inoculum strain into New Zealand, no subsequent mixing of the populations occurred, with viruses from both coun-tries forming distinct groups. Strikingly, the rate of evolution in the capsid gene was higher in the Australian viruses than in those from New Zealand, most likely due to the presence of transient deleterious mutations in the former. However, estimates of both substitution rates and population dynamics were strongly sample dependent, such that small changes in sample composi-tion had an important impact on evolucomposi-tionary parameters. Phylogeographic analysis revealed a clear spatial structure in the Australian RHDV strains, with a major division between those viruses from western and eastern states. Importantly, RHDV se-quences from the state where the virus was first released, South Australia, had the greatest diversity and were diffuse throughout both geographic lineages, such that this region was likely a source population for the subsequent spread of the virus across the country.
IMPORTANCE
Most studies of viral emergence lack detailed knowledge about which strains were founders for the outbreak or when these events occurred. Hence, the human-mediated introduction of rabbit hemorrhagic disease virus (RHDV) into Australia and New Zealand from known starting stocks provides a unique opportunity to understand viral evolution and emergence. Within Aus-tralia, we revealed a major phylogenetic division between viruses sampled from the east and west of the country, with both re-gions likely seeded by viruses from South Australia. Despite their common origins, marked differences in evolutionary rates were observed between the Australian and New Zealand RHDV, which led to conflicting conclusions about population growth rates. An analysis of mutational patterns suggested that evolutionary rates have been elevated in the Australian viruses, at least in part due to the presence of low-fitness (deleterious) variants that have yet to be selectively purged.
R
abbit hemorrhagic disease virus (RHDV;Caliciviridae) is a highly virulent RNA virus that causes an acute and largely fatal hemorrhagic disease in European rabbits (Oryctolagus cuniculus). The first recorded case occurred in the spring of 1984 in Jiangsu province, China, purportedly involving a group of Angoran rabbits imported from Germany (1). The virus then spread to neighboring regions of China, with millions of domestic rab-bits dying by the end of the year (2). By 1989, RHDV outbreaks were reported in domestic rabbit populations in Asia, Europe, and the Americas (3–5). RHDV had a major impact on the commercial rabbit industry, with high mortality rates in rab-bitries and farms during the initial epidemic wave. Despite efforts to contain outbreaks and eradicate the virus from do-mestic populations, RHDV soon became endemic throughout much of Europe, including the Iberian Peninsula. There, Eu-ropean rabbits are an important part of the local ecosystem, serving as stable prey for predators, including the endangered Iberian lynx (6). Hence, the emergence of RHDV was another blow to conservation efforts, as it caused a decline in wildrab-bit populations still recovering from the earlier impact of myx-omatosis (7).
No native species of lagomorph exists in either Australia or New Zealand. However, during the 19th century, colonists intro-duced the European rabbit into both countries as a source of food and sport. The breeding conditions were favorable, and popula-tions thrived with the expansion of pastoral land. Despite some effort to control their spread through fencing, poisoning, and
Received29 April 2015Accepted2 July 2015
Accepted manuscript posted online8 July 2015
CitationEden J-S, Kovaliski J, Duckworth JA, Swain G, Mahar JE, Strive T, Holmes
EC. 2015. Comparative phylodynamics of rabbit hemorrhagic disease virus in Australia and New Zealand. J Virol 89:9548 –9558.doi:10.1128/JVI.01100-15.
Editor:R. M. Sandri-Goldin
Address correspondence to Edward C. Holmes, edward.holmes@sydney.edu.au. Copyright © 2015, American Society for Microbiology. All Rights Reserved. doi:10.1128/JVI.01100-15
on November 7, 2019 by guest
http://jvi.asm.org/
hunting, rabbit populations continued to grow rapidly, with ma-jor plagues recorded throughout the 20th century; the total rabbit populations in Australia were estimated to be in the hundreds of millions (8). Importantly, rabbits are a serious pest in Australia and New Zealand, as they compete for resources with domestic and native species, and their invasion has been associated with the destruction of agricultural land from burrowing and overgrazing (9). More recent efforts to reduce rabbit populations have focused on the use of viruses as biological controls, notably myxoma virus (MYXV), which was released into both countries during the 1950s (10,11). Although MYXV failed to establish in New Zealand, in Australia its initial deployment resulted in the death of an esti-mated 90% of affected wild rabbit populations (12). However, the long-term impact of MYXV was dampened due to a combination of viral attenuation and mounting host resistance (13,14). Con-sequently, additional viruses were sought to control feral rabbit populations, such that the emergence of RHDV was timely.
In 1991, a Czech strain of RHDV, known as CAPM V-351 (GenBank accession numberZ11535), was imported into Austra-lia and initially characterized inside high-containment facilities at the Australian Animal Health Laboratories (AAHL), Geelong, Victoria (9). In 1995, field trials began testing the spread of this RHDV strain in rabbits living in natural warrens on Wardang Island, just off the South Australia coast. Despite all precautions, in October 1995 the virus escaped the island, and the first cases of RHDV were detected on the Australian mainland (15). Following the identification of additional cases hundreds of kilometers from the trial site and evidence that the virus was being disseminated by flies (16), it was realized that the natural spread of the virus could not be contained, and final approval for the use of RHDV as a biocontrol agent against feral rabbits was given in October 1996 (15). In New Zealand, authorities decided against introducing RHDV into the rabbit population, citing uncertainty over RHDV epidemiology, its effectiveness as a biological control, disease out-comes, and inadequacy of management plans (9). However, in August 1997, RHDV-infected rabbits were identified in central Otago on the South Island. Evidence suggested that some source of RHDV351-INOC, a passage of the original CAPM V-351 strain used commercially in Australia, had been illegally imported into New Zealand and released by farmers (17). As in Australia, efforts by authorities to contain the initial outbreaks failed, and the virus spread naturally as well as through further intentional releases by farmers.
The introduction of RHDV into Australia and New Zealand offers a unique opportunity to understand the patterns, processes, and dynamics of viral evolution and spread. Since the founders of the outbreaks in Australia and New Zealand share a origin, i.e., both are derived from a single Czech strain, CAPM V-351, and their time of introduction is known, it is possible to compare the parallel evolution of a single virus in distinct naive populations. Previous work has revealed the rapid spread, genetic diversifica-tion, and exponential growth of RHDV in Australia over the last 2 decades following its release (18). However, this was based on RHDV sampling at a restricted number of localities and without information on the parallel outbreak in New Zealand. Wider sam-pling also may provide insights into one of the most puzzling aspects of RHDV evolution: although there have been more than 3,000 independent releases of the RHDV351-INOC strain since 1995, there is no evidence that these rereleased viruses established long-term transmission. In addition, most studies of RHDV
evo-lution undertaken to date have relied solely on analyses of the VP60 (capsid) gene, with far less known about evolutionary pat-terns and processes at a genomic scale.
Our aim here was to compare the molecular epidemiology and evolution of RHDV in Australia and New Zealand following its release as a biocontrol agent into both countries. In particular, we sought to determine whether and why the patterns and dynamics of genome-scale RDHV evolution differ by geographical locality.
MATERIALS AND METHODS
Specimen collection.All RHDV field isolates characterized here were derived from rabbits found dead during naturally occurring outbreaks of RHD in Australia and New Zealand. The tissue used for the sequencing of Australian RHDV isolates was obtained from livers harvested directly from dead rabbits in the field from five Australian states and territories, including Western Australia (WA), South Australia (SA), New South Wales (NSW), Tasmania (TAS), and the Australian Capital Territory (ACT). For the New Zealand samples, the initial viral material was simi-larly sourced from livers of rabbits found dead in the field following nat-urally occurring outbreaks of RHDV in three regions, including Hawke’s Bay, Otago, and Canterbury. However, the tissue specifically used for sequencing was obtained from the livers of laboratory-infected rabbits inoculated with liver homogenates (a single passage) prepared from these field strains. All experimental procedures used for the passage of virus in rabbits were performed in accordance with the 1999 Animal Welfare Act New Zealand and approved by the Animal Ethics Committee (AEC) of Landcare Research New Zealand, Lincoln (AEC approval number 13/07/02).
Viral RNA extraction, cDNA synthesis, and genome amplification.
For all samples, viral RNA was extracted from approximately 30 mg of liver tissue using a TissueRuptor homogenizer and the RNeasy minikit (Qiagen). Reverse transcription then was performed using the purified viral RNA, oligo(dT) primers, and the SuperScript III first-strand synthe-sis system (Life Technologies). The viral genome was amplified in three overlapping fragments (each approximately 2.9 kb in length) from cDNA using PlatinumTaqDNA polymerase high fidelity (Life Technologies) and the previously published primers listed inTable 1(19). All PCRs were performed per the manufacturer’s instructions, with an annealing tem-perature of 58°C and an extension time of 5 min. The products of the reactions were analyzed by agarose gel electrophoresis, and DNA ampli-cons corresponding to the expected size were excised and purified using the QIAquick gel extraction kit (Qiagen). The DNA concentration of the purified amplicon then was determined using the Quant-iT PicoGreen double-stranded DNA (dsDNA) assay kit (Life Technologies) before di-lution to a final concentration of 0.2 ng/l with UltraPure DNase/RNase-free distilled water (Life Technologies).
DNA library preparation and Illumina sequencing.The three puri-fied and diluted DNA amplicons (PCRs 1, 2, and 3 ofTable 1) were pooled equally to provide complete genome coverage for each RHDV sample. DNA libraries then were prepared from the pooled amplicons (1 ng of total DNA) using the Nextera XT DNA sample preparation kit (Illumina) and confirmed by quantitative PCR (qPCR) using the universal KAPA library quantification kit for Illumina platforms (Kapa Biosystems). Paired-end sequencing then was performed at the Ramaciotti Centre for Genomics (University of New South Wales) using the Illumina MiSeq platform and a 300 cycle MiSeq reagent kit (v2).
Sequence data processing and RHDV genome assembling. Follow-ing sortFollow-ing and adaptor removal, the quality of sequence reads was assessed using FastQC (http://www.bioinformatics.babraham.ac.uk /projects/fastqc/) before regions of low-quality bases were removed using Trimmomatic (20). Here, the terminal regions were first trimmed (15 nucleotides [nt] from the starts and 1 nt from the ends) before a sliding window of 4 nt was applied to the trimmed reads, with an average quality score threshold set to QC32. Overlapping paired-end reads then were merged with FLASH (21), and any reads less than 50 nt in length were
on November 7, 2019 by guest
http://jvi.asm.org/
discarded. Individual cleaned reads then were mapped to a known refer-ence genome to generate a majority consensus sequrefer-ence for each sample using Geneious v7.1.7 (22). In this case, the reference genome used was the initial release strain of RHDV used in Australia, RHDV351-INOC (GenBank accession numberKF594473). In total, 27 new RHDV genome sequences were obtained here, 17 from Australia and 10 from New Zea-land. Additionally, for one Australian strain (AUS/SA/Motpena/2013), the complete set of genome PCRs was not obtained; however, VP60 was successfully sequenced (from PCR 3) and was included in subsequent analyses of this region. All sequences generated in this study are labeled by country/region/strain/collection date.
Evolutionary analysis.To examine the genome-wide evolution of RHDV in Australia and New Zealand, an alignment was made of complete genome sequences using the 27 new genomes generated in this study, as well as seven reference sequences derived from GenBank (total of 34 se-quences; length, 7,347 nt). Of the seven reference sequences, one was from New Zealand and six were from Australia, including the Australian release strain RHDV351-INOC. As most sequence data available on public data-bases were limited to the VP60 region, a second alignment was prepared using complete VP60 sequences of Australia and New Zealand strains (total of 84 sequences; length, 1,737 nt). This included 28 strains from this study and 56 previously sequenced in Australia (n⫽54) and New Zealand (n⫽2). All sequence alignments were generated using MAFFT (23) and then screened for recombination using RDP4 (24). For the recombination analysis, the RDP, GENECONV, Chimaera, MaxChi, BootScan, and SiScan methods were applied. Evidence of recombination was considered likely only if detected by at least two methods.
The evolutionary relationships of the RHDV strains present in Aus-tralia and New Zealand were determined through phylogenetic analyses of the genome and VP60 alignments and inferred using the maximum like-lihood (ML) method available in PhyML (25). For both sequence align-ments, the best-fit model of nucleotide substitution was determined to be GTR⫹I⫹⌫4by JModelTest 2 (26). Tree topologies were explored using a
combination of nearest neighbor interchange (NNI) and subtree pruning and regrafting (SPR) branch swapping, and support for individual nodes was estimated using 1,000 bootstrap replicates. All trees were rooted using the European RHDV strain GER/FRG/1988 (GenBank accession number M67473), which then was removed from the final tree figures.
Since the time of sampling was available for most sequences, we were able to assess the temporal and population dynamics of RHDV in Austra-lia and New Zealand. This analysis was performed using both the com-plete genome (n⫽34) and VP60 (n⫽84) data sets. For most samples, collection dates were known to the day or month. For those samples where only a collection year was known, dates corresponding to the middle of the year were assigned. We first explored the strength of the clock-like signal in the data by linear regression of root-to-tip distances on the ML phylog-eny against time of sampling using the program Path-O-Gen v1.4 (http: //tree.bio.ed.ac.uk/software). Given the apparent temporal structure in
the data, we then made estimates of the rates of evolutionary change (i.e., nucleotide substitutions per site per year) and the time to most recent common ancestor (TMRCA) using the Bayesian Markov chain Monte Carlo (MCMC) method available in BEAST (version 1.8.1) (27). The best-fit model of nucleotide substitution was used (GTR⫹I⫹⌫4) with an
uncorrelated lognormal relaxed molecular clock and three demographic scenarios: constant population size, exponential population growth, and the time-aware Gaussian Markov random field (GMRF) Bayesian skyride coalescent model (28). All remaining priors were uninformative. Since very similar results (i.e., overlapping posterior distributions) were ob-tained for each scenario, the GMRF Bayesian skyride model was used for the final analysis. Two independent chains of 50 million generations were run to ensure convergence and then combined with appropriate burn-in. Statistical uncertainty was reflected in values of the 95% highest probabil-ity densprobabil-ity (HPD). The maximum clade credibilprobabil-ity (MCC) tree was esti-mated from the posterior distribution of trees with node heights scaled to mean values and posterior probabilities showing the statistical support for individual nodes.
We assessed the extent of geographic structure in the VP60 data set using phylogeny-trait association tests of a posterior set of trees (PSTs) as implemented in the BaTS program (29). Here, we used the PSTs previ-ously estimated with BEAST to calculate the parsimony score (PS), asso-ciation index (AI), and monophyletic clade (MC) statistics for different geographic traits to determine if there was more clustering than would be expected by chance alone. Specifically, we explored three hypotheses that RHDV strains clustered (i) by country (Australia and New Zealand), (ii) by Australian state or territory (WA, SA, NSW, TAS, and ACT), or (iii) by broader Australian geographic divisions (western [WA], central [SA], and eastern [NSW, ACT, and TAS] Australia). The expected value of the in-dexes under the nonassociation hypothesis was estimated by 10,000 ran-domized sets.
[image:3.585.39.548.77.204.2]Finally, we sought to determine the nature of selection pressures acting on RHDV using the Datamonkey web server of the HyPhy package (30) (http://www.datamonkey.org/). Accordingly, codon-based ML methods were used to estimate the ratio of nonsynonymous to synonymous sub-stitutions per site (dN/dSratio; also denoted); fixed-effects likelihood (FEL); fast, unconstrained Bayesian approximation (FUBAR); single like-lihood ancestor counting (SLAC); and random effects likelike-lihood (REL). Those sites withPvalues of⬍0.05 or with posterior probability values of ⬎0.95 were considered to provide significant evidence of positive selec-tion. Evidence of adaptive evolution in individual lineages was first as-sessed using the branch site random effects likelihood (BS-REL) method in Hyphy. In addition, we estimated the ML value ofin both the genome and capsid data sets and for the Australian and New Zealand clades indi-vidually using PAML (31). This overall(the one-ratio model) then was compared to separatevalues estimated for the external (e) and internal (i) branches of the Australian and New Zealand clades.
TABLE 1Primers used in this study
PCR round and primer Sequencea(5=-3=) Positionb(nt) Expected size (bp)
1
RHDV-1 GTGAAARTTATGSCGGCTATGTCGCGC 1 2,954
RHDV-6-rev GCCATRGTYGCAAGRTTGACAAGGTGG 2954
2
RHDV-5 RGCHGTTGAAAGYTGGCAAGCCACCAG 1932 2,923
RHDV-10-rev CATCATCGGRGTCATGGCATACACGCC 4854
3
RHDV-11 CACCCCATGACYATACTTGACGCCATG 4630 2,808
RHDV-13-rev TTTTTTATAGCTTACTTTAAACTATAAACC 7437
aDegenerate bases are R (A or G), S (C or G), H (A, C, or T), and Y (C or T). b
Position relative to that of the RHDV Czech strain CAPM V-351 (GenBank accession numberU54983).
on November 7, 2019 by guest
http://jvi.asm.org/
Nucleotide sequence accession numbers.All sequences generated in this study have been submitted to GenBank and assigned accession num-bersKT006721toKT006748.
RESULTS
Genome-wide analysis of RHDV from Australia and New Zea-land.We obtained the complete genome sequences of 27 field isolates of RHDV collected from infected rabbits (17 from Austra-lia, 10 from New Zealand), with a mean coverage depth of 8,773⫻ (range, 572⫻to 19,215⫻). These sequences were combined with data from seven RHDV genomes previously sequenced in Austra-lia and New Zealand, including the inoculum strain RHDV351-INOC. Across the viral genome, genetic variation was relatively homogeneous: the mean nucleotide identity was 95% (range, 90.5 to 97.8%), with the lowest values observed within the nonstruc-tural p16 gene (Fig. 1). Among the 27 newly sequenced genomes, 60 single-nucleotide polymorphisms (SNPs) with a frequency of 5% or higher were identified at 58 distinct positions, of which 15
resulted in nonsynonymous mutations. Overall, most intrahost diversity was observed in the viral capsid gene (VP60) (53.3% of all SNPs [n⫽32/60] and 80.0% of nonsynonymous SNPs [n⫽ 12/15]). Base composition was mostly stable across the genome, with a mean GC content of 50.4%. The exception was a marked decrease in GC content at the 3=end of the genome, correspond-ing to an AT-rich untranslated region (Fig. 1). No significant ev-idence of recombination was detected in any of the sequences analyzed here.
Only one residue, ORF1 codon 2072, which corresponds to amino acid 307 of the VP60 capsid gene, was found to have signif-icant evidence of positive selection using all four codon-based methods, with a normalizeddN⫺dS value of 5.21 (Table 2). ORF1 codons 134 and 142 (p16 gene) and ORF2 codons 102 and 117 (VP10 gene) had evidence of positive selection by two meth-ods with normalizeddN⫺dSvalues between 1.89 and 2.46. Al-though additional putatively selected residues were identified
0 1000 2000 3000 4000 5000 6000 7000 75
80 85 90 95 100
0 20 40 60 80 100
Position (nt)
GC content (%
)
Identity (%)
ORF2 ORF1
Pro p29 2C-like p23
p16 VPg Pol VP60 VP10 AAA
[image:4.585.138.447.68.288.2]FIG 1Genomic genetic variation and base composition in RHDV from Australia and New Zealand. The genome organization of RHDV and the relative position of each gene are shown at the top of the graph. The genetic variation in the RHDV genome was determined by plotting the average nucleotide identity of 100 bases using a sliding window in steps of 5 bases (leftyaxis, colored blue) across the genome (xaxis). Genome base composition also was plotted using a sliding window that calculated the average GC content over 100 bases in steps of 5 bases (rightyaxis, colored red).
TABLE 2Genomic sites with significant evidence of positive selection
Positiona Detection byb:
Genome (nt) ORF (aa) Gene SLAC FEL REL FUBAR
410 134 p16 ⫹ ⫹
434 142 p16 ⫹ ⫹
938 310 p23 ⫹
3011 1001 VPg ⫹
3929 1307 Pol ⫹
6224 2072 VP60 ⫹ ⫹ ⫹ ⫹
7329 102 VP10 ⫹ ⫹
7374 117 VP10 ⫹ ⫹
aAll positions are relative to those of the RHDV Czech strain CAPM V-351 (GenBank accession numberU54983), with the second position of each codon provided. ORF1 and ORF2 are located at nt 10 to 7044 and 7025 to 7378, respectively. aa, amino acid.
bPvalues of⬍0.05 or posterior probability values of⬎0.95 were considered to provide significant evidence of positive selection.
on November 7, 2019 by guest
http://jvi.asm.org/
[image:4.585.40.550.584.696.2]across the RHDV genome, their status is ambiguous, as they were considered significant by only a single method (Table 2).
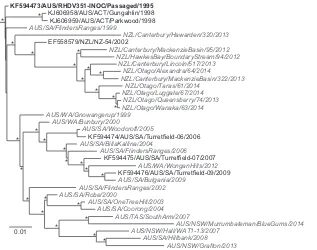
Phylogeographic analysis of RHDV isolates in Australia and New Zealand.The initial phylogenetic analysis using complete genome sequences suggested that RHDV formed distinct lineages in Australia and New Zealand (Fig. 2). To confirm this result, we performed a more detailed evolutionary analysis of the VP60 cap-sid gene because of the larger number of sequences available for comparison. The final data set of complete VP60 sequences con-tained 84 strains sampled in Australia and New Zealand, including the 27 newly sequenced RHDV strains, as well as the sequence of an additional South Australian strain (SA/Motpena/2013) for which we were only able to sequence VP60. Phylogenetic analysis (Fig. 3) revealed an overall tree topology and clustering of strains that was largely congruent with that of the genome-wide phylog-eny (Fig. 2). The Australian inoculum strain RHDV351-INOC, which itself is derived from passaging the imported Czech strain CAPM V-351, occupied a basal position. Interestingly, with the exception of one early isolate from 1997 that resembled RHDV351-INOC, all New Zealand viruses fell into a single mono-phyletic group, suggesting that there was a single importation event into New Zealand that gave rise to all descendant viruses, with no subsequent mixing with Australian viruses (Fig. 3). Within the New Zealand clade, all of the isolates, encompassing those from both the South and the North islands, fell within a single lineage, with the exception of Canterbury/Hawarden/320/ 2013 (South Island), which was phylogenetically distinct. Simi-larly, most Australian viruses fell into a single well-supported monophyletic group. The exceptions were four viruses sampled from 1995 that closely resembled RHDV351-INOC and four
vi-ruses sampled later that were similarly positioned near the root of the tree: ACT/Parkwood/1998, ACT/Gungahlin-HS/1998, ACT/ Gungahlin-RP/1998, and SA/FlindersRanges/1999. The latter vi-ruses most likely represent extinct lineages of the RHDV351-INOC viruses from one of the many early releases of the viruses. Indeed, in the first 3 years (1996 to 1998) following the initial release of RHDV in South Australia in late 1995, there were at least 775 separate releases of the inoculum strain across Australia (18). A more detailed examination of the Australian isolates revealed that all RHDV strains identified in Australia after 2000 formed two major lineages broadly defined by place of sampling and re-ferred to here as the western and eastern lineages, respectively (Fig. 3). Notably, all RHDV isolates identified in Western Australia since 2000 were contained within the western lineage, while RHDV strains from the eastern states of Australia, including NSW, VIC, ACT, and TAS, were present solely in the eastern lin-eage. This phylogeographic clustering of RHDV strains in western and eastern Australian states was found to be significant (P⬍ 0.001) according to phylogeny-trait association tests. In contrast, the RHDV strains from SA, which is located in the southern half of central Australia, were more diverse, with isolates diffuse through-out both Australian lineages with no significant evidence of phy-logeographic clustering (P ⬎0.05). This suggests that RHDV strains from SA act as a source population for the western and eastern regions of Australia.
Lineage-specific evolutionary patterns.Our analysis revealed no individual lineages in the genome-wide RHDV phylogeny sub-ject to adaptive evolution. To determine whether the viral popu-lations in Australia and New Zealand were characterized by dif-ferent selection pressures, we estimated separatevalues (i.e., 0.01
KF594473/AUS/RHDV351-INOC/Passaged/1995
NZL/Canterbury/Hawarden/320/2013
AUS/SA/FlindersRanges/2006 AUS/WA/Gnowangerup/1999
AUS/SA/BillaKallina/2004
AUS/NSW/Hall/WAT1-13/2007 KF594475/AUS/SA/Turretfield-07/2007
NZL/Otago/Alexandra/64/2014
AUS/SA/Coorong/2004 AUS/SA/Robe/2000
KJ606959/AUS/ACT/Parkwood/1998
NZL/Otago/Wanaka/63/2014
AUS/SA/Hillbank/2008 EF558579/NZL/NZ-54/2002
NZL/HawkesBay/BoundaryStream/94/2012 AUS/SA/FlindersRanges/1999
NZL/Canterbury/MackenzieBasin/322/2013
AUS/SA/FlindersRanges/2002
AUS/NSW/Grafton/2013 KF594476/AUS/SA/Turretfield-09/2009 KJ606958/AUS/ACT/Gungahlin/1998
NZL/Otago/Queensberry/74/2013
AUS/SA/Bulgania/2009 AUS/SA/Woodcroft/2005
NZL/Canterbury/MackenzieBasin/95/2012
AUS/TAS/SouthArm/2007 NZL/Canterbury/Lincoln/517/2013
AUS/NSW/Murrumbateman/BlueGums/2014 NZL/Otago/Taras/61/2014
AUS/SA/OneTreeHill/2003 AUS/WA/Bunbury/2000
AUS/WA/WonganHills/2012 KF594474/AUS/SA/Turretfield-06/2006
NZL/Otago/Luggate/67/2014
*
* * * *
* *
* * *
* * * * * * * *
* * *
* *
* *
* *
* *
FIG 2Phylogenetic analysis of RHDV from Australia and New Zealand using complete genome sequences. Of the 34 genomes used in the phylogeny, 27 were newly generated here (colored gray with italicized taxon labels) and 7 were derived from GenBank (black). The original inoculum strain released to Australia RHDV351-INOC is shown with a boldface label. The phylogeny was rooted using an early European RHDV strain (removed from the figure). The scale bar is proportional to the number of nucleotide substitutions per site. Statistical support for individual nodes was estimated from 1,000 bootstrap replicates with an asterisk marking those nodes where the bootstrap support wasⱖ70%.
on November 7, 2019 by guest
http://jvi.asm.org/
[image:5.585.138.455.64.314.2]New Zealand
Australia (Central)
Australia (Western)
Australia (Eastern)
WA SA NSW ACT VIC TAS NT QLD
Original release & Inoculum
0.01 KF494910/AUS/ACT/PARKWOOD/1998 KF494948/AUS/TAS/COLLINS-1/2006 KF494952/AUS/WA/NARRIN/2010 GU373617/AUS/ACT/AINSLE-2/2009 AUS/SA/BillaKallina/2004 KF494947/AUS/SA/WILLOCHRACRK/1995 EF558579/NZL/NZ-54/2002 KF594474/AUS/SA/Turretfield-06/2006 EU650680/AUS/NSW/NARRAWA/2006 KF494909/AUS/ACT/MTP-2/2010 KF494918/AUS/NSW/WOODSTK/2011 KF494923/AUS/SA/BULG/2009 KF494907/AUS/ACT/GUN-HS/1998 NZL/Canterbury/Hawarden/320/2013 AUS/SA/FlindersRanges/2006 KF594473/AUS/RHDV351-INOC/Passaged/1995 NZL/Otago/Alexandra/64/2014 KF594475/AUS/SA/Turretfield-07/2007 KF594476/AUS/SA/Turretfield-09/2009 AUS/NSW/Murrumbateman/BlueGums/2014 AUS/NSW/Hall/WAT1-13/2007 KF494922/AUS/SA/BARM/2008 AUS/WA/WonganHills/2012 AUS/SA/Hillbank/2008 KF494944/AUS/SA/TF-PT1743/2008 NZL/Canterbury/MackenzieBasin/322/2013 NZL/Otago/Wanaka/63/2014 KF494913/AUS/NSW/OC-M8/2007 KF494946/AUS/SA/WILKA/2010 KF494929/AUS/SA/MERNMORA/1995 KF494915/AUS/NSW/ROCKF-2/2011 AUS/SA/Woodcroft/2005 KF494920/AUS/NSW/VITTO/2011 KF494930/AUS/SA/ORR-1/2010 AUS/NSW/Grafton/2013 NZL/HawkesBay/BoundaryStream/94/2012 KF494940/AUS/SA/TF-2863/2011 GU373618/AUS/ACT/PI-1/2009 AUS/SA/FlindersRanges/2002 KF494937/AUS/SA/TF-19/2006 NZL/Otago/Taras/61/2014 KF494925/AUS/SA/ECH/2008 AUS/WA/Gnowangerup/1999 KF494935/AUS/SA/TF-07/1999 AUS/SA/Coorong/2004 KF494919/AUS/NSW/YOUNG/2011 NZL/Canterbury/Lincoln/517/2013 KF494941/AUS/SA/TF-PT1339/2011 AF231353/NZL/NZ-97/1997 NZL/Canterbury/MackenzieBasin/95/2012 AUS/SA/Robe/2000 KF494936/AUS/SA/TF-13/1999 KF494931/AUS/SA/PLUM-1/2010 KF494938/AUS/SA/TF-1907/2006 EU650679/AUS/NSW/NYNGAN/2005 KF494943/AUS/SA/TF-PT1731/2008 KF494945/AUS/SA/TF-PT1839/2009 KF494951/AUS/WA/MARCHA/2010 KF494933/AUS/SA/RENMARK/2011 KF494906/AUS/ACT/GUN-01/2009 KF494916/AUS/NSW/ROCKL-1/2011 KF494950/AUS/WA/MANMAN/2010 AUS/SA/Motpena/2013 AUS/SA/FlindersRanges/1999 AUS/WA/Bunbury/2000 KF494934/AUS/SA/ROXDWNS/2011 AUS/TAS/SouthArm/2007 KF494908/AUS/ACT/GUN-RP/1998 KF494942/AUS/SA/TF-PT1350/2011 KF494926/AUS/SA/FRNP-ORA/2008 KF494924/AUS/SA/CURNAMONA/1995 KF494939/AUS/SA/TF-2186/2008 NZL/Otago/Queensberry/74/2013 KF494914/AUS/NSW/ROCKF-1/2011 KF494928/AUS/SA/LOB-OLIVER08/2003 KF494927/AUS/SA/GRNW/2008 KF494949/AUS/TAS/STHARM/2007 KF494932/AUS/SA/PLUM/1995 AUS/SA/Bulgania/2009 AUS/SA/OneTreeHill/2003 KF494912/AUS/NSW/OC-M2/2007 KF494911/AUS/ACT/WESTCRK/2011 KF494917/AUS/NSW/ROCKL-2/2011 NZL/Otago/Luggate/67/2014 * * * * * * * * * * * * * * * * * * * * * * * * * * * * * * * * * * * * * * * * * * * * * * * * * * * * * * * * New Zealand Australia (Western) Australia (Eastern)
FIG 3Phylogenetic analysis of RHDV from Australia and New Zealand using VP60 gene sequences. The taxon labels of Australian and New Zealand strains are colored according to the key provided in the map, except for the original inoculum strain released into Australia RHDV351-INOC, which is shown with a boldface label. The phylogeny was rooted using an early European RHDV strain (removed from the figure). The scale bar is proportional to the number of nucleotide substitutions per site. Statistical support for individual nodes was estimated from 1,000 bootstrap replicates, with an asterisk marking those nodes where the bootstrap support wasⱖ70%.
on November 7, 2019 by guest
http://jvi.asm.org/
[image:6.585.45.536.62.647.2]dN/dSratios) for (i) the major Australian and New Zealand clades and (ii) external and internal lineages of the phylogeny. The over-allvalues for the Australian and New Zealand lineages in the genome phylogeny were very similar, at 0.056 and 0.052, respec-tively. However, in the VP60 phylogeny,was significantly higher in Australia ( ⫽0.099) than New Zealand ( ⫽0.054) (P⬍ 0.05). Importantly, this elevation inwas associated with an ex-cess of recent nonsynonymous mutations, manifest as an increase indN/dSon external branches of the phylogeny (i.e.,e⬎ ), and this effect was stronger in Australia (e⫽0.123) than in New Zealand (e⫽0.072). Hence, these data suggest that the VP60 gene contains transient deleterious mutations that have yet to be purged by purifying selection, and that this effect is stronger in Australia.
Temporal analysis of RHDV isolates in Australia and New Zealand.The VP60 phylogeny of Australian and New Zealand RHDV isolates demonstrated strong temporal signal, indicative of clock-like evolution. In particular, simple linear regression re-vealed a strong correlation between root-to-tip genetic distance against time of sampling in both countries, with correlation coef-ficients of 0.92 and 0.93, respectively (Fig. 4). Strikingly, however, this analysis also revealed significantly different evolutionary rates in Australia and New Zealand (P⫽0.0058), at 4.1⫻10⫺3⫾2.1⫻ 10⫺4and 2.6⫻10⫺3⫾3.3⫻10⫺4nucleotide substitutions per site per year (subs/site/year) for Australia and New Zealand, re-spectively.
We assessed these apparent differences in evolutionary dynam-ics more rigorously using a Bayesian MCMC approach. Accord-ingly, VP60 sequences in Australia and New Zealand combined exhibited a mean rate of evolution of 4.2⫻10⫺3(95% HPD, 3.6⫻ 10⫺3to 4.9⫻10⫺3) subs/site/year, although with marked rate heterogeneity according to the coefficient of variation (mean, 0.57; 95% HPD, 0.42 to 0.71). Indeed, rate estimates for country-specific groups revealed that the evolutionary rate for Australian RHDV was almost twice that for New Zealand viruses, at 4.8⫻
10⫺3subs/site/year and 2.6 ⫻10⫺3subs/site/year for Australia and New Zealand, respectively, in agreement with the linear re-gression analysis. The TMRCA for Australian and New Zealand was placed at around 1995 (95% HPD, 1994.8 to 1995.5), com-patible with the known release date of the RHDV351-INOC strain.
We applied a similar approach to estimate the evolutionary rates in the complete genome data set (n⫽34) and various parti-tions of this alignment comprising the complete ORF1, the non-structural region of ORF1, and VP60. In all instances, these smaller data sets resulted in lower rates than those of the more-well sampled VP60 data (n⫽84), with minimal overlap (Fig. 5A). For example, in VP60, the 95% HPDs were 2.8⫻10⫺3to 3.8⫻ 10⫺3subs/site/year for the smaller data set (n⫽34) and 3.6⫻ 10⫺3to 4.9⫻10⫺3subs/site/year for the larger data set (n⫽84). Although the estimated TMRCA for the larger VP60 data set (⬃1995) is more compatible with the known date of introduction of RHDV into Australia than the genome-scale analyses (⬃1994) (Fig. 5B), this may reflect a smaller sample size and some uncer-tainty in sampling dates in the latter. In addition, it is likely that the VP60 rate is artificially high because of an excess of transient deleterious polymorphisms in the recently sampled Australian vi-ruses that make up a larger proportion of this data set (described above).
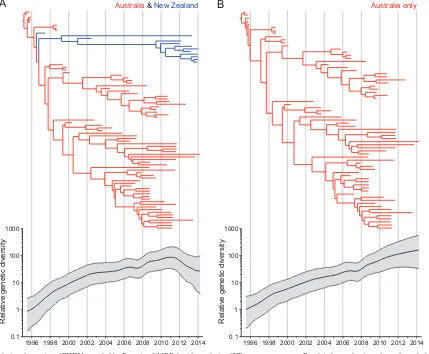
Population dynamics of RHDV in Australia and New Zea-land.Our Bayesian skyride analysis of the larger VP60 gene se-quence data set revealed that RHDV diversity in these countries grew exponentially from 1995 to 2012, after which there was a drop in relative genetic diversity, compatible with a reduced rate of population growth (Fig. 6A). However, since most of the sam-ples collected after 2012 were from New Zealand, it is possible that the New Zealand sequences were the primary reason for the drop in genetic diversity. Therefore, we repeated the analysis on the Australian sequences alone. In this case, the overall rate of evolu-tion increased slightly to 4.5⫻10⫺3(95% HPD, 3.8⫻10⫺3to 5.3⫻10⫺3) subs/site/year, with a similar TMRCA (95% HPD, 1994.6 to 1995.5). More notably, the Bayesian skyride analysis showed that the diversity of Australian RHDV strains had grown exponentially since the initial release in 1995, with no drop in relative genetic diversity toward the present (Fig. 6B). Hence, in-clusion of the spatially distinct and more slowly evolving strains from New Zealand in the overall phylodynamic analysis has re-sulted in a likely erroneous pattern of declining genetic diversity. No separate analysis of RHDV in New Zealand was performed due to the lack of sampling of early RHDV isolates.
DISCUSSION
A better understanding of the evolutionary processes that shape the emergence and spread of viral diseases is central to the devel-opment and implementation of effective strategies for their con-trol. Molecular epidemiological studies have been highly effective in retrospectively describing the prevalence, evolutionary history, and patterns of spread in time and space of pathogens. However, the exact origins of viruses are rarely known. In this context, the introduction of RHDV and MYXV as biological controls for feral rabbit populations in Australia and New Zealand are unusual, as both the founder viruses and their exact time of introduction are known, and they represent important case studies in viral emer-gence in naive host populations (32).
In Australia, both RHDV and MYXV have been repeatedly
0 2x10⁻²
4x10⁻²
6x10⁻²
8x10⁻²
1x10⁻¹
Root-to-Tip Divergenc
e
1990 1995 2000 2005 2010 2015
Time Australia
New Zealand
Australia New Zealand
Best-fit values Slope (rate) X-intercept (TMRCA) Correlation coefficient
4.1x10⁻³ ± 2.1x10⁻⁴
1995.49 1996.04
0.92 0.93
2.6x10⁻³ ± 3.3x10⁻⁴
FIG 4Temporal structure in the RHDV VP60 gene partitioned by geographic location. The root-to-tip genetic distances from the VP60 ML phylogeny were plotted against sampling time, and a linear regression was performed to com-pare the clock-like structure of Australian (red) and New Zealand (blue) RHDV strains.
on November 7, 2019 by guest
http://jvi.asm.org/
[image:7.585.42.287.66.270.2]released into the environment as a biocontrol agent for feral Eu-ropean rabbit populations. Strikingly, however, in neither case has there been any evidence for the sustained spread of these rer-eleased viruses (18). Indeed, despite our increased sampling, we found no evidence of viral lineages arising from rereleases, with RHDV characterized by simple ongoing evolution from a single founding strain. There are two possible explanations for such a pattern. First, because the rereleases of RHDV often took place in smaller and less dense rabbit populations, it is possible that their extinction was simply a chance occurrence. Alternatively, their extinction could be selectively mediated, possibly driven by herd
immunity against the original inoculum strain that is dampening the spread of RHDV351-INOC-like viruses, along with rising lev-els of host resistance (19, 33). In a recent experimental study, RHDV351-INOC replicated slower to lower titers, and killed fewer rabbits with overall prolonged survival times, than recently sampled field strains (19). The dead rabbit has been suggested as a source of virus transmission, both by direct contact and, more importantly, via mechanical transmission through flies feeding on carcasses (16,18,37). In addition, virus infectivity in carcasses is likely to be highest in rabbits that died within 3 days postinfection, before the onset of adaptive immune responses (19). Therefore, a
0.002 0.003 0.004 0.005 0.006
0
500
1000
1500
2000
2500
3000
Rate of evolution (subs/site/year)
Densit
y
Complete genome
Non-structural region Complete ORF1
VP60
VP60
Genome dataset (n=34)
Capsid dataset (n=84)
1996 1995 1994 1993 1992 1991
0
0
.5
1.
0
1
.5
2.0
2
.5
Density
Year
Complete genome
Non-structural region Complete ORF1
VP60
VP60
Genome dataset (n=34)
Capsid dataset (n=84)
October 1995: RHDV introduced onto the Australian mainland
A
B
FIG 5Estimates of evolutionary rates and TMRCAs in RHDV. A Bayesian MCMC approach was used to estimate the rates of evolution (subs/site/year) in two RHDV data sets (shown in panel A), one of complete genome sequences (n⫽34) and another of complete VP60 genes (n⫽84), all from Australia and New Zealand. The complete genome set also was partitioned into various regions, including complete ORF1, the nonstructural region of ORF1, and VP60. The overall TMRCA estimates for each data set also are shown in panel B. All data sets are colored according to the legend provided. Theyaxis for each panel corresponds to the density from the binned kernel density estimates of the posterior distributions.
on November 7, 2019 by guest
http://jvi.asm.org/
[image:8.585.135.452.72.528.2]lower-virulence strain like RHDV351-INOC would be at a disad-vantage for sustained virus transmission and would be outcom-peted by better-adapted field strains that have coevolved with wild rabbits in Australia.
It is also possible that local interactions with the endemic non-pathogenic Australian calicivirus RCV-A1 (34) have shaped RHDV evolution. Infection with this benign relative of RHDV can provide partial and transient cross protection against RHDV in-fection by reducing the severity of RHD, leading to increased sur-vival rates (35). The distribution of RCV-A1 is limited to the more temperate and wetter climate zones of southeastern Australia (36). Notably, all recent RHDV isolates from the southeastern states cluster in the same lineage (Fig. 3), such that additional investiga-tions are warranted to assess whether there is local RCV-A1-me-diated selection.
Our VP60 phylogeny also was notable in that we observed an important spatial differentiation among Australian RHDV that resulted in phylogeographic clustering into two distinct lineages, those from Western Australia and those from the eastern states. Strikingly, the RHDV strains from the state of South Australia, located in the central part of the country, had the greatest diversity and were diffuse throughout both lineages. Importantly, this was
the region where RHDV was first released into Australian rabbit populations, such that it represents the geographic source popu-lation for the invasion and spread of the virus across the country. Much of the environment in central Australia is comprised of arid and semiarid land with more continuous populations of rabbits (37). Furthermore, the blowfly and bush fly, which are vectors for RHDV transmission (36), similarly maintain more continuous populations in these arid regions. Together, these factors would promote greater viral genetic mixing, in turn increasing viral di-versity in South Australia (37).
Our phylogenetic analysis similarly revealed a major biogeo-graphic division between viruses sampled in Australia and New Zealand. As the New Zealand founder virus was purportedly sourced from the Australian inoculum strain RHDV351-INOC or a closely related virus, the phylogeny agrees with suggestions that the original releases in both countries essentially share a source (37). Although it is unclear exactly which stock of RHDV351-INOC was imported into New Zealand, there is no evidence for the mixing of viruses between localities since this time. Despite this independent evolution, it is surprising that there was a marked difference in evolutionary rates between the Australian and New Zealand lineages (Fig. 4). Although the New Zealand
Relative genetic diversity
1000
100
10
1
0.1
1000
100
10
1
0.1
Relative genetic diversity
1996 1998 2000 2002 2004 2006 2008 2010 2012 2014 1996 1998 2000 2002 2004 2006 2008 2010 2012 2014
Australia& New Zealand Australia only
A
B
FIG 6Population dynamics of RHDV revealed by Bayesian GMRF skyride analysis of VP60 gene sequences. Panel A shows the time-dependent phylogeny and relative genetic diversity through time when the Australian and New Zealand data are analyzed together, and panel B shows the results for Australia only. Relative genetic diversity is shown on theyaxis, with time (in years) shown on thexaxis.
on November 7, 2019 by guest
http://jvi.asm.org/
[image:9.585.77.506.69.423.2]estimate may be adversely affected by limited sampling, it is strik-ing that the Australian VP60 sequences were characterized by an elevateddN/dSon external branches of the phylogeny (e). This pattern is indicative of transient deleterious (nonsynonymous) polymorphisms that have yet to be removed by purifying selection and that tend to elevate estimates of substitution rates toward the present. Indeed, the differing impact of purifying selection is a key reason why RNA viruses exhibit strong time-dependent biases in rate estimates (38). Such an excess in nonsynonymous polymor-phisms (as opposed to fixed differences on internal branches) also argues that the increased evolutionary rate in Australian RHDV was not due to selectively mediated differences, such as immuno-logical landscapes or competition among cocirculating viral lin-eages, or to heterogeneity in the original stocks of RHDV351-INOC.
Similar to previous studies (18), we found evidence of positive selection in the viral capsid at codon 307 (ORF1 codon 2072). Although the function of this residue has yet to be determined, it is located within a protruding loop on the external surface of the viral capsid adjacent to sites critical for antigenicity and receptor binding (39). Hence, it may function as a determinant of trans-missibility and/or virulence. ORF1 codons 134 and 142 (p16 gene) and ORF2 codons 102 and 117 (VP10 gene) also were found to have evidence of positive selection, although it was weaker. P16 has been proposed as a virulence determinant in RHDV, with the accumulation of amino acid substitutions in field isolates with higher virulence than that of the Czech strain (19). However, as the function of VP10 has yet to be determined, the consequence of adaptation in this gene is unknown.
This and previous work have demonstrated a continual expo-nential growth in genetic diversity since the virus was first released (18), compatible with an increasing population size. As such, it is possible that the apparent dip in the Bayesian skyride caused by the New Zealand strains means that the transmission of RHDV in New Zealand is less efficient than that in Australia. Recent studies from South Australia show that the virus does not persist on site between outbreaks. Rather, it is likely that RHDV-carrying flies from further afield initiate each new outbreak (18), and that RHDV maintains itself in the Australian landscape by transmit-ting between rabbit subpopulations that are highly interconnected by vectors (37). In contrast, fly vector abundance is lower in New Zealand, such that fly transmission of RHDV may be less frequent, with fecal-oral transmission being more important. It is theoreti-cally possible, although unproven, that fly transmission will lead to greater transmission bottlenecks than fecal-oral transmission, which may in turn impact evolutionary dynamics. There is also some evidence that RHDV transmission increases in arid condi-tions due to more continuous populacondi-tions of host and vector spe-cies (40), which is more common in parts of Australia (such as South Australia) than New Zealand. Finally, different levels of resistance in local rabbit populations also may contribute to the apparently different population dynamics between Australia and New Zealand.
Regardless of the true cause, this analysis highlights the dangers in inferring population dynamics when there is strong spatial sub-division in the data, which has led to the erroneous inference of a recent decline in genetic diversity. Our analysis clearly shows that sample composition has a significant impact on estimates of evo-lutionary rate, with an elevated rate in Australian RHDV seem-ingly associated with the presence of transient deleterious
muta-tions, which is compatible with the notion that evolutionary rates in RNA viruses have a strong time dependency (38). Hence, care must be exercised to ensure that all evolutionary conclusions drawn from sequence comparisons have not been adversely af-fected by sample composition. Indeed, it will be important to determine whether estimates of relative genetic diversity and in-ferences of population dynamics are adversely affected by time-dependent evolutionary rates.
ACKNOWLEDGMENTS
This work was support by grant DP140103362 from the Australian Re-search Council, grant R01 AI093804-01A1 from the National Institutes of Health, and grant 12/055 from the New Zealand Ministry of Primary Industry’s Sustainable Farming Fund. E.C.H. is supported by an NHMRC Australia Fellowship (AF30). J.S.E. is supported by an NHMRC Early Career Fellowship (1073466).
REFERENCES
1.Liu SJ, Xue HP, Pu BQ, Qian NH.1984. A new viral disease in rabbits. Anim Husband Vet Med16:253–255.
2.Xu ZJ, Chen WX.1989. Viral haemorrhagic disease in rabbits: a review. Vet Res Commun13:205–212.http://dx.doi.org/10.1007/BF00142046. 3.Cancellotti FM, Renzi M.1991. Epidemiology and current situation of
viral haemorrhagic disease of rabbits and the European brown hare syn-drome in Italy. Rev Sci Tech10:409 – 422.
4.Gregg DA, House C. 1989. Necrotic hepatitis of rabbits in Mexico: a parvovirus. Vet Rec125:603– 604.
5.Park NY, Chong CJ, Kim JH, Cho SM, Cha YH, Jung BT, Kim DS, Yoon JB.1987. An outbreak of viral haemorrhagic pneumonia (tentative name) of rabbits in Korea. J Korean Vet Med Assoc23:603– 610. 6.Angulo E, Cooke B.2002. First synthesize new viruses then regulate their
release? The case of the wild rabbit. Mol Ecol11:2703–2709.
7.Villafuerte R, Calvete C, Blanco JC, Lucientes J.1995. Incidence of viral hemorrhagic disease in wild rabbit populations in Spain. Mammalia59: 651– 659.
8.Rolls EC.1969. They all ran wild: the story of pests on the land in Austra-lia. Angus and Robertson, Sydney, AustraAustra-lia.
9.Cooke BD.2012. Rabbits: manageable environmental pests or partici-pants in new Australian ecosystems? Wildl Res39:279 –289.
10. Ratcliffe FN, Myers K, Fennessy BV, Calaby JH.1952. Myxomatosis in Australia; a step towards the biological control of the rabbit. Nature170: 7–11.http://dx.doi.org/10.1038/170007a0.
11. Gumbrell RC.1986. Myxomatosis and rabbit control in New Zealand. N Z Vet J34:54 –55.http://dx.doi.org/10.1080/00480169.1986.35282. 12. Fenner F, Fantini B.1999. Biological control of vertebrate pests: the
history of myxomatosis, an experiment in evolution. CABI Publishing, Wallingford, Oxon, United Kingdom.
13. Marshall ID, Fenner F.1960. Studies in the epidemiology of infectious myxomatosis of rabbits. VII. The virulence of strains of myxoma virus recovered from Australian wild rabbits between 1951 and 1959. J Hyg 58:485– 488.
14. Marshall ID, Fenner F.1958. Studies in the epidemiology of infectious myxomatosis of rabbits. VChanges in the innate resistance of Australian wild rabbits exposed to myxomatosis. J Hyg56:288 –302.
15. Kovaliski J.1998. Monitoring the spread of rabbit hemorrhagic disease virus as a new biological agent for control of wild European rabbits in Australia. J Wildl Dis34:421– 428.http://dx.doi.org/10.7589/0090-3558 -34.3.421.
16. Asgari S, Hardy JRE, Sinclair RG, Cooke BD.1998. Field evidence for mechanical transmission of rabbit haemorrhagic disease virus (RHDV) by flies (Diptera: Calliphoridae) among wild rabbits in Australia. Virus Res 54:123–132.http://dx.doi.org/10.1016/S0168-1702(98)00017-3. 17. O’Hara P.2006. The illegal introduction of rabbit haemorrhagic disease
virus in New Zealand. Rev Sci Tech25:119 –123.
18. Kovaliski J, Sinclair R, Mutze G, Peacock D, Strive T, Abrantes J, Esteves PJ, Holmes EC.2014. Molecular epidemiology of rabbit haem-orrhagic disease virus in Australia: when one became many. Mol Ecol 23:408 – 420.http://dx.doi.org/10.1111/mec.12596.
19. Elsworth P, Cooke BD, Kovaliski J, Sinclair R, Holmes EC, Strive T. 2014. Increased virulence of rabbit haemorrhagic disease virus associated
on November 7, 2019 by guest
http://jvi.asm.org/
with genetic resistance in wild Australian rabbits (Oryctolagus cuniculus). Virology464-465:415– 423.
20. Bolger AM, Lohse M, Usadel B.2014. Trimmomatic: a flexible trimmer for Illumina sequence data. Bioinformatics30:2114 –2120.http://dx.doi .org/10.1093/bioinformatics/btu170.
21. Magoc T, Salzberg SL.2011. FLASH: fast length adjustment of short reads to improve genome assemblies. Bioinformatics27:2957–2963.http://dx .doi.org/10.1093/bioinformatics/btr507.
22. Kearse M, Moir R, Wilson A, Stones-Havas S, Cheung M, Sturrock S, Buxton S, Cooper A, Markowitz S, Duran C, Thierer T, Ashton B, Meintjes P, Drummond A. 2012. Geneious Basic: an integrated and extendable desktop software platform for the organization and analysis of sequence data. Bioinformatics28:1647–1649.http://dx.doi.org/10.1093 /bioinformatics/bts199.
23. Katoh K, Misawa K, Kuma K, Miyata T.2002. MAFFT: a novel method for rapid multiple sequence alignment based on fast Fourier transform. Nucleic Acids Res30:3059 –3066.http://dx.doi.org/10.1093/nar/gkf436. 24. Martin DP, Lemey P, Lott M, Moulton V, Posada D, Lefeuvre P.2010.
RDP3: a flexible and fast computer program for analyzing recombination. Bioinformatics26:2462–2463. http://dx.doi.org/10.1093/bioinformatics /btq467.
25. Guindon S, Dufayard JF, Lefort V, Anisimova M, Hordijk W, Gascuel O.2010. New algorithms and methods to estimate maximum-likelihood phylogenies: assessing the performance of PhyML 3.0. Syst Biol59:307– 321.http://dx.doi.org/10.1093/sysbio/syq010.
26. Darriba D, Taboada GL, Doallo R, Posada D.2012. jModelTest 2: more models, new heuristics and parallel computing. Nat Methods9:772.http: //dx.doi.org/10.1038/nmeth.2109.
27. Drummond AJ, Rambaut A.2007. BEAST: Bayesian evolutionary anal-ysis by sampling trees. BMC Evol Biol7:214.http://dx.doi.org/10.1186 /1471-2148-7-214.
28. Minin VN, Bloomquist EW, Suchard MA. 2008. Smooth skyride through a rough skyline: Bayesian coalescent-based inference of popula-tion dynamics. Mol Biol Evol25:1459 –1471.http://dx.doi.org/10.1093 /molbev/msn090.
29. Parker J, Rambaut A, Pybus OG.2008. Correlating viral phenotypes with phylogeny: accounting for phylogenetic uncertainty. Infect Genet Evol 8:239 –246.http://dx.doi.org/10.1016/j.meegid.2007.08.001.
30. Pond SL, Frost SD.2005. Datamonkey: rapid detection of selective
pres-sure on individual sites of codon alignments. Bioinformatics21:2531– 2533.http://dx.doi.org/10.1093/bioinformatics/bti320.
31. Yang Z.2007. PAML 4: phylogenetic analysis by maximum likelihood. Mol Biol Evol24:1586 –1591.http://dx.doi.org/10.1093/molbev/msm088. 32. Di Giallonardo F, Holmes EC.2015. Viral biocontrol: grand experiments in disease emergence and evolution. Trends Microbiol23:83–90.http://dx .doi.org/10.1016/j.tim.2014.10.004.
33. Elsworth PG, Kovaliski J, Cooke BD.2012. Rabbit haemorrhagic disease: are Australian rabbits (Oryctolagus cuniculus) evolving resistance to in-fection with Czech CAPM 351 RHDV? Epidemiol Infect140:1972–1981. http://dx.doi.org/10.1017/S0950268811002743.
34. Strive T, Wright JD, Robinson AJ.2009. Identification and partial char-acterisation of a new Lagovirus in Australian wild rabbits. Virology384: 97–105.http://dx.doi.org/10.1016/j.virol.2008.11.004.
35. Strive T, Elsworth P, Liu J, Wright JD, Kovaliski J, Capucci L.2013. The non-pathogenic Australian rabbit calicivirus RCV-A1 provides temporal and partial cross protection to lethal rabbit haemorrhagic disease virus infection which is not dependent on antibody titres. Vet Res44:51.http: //dx.doi.org/10.1186/1297-9716-44-51.
36. Liu J, Fordham DA, Cooke BD, Cox T, Mutze G, Strive T. 2014. Distribution and prevalence of the Australian non-pathogenic rabbit cali-civirus is correlated with rainfall and temperature. PLoS One9:e113976. http://dx.doi.org/10.1371/journal.pone.0113976.
37. Schwensow NI, Cooke B, Kovaliski J, Sinclair R, Peacock D, Fickel J, Sommer S.2014. Rabbit haemorrhagic disease: virus persistence and ad-aptation in Australia. Evol Appl7:1056 –1067.http://dx.doi.org/10.1111 /eva.12195.
38. Duchene S, Holmes EC, Ho SY.2014. Analyses of evolutionary dynamics in viruses are hindered by a time-dependent bias in rate estimates. Proc Biol Sci281:20140732.
39. Wang X, Xu F, Liu J, Gao B, Liu Y, Zhai Y, Ma J, Zhang K, Baker TS, Schulten K, Zheng D, Pang H, Sun F.2013. Atomic model of rabbit hemorrhagic disease virus by cryo-electron microscopy and crystallogra-phy. PLoS Pathog 9:e1003132. http://dx.doi.org/10.1371/journal.ppat .1003132.
40. Henzell RP, Cunningham RB, Neave HM.2002. Factors affecting the survival of Australian wild rabbits exposed to rabbit haemorrhagic disease. Wildl Res29:523–542.http://dx.doi.org/10.1071/WR00083.