Regulation of gastrulation through
dynamic patterning
in the Drosophila embryo
Thesis by
Nathanie Alna Trisnadi
In Partial Fulfillment of the Requirements for the degree of
Doctor of Philosophy
CALIFORNIA INSTITUTE OF TECHNOLOGY Pasadena, California
2015
ACKNOWLEDGEMENTS
Many thanks and praises go to my advisor, Angela Stathopoulos. She has been invaluable
in my growth as a scientist. I admire her exuberance and imagination that inspire thought-provoking ideas. It has been a joy to work in her lab, and I appreciate her constant guidance as I navigated my graduate studies. Angela has set a high bar for future mentors!
Special thanks to my committee – David Chan, Scott Fraser, Bruce Hay, and Kai Zinn – for their support, feedback, and time. April 1st has been a wonderful day to schedule
meetings with this brilliant group. No joke.
Thanks to my collaborators for their endless patience and energy throughout the multiple rounds of manuscript editing and Skype conferences: Gregory T. Reeves, Thai V.
Truong, Young-Kyung Bae, Alphan Altinok, Marcos Nahmad, Sophie Katz, and Snehalata Kadam. Likewise, the Zinn lab has been gracious in providing me with Drosophila lines,
especially when I inadvertently killed stocks and would sheepishly request another vial… or two… ok, maybe more than three. I also appreciate everyone at Caltech’s Biological Imaging Center. You all have taught me a lot about microscopes, image analysis, and
sitting in front of a computer inside a cold, dark room.
To my fellow labmates, both past and present, thank you for all your help and
humor that have made my experiments possible and my time at Caltech exceptionally fun. And to my dear friends and family, I am grateful for your love throughout this journey.
ABSTRACT
Gene patterning delineates an embryo into precise domains of differential gene expression.
However, throughout gastrulation, these patterns are spatiotemporally dynamic due to the changing environment inherent in development and the contribution of multiple inputs. We investigated how the spatiotemporal dynamics of gene expressions influence two processes
in the early Drosophila embryo: the establishment of the dorsal-ventral axis and the subsequent mesoderm migration. We found that genes are able to integrate many forms of
regulation over space and time in order to refine their expression boundaries and guide gastrulation. Live imaging of the Dorsal transcription factor morphogen gradient revealed spatiotemporal dynamics that never reached steady state. Computational simulations
correlated these changes with shifts in the boundaries of downstream target genes. For early mesoderm development, we conducted a screen to ectopically express proteins in
specific domains to identify factors involved in migration. We showed that modulation of fibroblast growth factor (FGF) signaling switches between two proteoglycans to transition cells from migration to differentiation. In addition, multiple contributions regulate the
complementary expression of cadherins, which is required to provide the proper balance of cell-cell interactions during mesoderm migration. We conclude that the changing
TABLE OF CONTENTS
Acknowledgements ... iii
Abstract ... iv
Table of Contents ... v
Abbreviations ... vii
Chapter I: Introduction ... 1
Chapter II: Dorsal-ventral gene expression in the Drosophila embryo reflects the dynamics and precision of the Dorsal nuclear gradient ... 20
Abstract ... 21
Introduction ... 22
Results ... 26
Discussion ... 39
Materials and Methods ... 44
Figures and Legends ... 49
Chapter III: Image analysis and empirical modeling of gene and protein expression ... 62
Abstract ... 63
Introduction ... 64
Materials and Methods ... 67
Calculation ... 75
Results ... 83
Discussion ... 87
Figures and Legends ... 91
Chapter IV: The role of FGF signaling in guiding coordinate movement of cell groups: guidance cue and cell adhesion regulator? .... 105
Abstract ... 106
Introduction ... 107
Discussion ... 111
Chapter V: Screen identifies spatiotemporal expression of
proteoglycans Trol and Syndecan is important to support mesoderm
development in the Drosophila embryo ... 126
Abstract ... 127
Introduction ... 128
Results ... 131
Discussion ... 139
Materials and Methods ... 144
Figures and Legends ... 146
Chapter VI: Regulation of cadherins through FGF signaling and Snail in early Drosophila gastrulation ... 156
Abstract ... 157
Introduction ... 158
Results ... 161
Discussion ... 164
Materials and Methods ... 167
Figures and Legends ... 168
Chapter VII: Discussion... 173
Appendices ... 184
A. Supplementary Materials for Chapter II ... 185
B. Supplementary Materials for Chapter III ... 211
C. Supplementary Materials for Chapter V ... 241
ABBREVIATIONS
AP anterior-posterior
CSPG chondroitin sulfate proteoglycan
CVM caudal visceral mesoderm
Dl Dorsal
DV dorsal-ventral
Ecad E-cadherin (Drosophila Shotgun, Shg)
ECM extracellular matrix
EMT epithelial-to-mesenchymal transition FGF fibroblast growth factor
HSPG heparan sulfate proteoglycan
Htl Heartless (FGF receptor)
MBT mid-blastula transition MZT maternal-to-zygotic transition
nc nuclear cycle
Ncad N-cadherin
Pyr Pyramus (FGF ligand)
Sdc Syndecan (HSPG)
Sna Snail
Ths Thisbe (FGF ligand)
Trol Terribly reduced optic lobes (HSPG)
CHAPTER I
Spatiotemporal dynamics of gene expression affect the early Drosophila embryo
There are many different levels of regulation to consider when studying the developing embryo. Gene regulatory networks have mapped out the interactions contributing to gene
expression. However the environment surrounding the cell is constantly changing, and it is in this backdrop that an embryo has to develop. We discuss the spatiotemporal dynamics of
gene expressions, which occur on the timescale of minutes in the early Drosophila embryo, and consider their influence on patterning the embryo.
Initial patterning transpires when successive nuclear divisions terminate molecular
processes, including transcription. Therefore, early gene expressions arise from maternal products. As these nuclear cycles decelerate, zygotic transcription escalates and increases
the number of inputs contributing to spatially divide the embryo for future differentiation.
Temporal constraints in gene patterning
The first three hours of the Drosophila embryonic development are comprised of thirteen division events within fourteen nuclear cycles. This occurs in a syncytium where there are no cellular membranes. The first nine nuclear cycles are sequential rounds of
synthesis and mitosis encompassing roughly eight minutes at 25°C (Lee and Orr-Weaver, 2003). There is no gap phase in these cycles and multiple origins of replication allow a fast
replication time of less than four minutes. At nuclear cycle (nc) 10, DNA synthesis becomes progressively slower as a consequence of fewer replication origins until it reaches 14 minutes at nc 13 (Shermoen et al., 2010). It is also during nuclear cycles 9 and 10 that
spread evenly along the periphery of the embryo (Table 1, Figure 1). The regulation of these nuclear cycles, which in turn impact gene expression, has been extensively studied.
nc Length (min) of Nuclei Number
1 8.6 1 Multiple origins of replication; synthesis finishes in 3.4 minutes.
2 8.6 2
3 8.6 4
4 8.6 8
5 8.6 16
6 8.6 32
7 8.6 64 Earliest reported zygotic transcription.
8 8.6 128
9 8.6 256
10 10.3 512 Synthesis slows down due to less replication origins; mitosis length remains the same. Nuclei complete migration to periphery of embryo.
11 11.4 (750) (estimated number of nuclei based on surface density)
12 14 (1500)
13 19.3 (3000) Maternal-to-zygotic transition (MTZ) begins and continues in nc 14.
14 50* (6000)
*Length of nc 14 taken from synthesis time only. G2 phase is introduced (mid-blastula transition, MBT). The G2 length varies depending on cell type and thus the 14th division begins asynchronously throughout the
embryo. The embryo is cellularized during this time.
Table 1. Timing of nuclear cycles and major events in the early embryo. Nuclear cycles (nc) gets progressively longer as the embryo develops. Data from Foe and Alberts, 1983; Shermoen et al., 2010.
Many previous observations pointed to regulation of the timing of these nuclear cycles by a cyclin oscillator model, since their levels accumulate during interphase, which
[image:10.612.112.534.165.502.2]Figure 1. Summary of events in the Drosophila embryo. Schematic of embryo cross-sections throughout nuclear cycles (nc) 1-14. Nuclear cycles 1-9 are sequential rounds of DNA synthesis (S) and mitosis (M). During nuclear cycles 9 and 10, nuclei (gray circles) migrate to the periphery of the embryo and synthesis gets progressively longer. Throughout nuclear cycles 13 and 14, there is a maternal-to-zygotic transition (MZT) in transcription. A gap phase (G2) is introduced in nc 14, signifying the mid-blastula transition (MBT). During this pause, the embryo is cellularized and gene expressions are refined to their final domains through multiple inputs of transcription factors and signaling pathways (green arrows).
for the next cycle (Edgar et al., 1994; Murray and Kirschner, 1989; O'Farrell, 2001). Cyclins are required for Cyclin-dependent kinases (Cdks) which in turn initiate steps along
the cell cycle. However, a recent study decreasing various cyclins using RNAi did not see a proportional lengthening of interphase as expected in order to reach threshold levels (McCleland et al., 2009). These mutants did have defects during mitosis, suggesting an
indirect role for cyclins. While cyclins may still schedule cell cycles during early development in other animals (Fung and Poon, 2005), it remains unclear what regulates the
consideration when investigating gene patterning in the embryo. Many studies are now including multiple nuclear cycle stages and dividing longer cycles, such as nc 13 and nc 14,
into separate time points (Lott et al., 2011; Reeves et al., 2012). This allows us to detect refinement of gene expression domains, which can occur within a single nuclear cycle.
Mitosis forces transcription factors to disengage from their DNA binding sites,
making it difficult to generate new, complete transcripts during the early cycles. Therefore, the limited time during which transcription can occur is constrained by the length of these
cycles. Drosophila has a reported transcription rate of 1.1-1.4 kilobases (kb) per minute (Shermoen and O'Farrell, 1991; Thummel et al., 1990). The longest gene that could theoretically be transcribed, with a maximum 1.4 kb/min rate and an eight minute nuclear
cycle disregarding mitosis, would be 11,200 base pairs. Many, though not all, of the early zygotically transcribed genes are smaller than 10 kb (Reeves et al., 2012). The earliest
reported gene that is transcribed, Engrailed, is less than 3 kb long and begins at nc 7 (Ali-Murthy et al., 2013). Yet transcripts do not necessarily accumulate over nuclear cycles like cyclins and instead are degraded at each mitosis, as shown for the homeobox gene
ultrabithorax (ubx) (Shermoen and O'Farrell, 1991). Aborted transcripts will not be translated and thus pose the question of what function could longer, incomplete mRNA
fulfill.
It is possible that gene length contributes to its own regulation throughout embryonic patterning. For example, the gap gene knirps is 3 kb long while knirps-related is
23 kb due to numerous introns. In vitro experiments showed that Knirps-related can bind Knirps repressor sites. However only expression of the shorter Knirps-related cDNA, and
Similar experiments with the 21 kb gene short-gastrulation (sog) detected in vivo
expression with probes only against the 5’ region and not the 3’ end of the transcript
(Reeves et al., 2012). Perhaps increasing transcript length through introns is a mechanism to prevent premature function. Conversely, genes with shorter transcripts are ensured to have a functional protein during nuclear cycles as in the case for Snail. snail is less than 2
kb and is a transcription factor with inputs into multiple early genes. Its repressive activity is observed in nc 13 and must be re-established at the beginning of nc 14 (Reeves et al.,
2012). The cooperation between gene length and short nuclear cycles appears to be a general method to regulate gene expression. However, patterning also requires spatial control in addition to the temporal dynamics of nuclear cycles.
Spatial considerations in gene patterning
In nuclear cycles 1-13, the nuclear envelope breaks down during each division and nuclei reach a local equilibrium with the surrounding cytoplasm (DeLotto et al., 2007). This hinders the extent to which transcripts and other factors can be spatially regulated.
Cellularization into roughly 6,000 cells during nc 14 allows a tighter control in the position of expression domains.
The maternal to zygotic transition (MZT) begins in nc 13 and continues throughout nc 14. During this period, there is a sharp degradation of maternal product concurrent with a burst of zygotic transcription. MZT is distinct from the mid-blastula transition (MBT)
when a gap phase, G2, is introduced in nc 14 after synthesis but before the 14th division (Lee and Orr-Weaver, 2003). By this point, nc 14 persists for 50 minutes, allowing the
basement membranes connect neighboring cells (Mazumdar and Mazumdar, 2002). These series of events often occur in parallel and are sometimes not distinguished as separate
processes (Tadros and Lipshitz, 2009) (Figure 1).
There have been many studies on the exact inputs into these transitions. Previous models such as a fixed time after fertilization or counting cell cycles have been negated (Lu
et al., 2009). One prevailing view is the change in nucleocytoplasmic (N/C) ratio, or the concentration of DNA, that prompts MBT/MZT and also perhaps the slowing down of
nuclear cycles 10-13 (Edgar et al., 1986; Lu et al., 2010; Sibon et al., 1997). There are, however, exceptions of genes that do not depend on the N/C ratio and in fact support MBT/MZT (Lu et al., 2009; Sokac and Wieschaus, 2008; Sung et al., 2013). Maternal
genes have a major role in supporting gene patterning and initiating MBT/MZT. With the consecutive nuclear divisions of the syncytium, there is a temporal limit to the extent that
transcription factors can activate gene expression. It is therefore maternal mRNAs that contribute to the robustness of gene patterning in the early embryo. For example, many of the key transcription factors required for establishing the dorsal-ventral and
anterior-posterior axes are deposited maternally (discussed below). These maternal genes are also important to initiate zygotic transcription when the short nuclear cycle intervals no longer
inhibit completion of transcripts. However, expression of maternal products is often ubiquitous, which limits their spatial influence. Hence, the formation of cellular membranes often occurs in conjunction with zygotic transcription, which can be spatially regulated.
Gene patterning initially starts with a few factors, usually maternal, which establish a set of secondary regulators that in turn continue to initiate differential expression (Figure
allow precise spatial domains (Spitz and Furlong, 2012). For example, the transcription factor Zelda is maternal and zygotic, and both contributions are required to support its full
activity as a global activator. In addition to regulating cellularization genes, Zelda is involved in sex determination and axis formation, indicating its broad function (Liang et al., 2008; Liberman and Stathopoulos, 2009). Because Zelda is ubiquitous, it alone cannot
provide spatial information for patterning. Therefore, it follows that additional factors are employed to define domains of gene expression. Analysis of enhancer regions, DNA
sequences that support transcription, reveal binding sites for multiple factors including Zelda (Spitz and Furlong, 2012). Below, we focus on the spatiotemporal dynamics and combinatorial inputs required to establish the dorsal-ventral (DV) axis of the Drosophila
embryo.
Formation of the dorsal-ventral axis
The Dorsal morphogen is a transcription factor pivotal in patterning the DV axis. Classical models of morphogen gradients describe a graded distribution across a field of
cells that, at specific threshold levels, will spatially divide the embryo into different domains of differentiation. Dorsal is maternally provided and forms a gradient such that its
highest concentration is in the ventral-most nucleus while being excluded from dorsal nuclei. It regulates gene expression, traditionally classified into Type I-III Dorsal target genes, in domains along the DV axis (Reeves and Stathopoulos, 2009). The boundaries of
range of action along the DV axis where its concentration is low, and yet cells in these lateral regions of the embryo are still able to read threshold levels.
Advances in imaging technology have allowed us to probe into the spatiotemporal dynamics of Dorsal and how its gradient is established. Using two-photon light-sheet microscopy (2P-SPIM), we found that Dorsal levels never reaches steady state. Over
nuclear cycles 11-14, Dorsal concentrations increase in ventral nuclei while decreasing in dorsal nuclei (see Chapter II for details). Another study reports active shuttling of the
Dorsal protein in and out of the nuclei (DeLotto et al., 2007). Several models are possible to describe this delivery, and further investigation is required to determine the mechanism Dorsal is allocated (see Chapter VII Discussion). Nevertheless, not all morphogen spatial
domains are generated in the same fashion as the Dorsal gradient.
Morphogen gradients can be established by a variety of mechanisms to allow for
flexibility in its own regulation and its regulation of downstream genes. Another well-studied system is the Bicoid (Bcd) morphogen, which patterns the anterior-posterior (AP) axis in Drosophila. In contrast to Drosal, Biocid mRNA is differentially restricted to the
anterior of the embryo where it is locally translated (Little et al., 2011). Moreover, the dynamics of Bicoid are unlike Dorsal: Bicoid was found to reach peak levels as early as nc
10, which did not significantly change throughout subsequent divisions suggesting some form of gradient stability (Figure 2) (Gregor et al., 2007b). However, one study shows that the Bicoid gradient is nonessential during nuclear cycles 11-13 (Lucchetta et al., 2008).
This may be a consequence of cytoplasmic movements during the syncytial divisions that delays readout until nc 14 when the cytoplasm becomes partitioned into cells. Another
of memory (additional examples discussed below). The stability of Bicoid may indicate its lack of requirement in these earlier nuclear cycles since there is no new information to
convey. During nuclear cycles 11-13, Bicoid-dependent patterning could have already initiated cross-repressive interactions between transcription factors. Therefore, AP patterning is not governed by Bicoid itself at this time, but by its target genes. While it is
yet to be determined if the Dorsal gradient is required prior to nc 14, initial analysis implies that its spatiotemporal dynamics contribute to expression of its downstream genes (Reeves
[image:17.612.147.504.364.610.2]et al., 2012; Trisnadi et al., 2013). Other morphogen gradients give rise to patterns through cellular memory.
Evidence suggests that the duration of morphogen signaling can be necessary for proper patterning as well as its concentration (Alexandre et al., 2014; Dessaud et al., 2010).
This has been mathematically predicted through modeling of the patterning network in the
Drosophila wing disc with the Hedgehog ligand and Patched (Ptc) receptor. The network is structured such that Hedgehog signaling increases ptc expression by inhibiting Ptc
repression. Experiments show that the Ptc domain initially overshoots and then later refines its boundary. When the network architecture was altered, Ptc could no longer recede its
expression domain and remained expanded (Nahmad and Stathopoulos, 2009). This memory-like mechanism can act after the gradient has withdrawn and downstream gene domains refine in accordance to a cell’s history of exposure to the morphogen. As the
embryo continues to develop, morphogens may be modified – degraded or transported, for example – before its downstream activity is measured. As previously discussed, short
timescales may require a form of regulation that account for signal propagation even when the immediate output is postponed. In light of the observed dynamics in the Dorsal gradient, we analyzed the expression domains of its target genes over multiple nuclear
cycles and used modeling of the Dorsal network to calculate patterning responses.
Further examination of carefully staged fixed embryos revealed that genes
downstream of Dorsal shift their boundaries, particularly during nuclear cycles 13 and 14. These borders are seen to refine from graded to sharp and domains expand from narrow to broad. Computational simulations correlate these changes with the Dorsal dynamics
observed (see Chapters II and III for details). While gene length can regulate the timing of activity, as previously discussed, this property can also be indirect. For example,
initiation (Bothma et al., 2011). This results in persistent mRNA production of larger transcripts such as sog, since all initiated polymerases will complete transcription. Smaller
transcripts will have fewer initiation events after repression due to its size. This delay in repression predicts graded, not sharp, borders due to the transiency of these longer genes (McHale et al., 2011). Snail was also found to expand its domain as Dorsal levels increase
since, presumably, more cells reach threshold levels to activate its expression (Reeves et al., 2012). The short length of Snail allows refinement within nc 14, highlighting the
changes on minute timescales. In these instances, information regarding transcript size may be integrated into the network design through number of introns and regulatory binding sites in cis-regulatory modules (CRMs). The architecture of this network is also important
to define the spatiotemporal dynamics of downstream gene responses, as shown for Hedgehog patterning. CRMs often receive multiple inputs from a variety of transcription
factors that dictate gene expression. Modeling suggests that the additive layers of control reduce the stochasticity and increase the spatiotemporal specificity of expression domains to result in robust patterning (Gregor et al., 2007a; Reeves et al., 2012).
There have been multiple studies showing combinatorial inputs into genes patterning the DV axis. As previously mentioned, Zelda is a known global activator and
functions with the spatially restricted Dorsal to support specific domains of gene expression (Liberman and Stathopoulos, 2009). In addition, several downstream Dorsal target genes, such as Twist, provide spatial information and are required to work with Dorsal to activate
various gene expressions (Reeves and Stathopoulos, 2009). Repressors also act to refine domains, such as Snail on sog (discussed above). Another example of tiered regulation is
negative inputs from TGF-β signaling and the Capicua repressor as well as to receive positive inputs by Dorsal and EGFR signaling (Garcia and Stathopoulos, 2011). These
levels of regulation allow positional correction over time that results in precise patterning when a single factor may be individually less spatially accurate. Current investigations are aimed at isolating the various contributions into genes of interest.
Many genome-wide chromatin immunoprecipitation (ChIP) studies have allowed us to identify binding of transcription factors to DNA sequences at various time points
(Ozdemir et al., 2011; Sandmann et al., 2007; Zeitlinger et al., 2007). This does not necessarily mean that each binding event detected is functional (i.e., that it produces a transcriptional output). However, even though such enhancer sites should be confirmed,
this has allowed us to realize the multiple regions required for a transcriptional event and the complexity of enhancer mechanisms (Spitz and Furlong, 2012). It has previously been
shown that for many loci, such as the segmentation gene eve, there are multiple enhancers that individually produce discrete expression domains. When combined, these independent enhancers produce the full pattern associated with the gene. This design of multiple,
seemingly autonomous modules also appears to hold true for dorsal-ventral genes, though it was not previously appreciated (Dunipace et al., 2011; Kvon et al., 2014). These expression
domains may abut each other and are not as apparent as with the case of segmentation genes. Enhancers may also appear redundant, but their collective requirement becomes apparent at different stages or during developmental stress such as temperature. Therefore,
careful spatiotemporal analysis to link enhancers with specific patterns is required.
Post-transcriptional regulation is another mechanism of gene patterning. Similar to
spatiotemporally dynamic in some cases (Lecuyer et al., 2007). Early onset of transcription can be visualized by their punctate nuclear localization, and then later
transcripts are usually diffuse throughout the nucleus and cytoplasm. However, for some genes, their mRNA is distributed on the apical side at the end of a nuclear cycle (Reeves et al., 2012). It is unknown if any translation occurs at these sites. mRNAs may also
encounter stabilizing or destabilizing factors that control their post-transcriptional expression. Another mechanism used during development is to remove cells with improper
expression. A targeted cell death mechanism is used to repair the Bicoid gradient in late stage embryos (Tanaka et al., 2014). As more forms of regulation are characterized, it is likely that the spatiotemporal dynamics of gene expression will continue to be significant in
patterning.
Spatiotemporal regulation of signaling pathways
The onset of gastrulation marks the separation of germ layers in the embryo, which has already been differentially patterned into a cell fate map. Cells now start to adopt characteristic physical shapes in addition to producing different signals. These feed back
into gene patterning as development continues.
Combinatorial inputs include signaling pathways that are also spatiotemporally
regulated, and this information is passed on to their target genes. For example, expression of single-minded (sim), which derives the ventral midline of the embryo, is activated by initially broad Notch signaling. However, Notch itself is then carved out by Snail
in a narrow sim domain by the end of nc 14 (Cowden and Levine, 2002). Another case is the expression of zerknullt (zen) in the amnioserosa through Dpp signaling during
cellularization. Dorsal and Zelda together activate zen in a broad dorsal domain during nuclear cycles 11-13 (Liang et al., 2008). However in nc 14, zen expression becomes Dpp-dependent. At the same time, Brinker (Brk) repression extends from the ventral margins
and competes with Dpp for binding sites in zen enhancers (Rushlow et al., 2001). This theme of combinatorial inputs to regulate gene expression continues throughout
development. A blend of the various types of contributions takes effect during mesoderm migration.
Early development of the mesoderm
After cellularization at nc 14 is complete, the presumptive mesoderm undergoes
epithelial-to-mesenchymal transition (EMT). One hallmark of EMT is the downregulation of adhesion molecules E-cadherin (Ecad) and upregulation of N-cadherin (Ncad) (Baum et al., 2008). Dorsal targets Snail and Twist contribute to the repression of Ecad (Oda et al.,
1998) and the activation of Fibroblast growth factor (FGF) receptor Heartless (Htl) (Shishido et al., 1993) in the mesoderm. Preliminary analysis of the network between Ecad,
Snail, and FGF signaling suggests that FGFs may modulate Ecad through inhibition of
snail expression. Subsequent migration of the mesoderm involves specific adhesive properties to balance between motility and association with the collective. Multiple inputs
FGF signaling may also direct mesoderm migration independently of Ecad, though other yet to be identified pathways are thought to be involved as well. Mesoderm
[image:23.612.205.444.362.593.2]migration can be described as a multistep process that includes the EMT and invagination, collapse of the ventral furrow, dorsal spreading, and intercalation to form a monolayer (Figure 3). FGF signaling was found to direct furrow collapse and intercalation, both in the
radial direction (McMahon et al., 2010). In contrast to Htl expression in the mesoderm, the two FGFs (Pyramus and Thisbe) are expressed in the ectodermal substratum (Stathopoulos
et al., 2004). This arrangement of complementary patterns results in the ligand-expressing ectoderm guiding the receptor-expressing mesoderm in a radial movement (see Chapter IV for review).
Despite the successful efforts to express signaling factors at the correct time and place, there are often additional post-translational forms of regulation. Many pathways
work in conjunction with co-factors to influence their function in a spatiotemporal manner. FGF-FGFR complexes interact with heparan sulfate proteoglycans (HSPGs) to support signaling propagation (Lin, 2004). Comparison of two HSPGs, the secreted Terribly
reduced optic lobes (Trol) and the membrane-bound Syndecan (Sdc), revealed expressions that are spatiotemporally dynamic during mesoderm migration. Trol, which is an
extracellular-matrix (ECM) component, is first refined to express in ventral regions of the ectoderm prior to furrow collapse. It appears to facilitate long-range FGF signaling during migration and mediate radial movements at a distance. On the other hand, Sdc is restricted
to the membrane and was found also in ventral regions of the ectoderm but in later stages after lateral spreading is complete. It is required for signaling between neighboring cells as
in intercalation, the final step of migration, and subsequent differentiation in mesoderm development. Their patterns depend on function such that they are differentially expressed to support FGF signaling in cells transitioning from migration to differentiation (see
Chapter V for details).
Setting the stage: considerations during morphogenesis
Understanding the spatiotemporal dynamics of gene patterning becomes more challenging as new inputs are introduced into the system. In the process of forming germ layers, cells come into contact with multiple cells along the way. Depending on the context, cells may
guidance. For example, directional cues by definition are only present in specific patterns in order to provide positional information, like FGF signaling. Other co-factors will
accordingly have restricted domains of expression, as in the case for HSPGs. Protrusions add another layer of complexity as recent studies have shown that membranes containing signaling receptors can extend several cells away to receive signal from non-neighboring
cells (Roy et al., 2014). As cells migrate, this spatial information may need to change at the proper time correspondingly.
The surrounding environment is also important for development. The ECM contains many factors that input into the cell. They range from survival elements to stabilizing ligands for signal diffusion (Kim et al., 2011). Other examples include more
passive roles such as traction for cell mobility or barriers to prevent cell mixing. A migrating population of cells will encounter multiple landscapes that regulate their function
in a spatiotemporal manner.
Mitosis no longer occurs synchronously after nc 14 and instead is driven by the domains delineated from differential gene expression (Foe, 1989). Once a cell divides, it
retains information on its fate and other associated characteristics. Evidence suggests that sister cells in the mesoderm physically attach to each other even after brief periods of being
Gastrulation through spatiotemporally restricted gene expressions
Our interests in understanding how the embryo is patterned must take into account the changing environment inherent in the system and the combinatorial modes of regulation.
Careful staging and measurements of gene boundaries are prevalent in our investigations. The following research quantified the spatiotemporal dynamics in the Dorsal morphogen
gradient and correlated these changes with gene domain refinement through modeling. We also examined factors involved in mesoderm migration and found a role for proteoglycans in supporting FGF signaling during this process. In addition, this study extends the network
between FGFs, Snail, and cadherins in the early mesoderm. Our survey into embryonic patterning highlights the importance of the role that gene expression dynamics has in
CHAPTER II
Dorsal-ventral gene expression in the
Drosophila embryo reflects the
dynamics and precision of the Dorsal nuclear gradient
ABSTRACT
Patterning of the dorsal-ventral axis in the early Drosophila embryo depends on the nuclear distribution of the Dorsal transcription factor. Using live two-photon light-sheet
microscopy, we quantified the nuclear Dorsal gradient in space and time and found that its amplitude and basal levels display oscillations throughout early embryonic development.
These dynamics raise questions regarding how cells can reproducibly establish patterns of gene expression from a rapidly-varying signal. We therefore quantified domains of Dorsal target genes, discovering their expression patterns are also dynamic. Computational
modeling of this system reveals a correlation between Dorsal gradient dynamics and changes in target gene expression and suggests that these dynamics, together with
time-averaging of noise, results in the formation of graded gene expression borders in regions where the gradient is nearly flat. We propose that mRNA levels remain plastic during transient signaling events, allowing tissues to refine patterns in the face of genetic or
INTRODUCTION
In a developing organism, tissues have long been proposed to be patterned by spatially
graded signals that specify cell fate in a concentration-dependent manner. Classically, these “morphogens” have been defined as originating from a defined source and forming a graded distribution by diffusion and degradation; however, in recent years it has become
clear that morphogens can become spatially organized by a variety of mechanisms. Two of the best-characterized morphogen gradients pattern the anterior-posterior (AP) and
dorsal-ventral (DV) axes of the Drosophila early embryo: the Bicoid and Dorsal transcription factor gradients (rev. in Porcher and Dostatni, 2010; Reeves and Stathopoulos, 2009). Their graded distributions are established using very different mechanisms. Bicoid is locally
translated because its mRNA contains a localization sequence; whereas, Dorsal is localized to the nucleus more strongly in the ventral regions of the embryo because of localized
Toll-receptor associated signaling. Live imaging has revealed significant dynamics in the exact levels of Bicoid (e.g., Gregor et al., 2007b; Little et al., 2011); however, the dynamics of target gene expression examined in fixed embryos suggest that the levels of Bicoid are
important, but not the only defining factor in the expression of target genes (e.g., Jaeger et al., 2004; Ochoa-Espinosa et al., 2009). In contrast, no study to date has investigated
systematically temporal features of the Dorsal gradient and its relationship to the expression of its target genes.
The role of Dorsal in the expression of its target genes has been conceptualized as
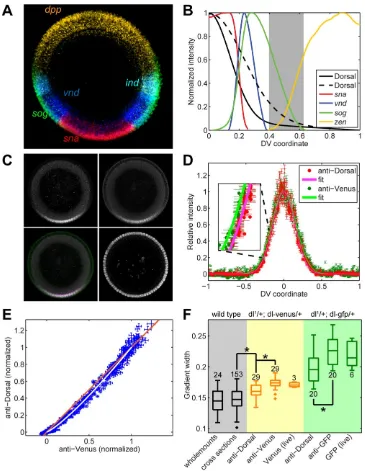
threshold-dependent responsiveness to Dorsal levels (see Figures 1A and 1B; rev. in Reeves and Stathopoulos, 2009; Stathopoulos and Levine, 2005). Type I genes, such as twist (twi) and
snail (sna), are expressed in ventral regions of the embryo in a domain where the levels of nuclear Dorsal are high (up to ~20% DV position; where 0% is the ventral-most position and 100% is the dorsal-most position). Type II genes like ventral nervous system defective
(vnd), are thought to be expressed in ventrolateral domains (dorsal boundaries at roughly 33% DV position) through the combined actions of enhancers that are of intermediate
affinity to Dorsal and that are repressed by the Snail transcription factor in the ventral-most regions. Type III genes are expressed in domains with boundaries past 45% DV position, and can be further subdivided into two categories: those that are activated by Dorsal [Type
III+, such as short-gastrulation (sog)] and those that are repressed by Dorsal [Type III_, such as zerknüllt (zen) and decapentaplegic (dpp)]. Presumably the lowest levels of Dorsal
are sufficient to determine the spatial extent of Type III target genes, but the roles played by other factors remain unclear (e.g., Jiang and Levine, 1993; Liberman and Stathopoulos, 2009).
To study the role of nuclear Dorsal in controlling gene expression, a number of studies have attempted to measure nuclear Dorsal, using either antibody stainings in fixed
tissues (Chung et al., 2011; Liberman et al., 2009; Zinzen et al., 2006) or imaging of Dorsal-GFP in live embryos (DeLotto et al., 2007; Kanodia et al., 2009). Our previous study in fixed embryos showed that the Dorsal gradient was more narrow than often
described, resulting in a relatively flat distribution more than 110 microns from the ventral midline (40% DV position); this raised the question of how Dorsal could specify gene
gradients in live embryos, arguing that the Dorsal concentration could carry positional information up to at least 60% DV position; furthermore, they argued that the Dorsal
nuclear concentration continued to decline all the way to the dorsal midline (compare dotted vs. solid black curves in Figure 1B; Chung et al., 2011; Kanodia et al., 2009). Both sets of studies suggested that the Dorsal nuclear gradient is dynamic, varying in time both
within nuclear cycles and from one nuclear cycle to the next (DeLotto et al., 2007; Kanodia et al., 2009; Liberman et al., 2009).
Previous live studies of Dorsal nuclear concentration and dynamics (DeLotto et al., 2007; Kanodia et al., 2009) employed a Dorsal-GFP fusion that results in a measurably wider gradient than wildtype and also fails to fully complement dorsal null mutants
(Liberman et al., 2009). Furthermore, these studies employed conventional confocal microscopy, in which nuclear motion and limited light penetration both complicated an
accurate measurement of the Dorsal-GFP nuclear gradient in both time and space (DeLotto et al., 2007; Kanodia et al., 2009). Thus, the dynamics of the Dorsal gradient have not yet been satisfactorily measured, nor has it been investigated how these dynamics might impact
domains of gene expression.
In this study, we employed a dorsal-venus fusion transgene and improved
microscopy to address two outstanding questions regarding the Dorsal gradient: first, how does a highly dynamic morphogen signal specify gene expression domains, and second, how does a narrow gradient deliver precise positional information to the entire DV axis?
We find that the Dorsal nuclear gradient varies in both time and space during nuclear cycles (nc) 11-14, and that the expression of Dorsal target genes is often as dynamic as the
Type III genes result from a time-integration of the nearly-flat gradient tail. We used a threshold-based model to show that much of the dynamics and sharpness of Dorsal target
RESULTS
Use of a Dorsal-Venus fusion to monitor Dorsal in living embryos using light-sheet
microscopy
To create a transgene encoding a fully functional Dorsal-Venus fusion protein, we BAC-recombineered 25 kb of genomic DNA surrounding the dorsal locus with sequences
encoding the venus yellow fluorescent protein optimized for Drosophila, inserted in-frame at the C-terminus of the Dorsal protein (Materials and Methods). This dorsal-venus
transgene fully complements null mutations in dorsal when present at one copy, similar to
an unmodified dorsal rescue transgene. In contrast, neither the 25 kB dorsal-gfp construct we constructed nor previous dorsal-gfp cDNA based constructs complement the dorsal
mutant at one copy (Liberman et al., 2009; see Materials and Methods). Live imaging and immunostaining demonstrate that Dorsal-Venus exhibits a distribution more similar to wildtype Dorsal than Dorsal-GFP. We defined a quantitative measure of the width of the
gradient by fitting the data to Equation 1 (see Materials and Methods), resulting in a metric of σ (Liberman et al., 2009). This analysis shows that embryos carrying Dorsal-Venus 25 kB rescue construct have a width of σ = 0.16 +/- 0.01 (standard deviation), which is much
more similar to the width of the wildtype Dorsal gradient (σ = 0.14 +/- 0.01) than that from embryos carrying a 25 kB Dorsal-GFP construct that we made (σ = 0.20 +/- 0.02) (see
To quantitatively measure the levels of Dorsal-Venus in early embryos, we imaged embryos from mothers containing one copy of a dorsal-venus transgene, one copy
of the endogenous dorsal gene, and one copy of an H2A-RFP transgene to label all of the nuclei so they can be unambiguously segmented (Materials and Methods). Using two-photon scanned light-sheet microscopy (2P-SPIM) (Figures 2A and 2B; Truong et al.,
2011), which provides superior resolution at high sample depth compared to conventional confocal microscopy, we imaged end-on cross sections of the nc 14 embryo to determine
the Dorsal-Venus nuclear gradient between 50 and 250 microns from the anterior pole. We found the gradient changes with AP location, becoming increasingly wider 100 microns or closer to the pole (Figures 2C-F). Therefore, our quantitative analysis of the Dorsal
gradient in the rest of this study will be based on measurements made from images of H2A-RFP and Dorsal-Venus during nc 11-14 in optical cross sections of embryos 150 microns
from the anterior pole (i.e., just posterior to the presumptive cephalic furrow; see Figure 3A and Movie S1).
Dynamic properties of the Dorsal-Venus nuclear gradient
We analyzed overall spatial properties of the Dorsal nuclear gradient throughout the
course of nc 11-14 by collecting 2P-SPIM time lapse images. The image processing tools extracted the nuclear Dorsal-Venus signal by segmenting the nuclear regions based on the H2A-RFP images. The parameters of the gradient amplitude (A), basal levels (B), and
The gradient amplitude [A(t)] increases from nuclear cycle to nuclear cycle (blue curve in Figure 3C), agreeing with previous data using fixed samples (Liberman et al., 2009) and
predictions from modeling studies (Kanodia et al., 2009). Moreover, the Dorsal-Venus gradient amplitude exhibits a “saw-tooth” pattern over time, never reaching steady state, consistent with single-nucleus traces from other live studies (DeLotto et al., 2007). This
pattern can be explained by the nuclei filling with Dorsal-Venus relatively slowly throughout each nuclear cycle interphase, then rapidly equilibrating with the cytoplasm
when the nuclear envelopes break down at the beginning of mitosis.
In contrast to the filling of the ventral-most nuclei with Dorsal-Venus, the dorsal-most nuclei appear to begin each interphase with “too much” Dorsal-Venus. As interphase
proceeds, these dorsal-most nuclei slowly evacuate nuclear Dorsal, causing the Dorsal levels in these nuclei [i.e., the “basal levels” of the gradient, B(t); see orange trace in Figure
3C] to decrease during interphase. When mitosis begins, basal levels rapidly increase. This counter-action between the Dorsal levels building in the ventral-most nuclei and declining in the dorsal-most, fits with the notion that the nuclei begin each interphase with Dorsal
levels equilibrated with the cytoplasm, and only after an intact nuclear envelope forms can selective nuclear import/export processes develop the nuclear concentration gradient. With
the successive import of Dorsal in ventral nuclei during each syncytial cycle, a cytoplasmic Dorsal gradient also develops that can be seen by the end of nc 13 mitosis when the nuclear envelope breaks down (Figures 3D-I). It was previously unappreciated that the overall
levels of Dorsal protein are non-uniform along the DV axis.
Our analysis of the Dorsal-Venus gradient over time shows a remarkably constant
Dorsal nuclear gradient always becomes nearly flat at the same location (roughly 40% DV position). This result was also suggested by our previous fixed tissue analysis, in which
the gradient width appeared to be unchanging from nuclear cycle to nuclear cycle (Liberman et al., 2009). However, the previous results obtained with fixed tissues left open the possibility that gradient widths could change either subtly across nuclear cycles or
significantly within a nuclear cycle. The live imaging done here dismisses that possibility. Measurements of the Dorsal-Venus nuclear gradient in three live embryos revealed
similar results (see Figure S1). Together, these results underscore two questions regarding the action of the Dorsal gradient. First, how does a constantly-changing morphogen gradient specify domains of gene expression? Gene expression patterns might be
established early then depend on cis-regulatory action, as has been proposed for the Bicoid network (e.g., Bergmann et al., 2007; Jaeger et al., 2004). Alternatively, mRNA
transcription of the target genes might constantly change, driven by the dynamic changes in nuclear Dorsal. Second, how does a signal as narrow as the Dorsal nuclear gradient control the expression pattern of genes past 40% DV position (e.g., the Type III genes)? In other
words, how could Dorsal provide reliable positional information given that its gradient is nearly flat?
Dorsal target gene expression patterns in space and time
To address the first question, we examined gene expression patterns in manually
cross-sectioned, wildtype embryos using multiplex in situ hybridization during nc 11-14 (see Figure 4 and Supplemental Experimental Procedures). As nuclear cycles get
respectively, based on nuclear morphology and density (Figure 4A). The brightness and contrast of images in Figure 4A-E were intentionally adjusted to visually highlight
distinctions; whereas, the profiles in Figure 4F come from analysis of the raw images (see Supplemental Experimental Procedures). In order to obtain a representative sampling of target gene dynamics, we examined four classical Dorsal-target genes of Type I (sna), II
(vnd), III+ (sog), and III- (zen) patterns. Genetic and cis-regulatory analyses support the view that these genes are Dorsal targets (rev. in Reeves and Stathopoulos, 2009).
Each of these classical Dorsal target genes have dynamic patterns of expression.
zen is expressed in the dorsal half of the embryo as early as nc 11, and builds in time until mid-to-late nc 14, when its expression pattern refines into a narrow stripe (Figure 4E),
presumably from Dpp signaling (Rushlow et al., 2001). On the other hand, the expression patterns of sna, vnd, and sog exhibit more complex dynamics (Figures 4B, 4C, and 4D,
respectively). sog transcripts, nuclear-localized and likely nascent, are observed as early as nc 12. The mature (non-nuclear) mRNA for all three of these genes is first seen in nc 13 (Figures 4B-D; see also Figure S2A). During this nuclear cycle, both sog and vnd are
initially expressed in ventral regions where sna normally would repress them. As nc 13 progresses, the levels of sog and vnd increase only outside the sna domain, presumably
because increasing activity of Sna repression limits expression in ventral regions. At the onset of nc 14, sog and vnd patterns are present with more uniform expression in ventral and lateral domains; little evidence of Sna-mediated repression is apparent. However, as nc
Our data demonstrate that domains of gene expression change during the transition between nc 13 and nc 14, in that repression in ventral regions is no longer
apparent at the start of nc 14 (Figure 4F and Figure S2). One possible explanation is that expression observed at the onset of nc 14 corresponds to early transcripts that avoid Sna repression, because Sna levels in early nc 14 are not high enough to repress sog and vnd.
To investigate further, we examined sog transcript localization more closely. At the beginning of nc 13, sog is present only as nuclear dots, likely sites of nascent transcription
in the nucleus, while sog in late nc 13 is localized outside the nucleus near the apical membrane. We interpret non-nuclear sog transcripts as being complete mRNAs, as they appear to have been exported from the nucleus. At the onset of nc 14, sog is once again
co-localized with nuclear staining and nuclear transcripts are absent (Figures 5A-C); non-nuclear transcripts appear again at mid nc 14 (Figure 4D). Moreover, the early nc 14
pattern shows little sign of Sna-mediated ventral repression. These results are consistent with the idea that the sog transcript is degraded in between nc 13 and nc 14.
We also inspected sna mRNA localization, thinking that if all transcripts are
degraded at the nc 13/nc 14 transition, then perhaps this could explain the loss of Sna-mediated repression in ventral regions. Instead, sna transcripts exhibit a different trend:
they switch back and forth between being delocalized (early nc 13, early nc 14) and apically localized (late nc 13, mid/late nc 14) (Figures 5D-F and Figure 4B). Little is known regarding the relationship between sna transcript localization/stability, but it has
been observed that for a number of other genes, mRNA localization is thought to affect function (Lecuyer et al., 2007). We did not find evidence during our time-course that sna
continued to test our working hypothesis, which was that decreased Sna levels result in derepression of genes at the start of nc 14.
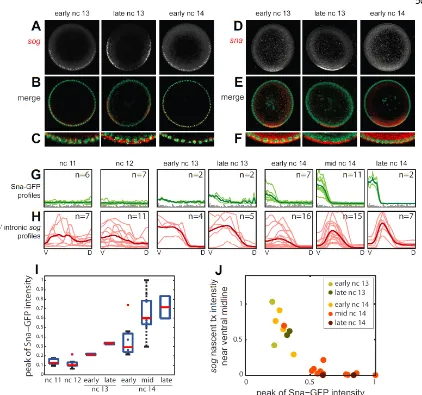
We hypothesized that insufficient levels of Sna protein (rather than transcript) at the start of nc 14 might account for lack of ventral repression, therefore we examined levels of Sna protein within embryos relative to sog transcript. Embryos carrying a Sna-GFP rescue
construct (Dunipace et al., 2011) were immunostained with anti-GFP, which is more robust than any anti-Sna antibody we have tried, and co-processed with a riboprobe to the 5’
intron of sog (Figure S3A), which provides a near-real-time assay of active sog
transcription. In analyzing these embryos, we found that Sna-GFP levels increase starting from nc 13 and reach peak intensity by the end of nc 14 (Figures 5G and 5I). While a
slight dip in average Sna levels is observed between nc 13 and 14, the levels are highly variable, perhaps because the staging of our fixed embryos is not fine enough to capture the
most rapid dynamics (e.g., Figure S2B). Nevertheless, in each embryo, we found a strong and consistent negative correlation between Sna-GFP and intronic sog in the ventral-most nuclei (Figure 5J and Figure S3B-F), suggesting that a threshold amount of Sna activity is
required to extinguish de novo sog transcription.
Lack of precision of the Dorsal gradient may explain graded expression profiles of Type III
genes
Our previous analysis of the Dorsal gradient led us to believe that its tails were flat,
suggesting it could not provide the positional information necessary to specify the domains of expression of target genes such as sog and zen (Liberman et al., 2009). The live imaging
did not have enough signal to noise ratio to yield quantitative information on the gradient tail within the domain of low nuclear Dorsal levels. To circumvent this technical challenge
and provide further insight into levels of nuclear Dorsal present in this domain, we quantified the Dorsal gradient in 153 fixed, manually cross-sectioned wildtype embryos at mid to late nc 14 (see Materials and Methods).
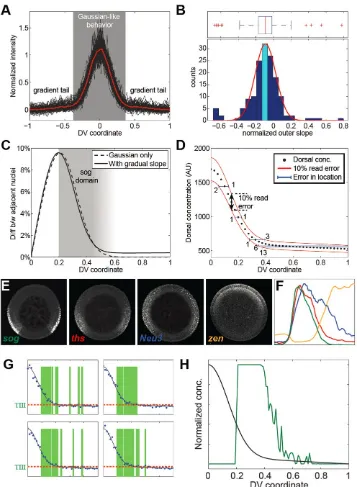
These measurements revealed that the Dorsal gradient displays two regimes (see Figure 6A). From the ventral midline up to 40% DV position, the gradient adopts a narrow
Gaussian-like shape (σ ~ 0.14; see Figure 1F). More dorsally, however, the gradient becomes more linear and can be empirically characterized by a constant slope (M) multiplied by x (the position along the DV axis; see Equation 2 in Materials and Methods).
The average slope of the gradient tail (normalized by the gradient amplitude) is -0.1± 0.03 (95% confidence interval; see histogram in Figure 6B). Thus, on average, nuclear Dorsal
levels slowly decrease with increasing x. However, there is a considerable amount of variance in the distribution as 25% of embryos were measured to have a positive slope to the tail. While a portion of this variance reflects measurement error, error cannot account
for the mean slope being definitively negative (see Figure S4).
With a gradually sloping tail and ventral, narrow Gaussian, it seems questionable
that Dorsal could deliver precise positional information to lateral and dorso-lateral positions. To address this quantitatively, we evaluated the relative difference in Dorsal concentration (Δc/c) that would be seen by neighboring nuclei (see Equation 4 in Materials
This is problematic as previous work has suggested that it is unlikely nuclei can reliably interpret concentration changes of less than 10% (e.g., Gregor et al., 2007a).
Another approach to examine the expected imprecision of the gene expression boundaries was to determine the effects of stochastic fluctuations in reading a shallow Dorsal gradient. In Figure 6D, we plot the Dorsal concentration for 40 nuclei along the
semi-circumference of DV axis (using Equation 2 in Materials and Methods) and increase and decrease this amount by 10%, the level of read error suggested by previous studies (red
curves in Figure 6D; Gregor et al., 2007a). With these fluctuations, the error in x for placing a gene expression boundary outside the steep Gaussian-like regime is six or more nuclei, even with a gradient tail that reliably slopes downward. The implication is that Type
III genes are located in a region where it is difficult for Dorsal to specify sharp, precise boundaries.
To investigate this issue further, we performed in situ hybridization of manually cross-sectioned nc 14 embryos with the antisense riboprobes of Type III transcripts. This analysis revealed that, in general, Type III genes (e.g., sog, ths, Neu3, and zen) possess
graded borders at different DV positions (see Figures 6E and 6F). Perhaps the lack of precision in positional information results in the graded borders of these genes in dorsal
regions (see Figures 6G and 6H). In other words, the noisy Dorsal gradient will activate gene expression in all nuclei in the graded border, but some more frequently than others depending on whether the nuclei read Dorsal to be above threshold. This would lead to a
Simulations of Dorsal-dependent patterning
Live imaging of the Dorsal-Venus nuclear gradient has revealed complex
dynamical behavior, with the gradient amplitude increasing and the basal levels decreasing over time. In addition, carefully examining mRNA expression in cross-sectioned embryos revealed graded boundaries of the Type III genes as well as gene expression dynamics
across and within nuclear cycles. Together, these observations seem related, yet it is not intuitively obvious what quantitative effect the Dorsal gradient dynamics may have on the
gene expression patterns. To test the plausibility of a causal relationship between the spatiotemporal dynamics of the gradient and its targets, we constructed a model of the wildtype Dorsal gradient based on our live and fixed tissue data (see Equation 2 and
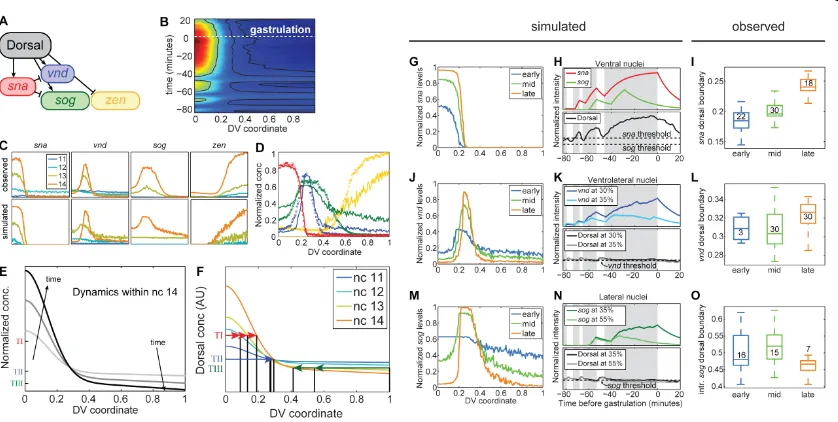
Materials and Methods). Moreover, we formulated a threshold-based model of mRNA dynamics to simulate expression patterns of sna, vnd, sog, and zen over nc 11-14,
according to the network depicted in Figure 7A (see Equation 3 in Materials and Methods). In our model, the mRNA lifetimes and the thresholds that dictate gene transcription were fit such that the simulations would optimally match the experimental data shown in Figure 4F
(see Figures 7C and 7D, and Materials and Methods).
The Dorsal levels simulated in space and time are shown in Figure 7B, in which the
black curves are contours of constant Dorsal levels, corresponding to the fitted thresholds for gene expression (Type I, II, and III from left to right). These threshold contours suggest that gene expression boundaries will move in time as a result of the dynamics of the Dorsal
gradient. This is demonstrated more clearly in Figure 7F, which depicts simulated Dorsal gradients near the end of nc 11-14 (horizontal arrows correspond to the signaling
throughout all four nuclear cycles, even in the face of the dynamics of the Dorsal gradient (Figure 7F; see also Figures 7J-L), while the DV positions of Type I and Type III
genes change significantly over nuclear cycles (red and green arrows in Figure 7F). In particular, during nc 14, the movement of the thresholds predicts Type I genes to expand, Type II genes to remain fixed, and Type III+ genes to begin the cycle expressed even in the
dorsal-most nuclei (Figure 7E).
Simulations of gene expression patterns agree with these general predictions of
threshold-dependent patterning. During nc 14, the simulated sna boundary moves dorsally (Figure 7G), the vnd boundary does not move (Figures 7J and 7K), and the sog domain begins broad, then the dorsal portion retracts (Figures 7M and 7N). These predictions
prompted us to investigate the nc 14 dynamics of these three genes in more detail using fixed embryos. The vnd dorsal boundary remains static in early and mid nc 14, and expands
only slightly in late nc 14 (Figure 7L). However, sna and sog expression is dynamic. As predicted based from our simulations, we found the sna domain expands during nc 14 (Figure 7I); and this specific result is supported by another study published recently
(McHale et al., 2011). Furthermore, while sog mature transcripts are expressed in a constant domain (data not shown), importantly the boundary identified using an intronic
sog probe, which serves as a ‘real-time’ proxy for responsiveness of transcription, shows the pattern retracts (Figure 7O).
Additionally, the threshold-based simulations offer a plausible explanation for the
observed on/off cycling of Sna activity and its consequences on the ventral repression of
sog and vnd. Simulated sna is expressed strongly in late nc 13, but decreases during nc 13
Afterwards, sna levels must build again in early nc 14 before it can repress sog and vnd. In the intervening time, sog (and vnd; not shown) is transcribed in the ventral-most nuclei
(Figure 7H).
We identified several differences between the simulations and the observed patterns of gene expression, most notably that sog expression is difficult to accurately simulate.
While the simulations correctly predict some aspects of the dorsal border of sog, in that it is graded and placed past 40% DV position (as explained by Figures 6G and 6H, and Figure
S5), the simulated border is more graded than seen experimentally; the entire dorsal portion of the embryo expresses sog strongly. If the threshold parameter for sog were raised slightly higher to attempt to restrict sog expression more ventrally, only a very narrow final
domain of sog is present (data not shown). The differences we see between the simulations and analysis of fluorescent in situ hybridization experiments may stem from a variety of
reasons, including roles for other activators and repressors in supporting expression. For example, if a dorsally-acting factor (such as zen or another gene expressed in a similar domain) were to repress sog, then the lower threshold combined with the action of such a
dorsally-acting repression could support expression of sog in a domain more comparable to the endogenous pattern (see Figure S5B).
Although Dorsal is an important player in patterning of these genes, there are indeed other inputs required for full DV patterning; for example, as stated above, some additional input is required to explain the sog dorsal boundary. Nevertheless this simple
model incorporating only the interactions in Figure 7A does remarkably well, in that the model was able to demonstrate the plausibility that the observed gene expression dynamics
DISCUSSION
The observations that morphogen gradients are dynamic have raised questions about the influence of time on pattern formation (rev. in Kutejova et al., 2009). In this paper, we
investigate quantitatively how the nuclear distribution of Dorsal, which rapidly changes throughout the nuclear divisions in the Drosophila blastoderm, gives rise to precise gene
expression patterns. Our findings reveal that, in contrast to Bicoid, whose nuclear distribution stabilizes relatively quickly both between and within nuclear cycles (Little et al., 2011; Lucchetta et al., 2008), the Dorsal gradient is highly dynamic, exhibiting a
temporally oscillating pattern of nuclear Dorsal concentrations that never reaches a steady state. The dynamics within a nuclear cycle result from the slow net nuclear import of
Dorsal throughout each nuclear cycle interphase, followed by an abrupt export of Dorsal when the nuclear envelopes break down at the beginning of mitosis. We suggest these slow dynamics associated with nuclear localization of Dorsal relate to Toll-mediated signaling
being required for its ability to gain competence to enter the nuclei. In addition, early nuclear cycles may concentrate an initially uniform distribution of Dorsal onto the ventral side of the embryo thereby redistributing the overall concentration of Dorsal protein over
time.
The dynamics of the nuclear Dorsal gradient appear to determine the temporal
evolution of gene expression. Our observations show that Dorsal target gene expression follows a dynamic pattern similar to the Dorsal gradient, both within and across nuclear cycles. An implication of these observations is that gene expression patterns are able to
similar to the manner that target genes respond to Activin in the Xenopus embryo (Gurdon et al., 1995). However, in contrast to Activin-dependent patterning, Dorsal target
genes do not appear to exhibit a “ratchet effect”, as it is possible to turn on/off gene expression by changing the levels of Dorsal above/below an activation threshold. Thus, the response of target gene expression to Dorsal levels appears to be a “real-time” response.
Our data further suggest that the activity of Sna protein is also transient and/or that repression is delayed compared to onset of transcription, as both sog and vnd are
ventrally-repressed by the end of nc 13 and deventrally-repressed in some early nc 14 embryos.
The highly dynamic patterning of genes along the dorsal-ventral axis documented in this study could possibly allow for fine-tuning of gene expression patterns to respond to
feedback and/or buffer against genetic and environmental perturbation. In support of this hypothesis, many genes expressed at this stage along the DV axis support relatively short
transcripts of less than 5 kB (such as sna, twi, vnd, rho, brk, wntD, and zen to name a few), and thus are able to respond quickly to changes in the Dorsal gradient and/or in cis-regulation of other DV genes. In contrast, genes with larger transcripts, such as sog or Neu3
of 20+ kB in length, will take 15+ min to transcribe at a rate of 1.1-1.4 kB/min (Shermoen and O'Farrell, 1991; Thummel et al., 1990). Because any incomplete nascent transcripts are
most likely aborted and degraded upon cell division (Rothe et al., 1992; Shermoen and O'Farrell, 1991), these long transcripts are particularly constrained by the rapid (~10 minutes) mitotic cycles of the early embryo. In addition, the action of Sna repression
Sna) and, together with Dorsal, is proposed to play an important role in regulating the timing of gene expression.
The nuclear distribution of Dorsal does not reach a steady state and yet the expression patterns of most Dorsal target genes appear to stop changing at mid-to-late nc 14. This may result from the fact that the Dorsal gradient changes more slowly during this
period and/or that at this point patterning may have been stabilized by the logic of the cis-regulatory network. At the onset of gastrulation, when Dorsal levels plummet, some
patterns are extinguished whereas others are retained. We suggest those that are retained must rely on a Dorsal-independent mechanism to support expression along the DV axis. For example, several genes (e.g., sim and vnd) switch to autoregulatory feedback
mechanisms to retain expression within the same domain and thereby no longer depend on Dorsal to support activation (Nambu et al., 1991; Von Ohlen et al., 2007).
The low slope of the Dorsal gradient in the lateral and dorso-lateral regions of the embryos makes it unlikely that the Dorsal morphogen gradient can specify precise domains of gene expression (i.e., sharp boundaries) here. Each Type III gene analyzed in this study
exhibited a graded border, and our results lead us to propose two mechanisms that may contribute to this pattern. First, while a recent study showed that stochastic gene expression
along the dorsal-ventral axis relates to polymerase pausing (Boettiger and Levine, 2009), we highlight that stochastic expression is a common phenomenon associated with most genes of Type III pattern. In addition, a time-averaging mechanism (Tostevin et al., 2007),
we propose, will give rise to a graded expression response at the gradient tails. Second, if the basal levels of the Dorsal gradient decrease within a nuclear cycle, then the location