Epigenetic Regulation at the Single-Cell Level
Thesis by John Yong
In Partial Fulfillment of the Requirements for the Degree of
Doctor of Philosophy
California Institute of Technology Pasadena, California
2015
Acknowledgements
Through reading other’s theses and on the journey of writing my own, I have developed a fondness for the Acknowledgements section. Surely, the rest of a thesis past these first pages encompasses the culmination of many years of work. These opening words, however, reflect the personal, human side of scientific research. They put on display the joy, sweat, excite-ment, camaraderie, and humility that fill the days and nights behind the work presented. They remind us that the work of a thesis is vary rarely the product of a single person, but of collaborations, interactions, formal and fortuitous mentorships, influences and inspirations, mental supports, and actual helping hands, inside and outside the laboratory. They tell us the story behind the story.
has forever changed the way I see a seminar or a paper, or prepare my own. For all of these, I am extremely grateful.
– for inspiring me to push my body to the limit, and showing me by example when one has pushed too far. To the late night crew – Mark Budde, Adam Rosenthal, Yihan Lin, Amit Lakhanpal, Fangyuan Ding, Yutao Qi, and Kirsten Frieda for livening up the hallways around the clock. Also to Hao Yuan Kueh, Lauren LeBon, Pierre Neveu, Emily Capra, and Pulin Li for their friendship and advice at various points over the years. Most importantly, to my buddies, Joe Levine and Sandy Nandagopal, for sharing the full range of grad school moments and emotions, and for enduring my futile and irrelevant jokes and puns, and quotes from a 20-some-year-old TV series.
And then there are my dearest friends and organizations outside the lab that made LA home for this foreigner. Mikey, Arjuna, Amy, Lorelei, Andreas, Nick, Alex, Kawai, Charlie, Laura, Eric, Harry, Ryan, Johnathan, Kenny, Kyle, Keith, LAFR, Caltech PRISM, Caltech Glee Club, GMCLA, and Westside Comedy. You have touched my life, helped me grow, and changed me – mostly for the better, but definitely for good.
Abstract
The ability of cells to establish and remember their gene expression states is a cornerstone of multicellular life. This thesis explores how gene expression states are regulated dynamically, and how these regulations differ in individual cells even under the same conditions. These properties underlie cellular state decisions and often determine the balance between different cell types in a multicellular system, but are typically inaccessible to conventional techniques that rely on static snapshots and population averaging. We address these issues in two separate contexts, one natural and one synthetic, using time-lapse imaging and other single-cell techniques.
In the first context, we use embryonic stem (ES) cells, which were shown to exist in a mixed population of at least two cellular states with distinct differentiation propensities, as a model to study natural dynamics of cellular states. These cells display rare, stochastic, and spontaneous transitions between the two states, as well as more frequent fluctuations in gene expression levels within each state. Our system enables us to further investigate how these dynamics are modulated under a cell signaling environment that enhances pluripotency, and the role DNA methylation plays in maintaining these states.
Contents
Acknowledgements iv
Abstract vii
Contents ix
List of Figures xi
1 Introduction 1
1.1 Cellular and Gene Expression States . . . 4
1.1.1 What are cellular states? . . . 4
1.1.2 How do cellular states arise? . . . 5
1.2 Heterogeneity in Multicellular Systems . . . 9
1.2.1 How does heterogeneity in gene expression levels arise? . . . 10
1.2.2 Techniques to study cellular states and heterogeneity . . . 11
1.3 ES Cells, Cellular States and Dynamic Heterogeneity . . . 13
1.3.1 What are ES cells? . . . 13
1.3.2 Heterogeneity in stem cells . . . 14
1.4.1 What are chromatin modifications and chromatin regulators? . . . . 18
1.4.2 How do chromatin modifications regulate gene expression? . . . 19
1.4.3 Inheritance and propagation of chromatin modifications . . . 21
1.5 Dynamics of Cellular State Regulation: Outstanding Questions . . . 23
1.6 Contributions of This Thesis . . . 25
2 Dynamic Heterogeneity and DNA Methylation in Embryonic Stem Cells 27 2.1 Abstract . . . 27
2.2 Introduction . . . 28
2.3 Results . . . 30
2.4 Discussion . . . 46
2.5 Materials and Methods . . . 50
3 Dynamics of Epigenetic Regulation at the Single-Cell Level 53 3.1 Abstract . . . 53
3.2 Introduction . . . 54
3.3 Results . . . 57
3.4 Discussion . . . 70
3.5 Materials and Methods . . . 79
Concluding Remarks 83
Bibliography 87
A Supplemental Information for Chapter 2 105
List of Figures
1.1 Cellular states and their dynamics . . . 2
1.2 Cell-cell variability in gene expression levels . . . 10
1.3 Lineage specification in early embryonic development . . . 14
2.1 Different types of gene expression heterogeneity . . . 29
2.2 smFISH reveals gene expression heterogeneity and correlation . . . 32
2.3 The two Rex1 states are differentially methylated . . . 36
2.4 Movies reveal transcriptional bursting and state-switching dynamics in indi-vidual cells . . . 38
2.5 2i and DNA methylation modulate bursty transcription and state-switching dynamics . . . 42
3.1 Platform for studying the dynamic control of epigenetic regulation . . . 59
3.2 Silencing occurs in a stochastic, abrupt, and all-or-none fashion . . . 62
3.3 Molecular characteristics of the silent states . . . 66
3.4 Dynamics of reactivation and epigenetic memory . . . 68
3.5 Each regulator implements distinct transition rates, independent of recruit-ment time . . . 71
Chapter 1
Introduction
The development and operation of a multicellular organism is an intricate business. Devel-opment begins with a single cell, the fertilized egg, and spontaneously unfolds over many cell divisions and cellular differentiation, eventually giving rise to an adult body. Take hu-mans as an example: An adult human consists of about 30 trillion cells [1], in over hundreds of different cell types [2]. Some of these cell types can be incredibly stable – for instance, a neuron can maintain its identity for decades. On the other hand, some cells can switch cell types when necessary, a property that is especially critical during development and in response to environmental signals. With a few exceptions, most notably in the adap-tive immune system, where genetic recombination and mutation are harnessed to generate diversity, all of these cells rely on essentially the same genome [3].
Balance / ratio? Timing?
Memory / stability? Regulation?
Cellular state
Cell state A
Cell state B
Gene expression states
Gene A Gene B Gene C ...
High Low High
Function and phenotype
[image:13.612.112.537.61.218.2]A
B
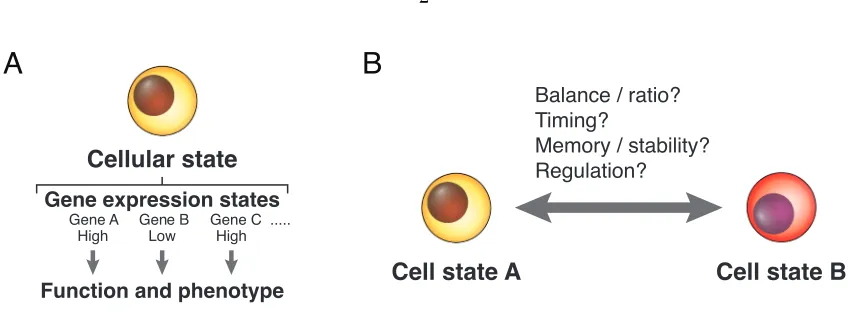
Figure 1.1: Cellular states and their dynamics
(A) A cellular state is defined by the collection of gene expression states, which determine the function and phenotype of the cell. See Section 1.1 for detailed discussions.
(B) Fundamental questions about cellular state dynamics and regulation.
Many genome-wide studies have revealed profiles of gene expression levels of different cell types, as well as specific transcription factors whose expressions are required for these cells [4–6]. Nevertheless, fundamental questions about gene expression states remain to be answered (Figure 1.1B). For instance, how are gene expression states regulated? What is the expression dynamics of a gene within a gene expression state? What happens when a gene switches from one state to another? How fast and frequently do switches occur, and how long do the new states last? Understanding these processes could eventually enable us to control cellular identity in synthetic systems and correct aberrant gene expression states in diseases.
10–12]. Using single cell techniques, we can directly characterize the extent of heterogeneity in a system and separate that from the underlying changes in cellular states.
rates are tunable by either changing the signaling environment (in ES cells), or switching the regulators recruited (in the synthetic recruitment system). Together, we propose that these dynamic properties enable multicellular systems to do two things: to establish stable, well-defined gene expression states, and to tune the fraction of cells in each of these states. This is discussed in detail in Chapter 3.
1.1
Cellular and Gene Expression States
1.1.1 What are cellular states?
indicators that can track cellular functions and differentiation potentials dynamically, and in individual cells. This role could be served by the expression of key regulatory genes.
Both the functions and differentiation potentials of a cell ultimately originate from the activities of and interactions between different biomolecules in a cell, including DNA, RNA and proteins. The transcription of genes from DNA, partly controlled by the levels of transcription factors in the cell, governs the levels of RNA and proteins, and through their activities, the rate of biochemical reactions inside the cell. Furthermore, the level of some proteins and RNA (e.g. transcription factors and miRNA) can feed back into regulating gene expression and, collectively, these interactions form the genetic circuits. Thus, the expression levels of different genes reflect a cell’s function as well as the active interactions within the genetic circuit at a given time. Here, we define cellular state as the collection of gene expression states in a cell. Since gene expression is an intrinsically stochastic process, a gene expression state does not deterministically specify a single expression level of a gene in the cell. Instead, it is associated with a probability distribution of gene expression levels [15, 16]. This inherent variability in gene expression levels within a single cellular state can obscure the identification of cellular states, as we will discuss in detail in Section 1.2.1.
1.1.2 How do cellular states arise?
modifications can control the accessibility of a gene locus to transcriptional activity, while transcription factors can interact with each other to form feedback circuits that lock in expression levels of the genes involved. These modes of action are discussed in detail below. Nevertheless, these two systems are not mutually exclusive, as some transcription factors are known to alter chromatin modifications, and factors that primarily alter chromatin modifications can regulate each other and form a circuit.
Chromatin modifications and regulators
In eukaryotes, DNA is wrapped around histone proteins to form nucleosomes, the basic structural units of chromatin. Without altering the sequence of the DNA, and therefore the identity of the RNA and protein encoded, chromatin can be covalently modified to reg-ulate the expression of genes nearby [17]. The first chromatin modification discovered was cytosine methylation on DNA at CpG dinucleotides, which was associated with repressed gene expression in vertebrates [18–20]. In the two decades that followed, many more chro-matin modifications were identified, including cytosine hydroxymethylation on DNA, and methylation, acetylation, phosphorylation, ubiquitination, as well as other modifications on various amino acid residues on the N-terminal of histone proteins [17, 21, 22]. Methylation and hydroxymethylation of DNA in vertebrate genomes mostly occur at CpG sites. In con-trast, modifications on histones are more complicated, since modifications can be added to histones at different amino acid residues and for different number of times. For instance, histone 3 (H3) can be methylated at different lysine residues (e.g. H3K4, H3K9, H3K27 etc.), and for one to three times (e.g. H3K4me, H3K4me2, H3K4me3, H3K9me etc.).
factors that can specifically add or remove modifications (writers anderasers, respectively), as well as factors that specifically bind to the modifications (readers). Readerscan, in turn, recruit other factors, including writers and erasers. Take DNA methylation, for example; methyl groups are specifically added to CpG dinucleotides by DNA methyltransferases (Dn-mts,writers), and removed through a partially mapped mechanism that involves conversion of methylcytosine to hydroxymethylcytosine by Tet proteins (erasers). Writers anderasers
are often part of larger chromatin-modifying complexes that include other subunits with context-dependent DNA-binding properties. Finally, methylated CpG can be specifically bound by a family of methyl-CpG-binding proteins, including MeCP2 (readers).
Transcription feedback
Transcription factors are proteins that bind to specific DNA sequences and alter the level of transcription of adjacent genes, either up-regulating (activators) or down-regulating (re-pressors) them. In eukaryotes, the mechanisms of transcription regulation fall into two conceptual categories [31]. In the first category, transcription factors can control recruit-ment and activity of the transcription apparatus. Activators can physically bind to the RNA polymerase II-containing transcription initiation apparatus and recruit it to the tar-get gene, or promote transcription elongation by the polymerase. In contrast, repressors can interfere with the binding of the transcription initiation apparatus to DNA, or compete for the activator binding sites. In the second category, transcription factors can recruit CRs that write or erase chromatin modifications. Although transcription factors in this second category may regulate gene expression and memory through chromatin modifica-tions, non-chromatin-modifying transcription factors are themselves sufficient to generate gene expression memory through the formation of transcription factor circuits. We will focus our discussion on this emergent property of transcription factor circuits.
Because a transcription factor binds to DNA by recognizing a specific binding site, it can be recruited to an arbitrary number of genes, including the transcription factor itself, simply by having its binding site inserted near the promoter of these genes. This allows the transcription factor to regulate the expression of its target genes in a concerted manner. These target genes may code for proteins that carry out various biological functions, or other transcription factors. Different transcription factors can therefore connect to form a regulatory network, i.e. a transcription factor circuit.
experiments and mathematical modeling, since the 2000s (reviewed in [32, 33], also see [34]). Genetic circuits that display oscillation [35], multi-stability [36], reduced variability [37], switch-ability [38], or excitability [13] were synthesized and tested in living cells. Many of these circuits contain motifs where a transcription factor regulates its own expression, either directly (auto-regulatory) or indirectly (through other factors). These motifs are shown to produce well-defined gene expression levels and/or result in gene expression memory [39]. For instance, a single transcription factor that down-regulates its own expression creates a simple negative feedback loop, which produces stable expression of the factor with a reduced range of fluctuation [37]. In contrast, positive feedback loops, in their simplest forms as one-node (auto-regulatory) [36] or two-node (two factors that mutually repress each other) [38] systems, can generate bi-stability. Whereas a one-node system can either be fully OFF, or locked into an ON state, a two-node system can be locked into expressing either one, but not both, of the two factors. Effectively, a system with a positive feedback loop can generate more than one gene expression state. Since transcription factor molecules are partitioned more or less evenly into daughter cells over cell division events, gene expression regulation can be maintained over these events. As a result, the expression state in a cell can persist through cell generations. Transcription feedback can therefore be used, and is used, in both natural and synthetic systems to establish and maintain gene expression states.
1.2
Heterogeneity in Multicellular Systems
different expression levels of one gene (Figure 1.2). On the contrary, distinct states that are close to each other in their mean expression levels can overlap in their expression level distributions at the population level, making it difficult to discern the state of a cell with just one measurement of the expression of one gene. In this section, we will explore the origins of heterogeneity in multicellular systems, and the experimental techniques used to study this phenomenon.
Gene Expression Level
Popula
tion
Fr
ac
tion
Gene Expression Level
Popula
tion
Fr
ac
tion
Gene Expression Level
Popula
tion
Fr
ac
tion
+
=
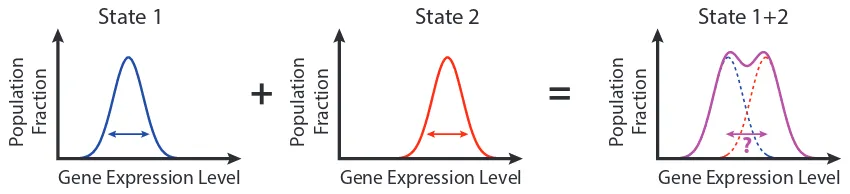
State 1 State 2 State 1+2
[image:21.612.111.536.236.333.2]?
Figure 1.2: Cell-cell variability in gene expression levelsCells within a single state
can exhibit variation in gene expression levels due to gene expression noise (left hand side, blue and red arrows indicate variance in each distribution). Mixture of cells in different states can convolute the estimation of the number of states within the system, and the assigning of state to cells found within the overlapping range of expression levels (right hand side, magenta arrow).
1.2.1 How does heterogeneity in gene expression levels arise?
On the other hand, the gene expression process itself has long been proposed to con-tribute to significant variability in gene expression levels. This phenomenon, termed gene expression noise, arises due to the inherent stochastic nature of the gene expression process, which involves random interactions of small numbers of molecules and stochastic switch-ing between different chromatin configurations of the promoter. These models have been reviewed extensively [7, 16], and are supported by an abundance of recent experimental studies [9, 40–42]. As a result of gene expression noise, even cells that inhabit a single state can display a range of expression levels of a gene.
As discussed above, variability in gene expression can confound the investigation of cel-lular states. Nevertheless, gene expression noise can also be important to cell fate decision. In some cases, cells have been shown to take advantage of this noise in gene expression and augment it through positive feedback to generate phenotypic variation to the benefit of the multicellular system as a whole [7, 13, 43, 44]. The quest for quantifying heterogeneity is therefore twofold – to distinguish the underlying cellular states from noisy gene expression, and to characterize the extent of noise in different genes, which may help us understand how noise contributes to cellular behaviors [45–47].
1.2.2 Techniques to study cellular states and heterogeneity
gene expression heterogeneity results in observable phenotypic differences, such as in fur color of calico cats due to random X chromosome inactivation [49, 50] and eye color of mutant Drosophila due to position-effect variegation [51, 52], this heterogeneity among otherwise identical cells can only be visualized usingin situ hybridization or other imaging techniques [53, 54]. Alternatively, cell-cell variability may be detected using non-imaging based methods at the single-cell level when the limitation of initial sample size is overcome [55, 56]. These techniques, however, remain limited to static measurements due to their reliance on fixed or lysed cells.
With the advent of fluorescent proteins [57], it has recently become possible to measure and follow the expression levels of specific genes in living cells. Combining fluorescent reporter transgenes with techniques that enable signal quantification of individual cells, such as flow cytometry and fluorescence time-lapse microscopy, now gives us the tools to separate the dynamic behaviors of individual cells from the averaged properties of a cell population. These tools also allow us to investigate the dynamic nature of transcription circuits [13, 35, 58, 59].
1.3
ES Cells, Cellular States and Dynamic Heterogeneity
1.3.1 What are ES cells?
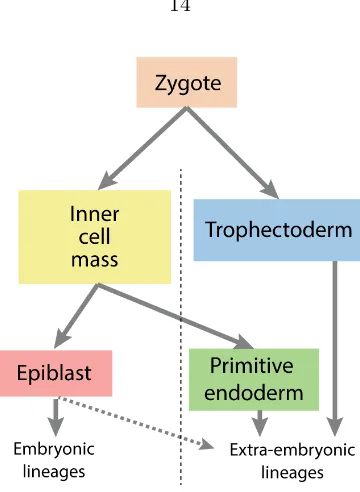
After fertilization, a mammalian egg undergoes several rounds of cell cleavage to give rise to a spherical mass of cells known as the morula, followed by compaction of these cells and further cell divisions to generate a blastocyst. The early blastocyst (∼3.5 days post fertilization, or dpf, in mice;∼5 dpf in humans) consists of a cavity and chiefly two distinct lineages of cells (Figure 1.3): the trophectoderm (TE), which forms the outer layer of the blastocyst, and the inner cell mass (ICM), which resides in one side of the cavity. It is from the ICM that ES cells are derived, by explanting and culturing in a supporting medium [60–62]. The inner cell mass (ICM) and ES cells are both pluripotent, in that they can contribute to all cell types within the body when they are re-introduced into the embryo. Additionally, ES cells can be differentiated into various cell typesin vitro. Furthermore, ES cells can be propagated extensively in culture while largely maintaining pluripotency over many generations, a characteristic called self-renewal. These properties make ES cells a very attractive candidate for therapeutic research, as they may be manipulated for a poten-tially unlimited supply of different cell types that can be used for regenerative treatment. Furthermore, they also serve as anin vitro model for the study of differentiation.
Figure 1.3: Lineage specification in early embryonic development
their ability to contribute to all somatic cell types. Unlike ES cells, however, iPS cells can be derived directly from a patient and therefore share the same genotype. This property provides iPS cells with the distinct advantage of obviating immune rejection when these cells are treated and returned into the patient. The invention of iPS cells represents a big stride towards personalized medicine, and earned Yamanaka a Nobel Prize in 2012 – a prize he shared with John Gurdon for the latter’s research on somatic cell nuclear transfer in 1962 [64] – with simultaneously one of the shortest and longest delays between discovery and award in the history of the prize.
1.3.2 Heterogeneity in stem cells
yolk sac is derived. Similarly, ES cells are able to contribute to both epiblast and, at a lower frequency, primitive endoderm when introduced into an early blastocyst to form a chimera [65]. The transcription factors Nanog and Gata6 were shown to be necessary for the establishment of epiblast and primitive endoderm, respectively [66, 67].
Surprisingly, it was later discovered that Nanog and Gata6 are expressed in opposing salt-and-pepper patterns in the ICM of early blastocysts [68], indicating at least two cellular states within the population. A similar pattern of Nanog expression was later found in ES cells (Gata6 expression was also detected, albeit at a lower level) cultured under the standard pluripotency supporting condition [69, 70]. These results suggest that the ICM and ES cells inhabit at least two cellular states. Nevertheless, the gene expression patterns in these cells are not deterministic, as application of inhibitors along the FGF/MEK/ERK signaling pathway can force all cells into the higher Nanog expressing state in both contexts [71, 72]. Finally, Oct4, a pluripotency-associated transcription factor that is expressed in epiblast, but not primitive endoderm, is expressed uniformly in both the ICM and ES cells, indicating that these cells are not merely mixtures of differentiated epiblast and primitive endoderm cells. Together, these findings shattered earlier assumptions that pluripotent cell types exist as homogeneous populations, and heralded the idea that spontaneously generated gene expression heterogeneity may serve to prime cells into distinct lineages once differentiation commences.
individ-ual cells switch between different cellular states. This was indicated by experiments sorting cells into subpopulations using the level of surface markers or fluorescence reporter, and following these subpopulations at subsequent time points. In ES cells, for instance, sorted Nanog-high and Nanog-low subpopulations can slowly give rise to cells of the opposite state on the timescale of days [69]. In a separate context, human breast cancer cells can be sorted into stem-like, basal, or luminal states, with the stem-like cancer cells having higher tumor-seeding ability and drug resistance [73]. Critically, each of these cell types is capable of regenerating all three cell types, suggesting that a treatment regime that only targets stem-like cancer cells is unlikely to completely ablate tumor malignance, an implication that is of obvious clinical relevance.
1.3.3 Transcription factor circuit in ES cells
What is the origin of the heterogeneous yet dynamic system in ES cells? A candidate mechanism, as we have introduced in the previous section, is transcription feedback. An excitatory [13] or oscillatory [35] transcription factor circuit, for example, can generate gene expression patterns that are both heterogeneous and dynamic. In order to obtain a picture of the effective transcription factor circuit in ES cells – a minimal circuit that can describe the essence of the observed dynamics and degree of heterogeneity – one needs to first identify the nodes (transcription factors) involved in the circuit and the wiring between them.
[69, 70, 74, 75]. These include Stella, Rex1, Sox2, Klf4, Tbx3, and Esrrb. Two groups of researchers then performed genome-wide assays to elucidate the regulatory connections among these transcription factors and other core pluripotency associated transcription fac-tors, such as Nanog, Oct4 and c-Myc. These experiments either map the global binding patterns of these transcription factors [76], or the changes in global gene expression patterns in response to perturbations of the expression levels of these factors [77]. The results from these studies typically suggested that the transcription factor circuit regulating pluripotency is highly interconnected, with different transcription factors often up-regulating themselves and many other factors. At the core of these circuits are the interactions between Nanog, Oct4 and Sox2, where Oct4 and Sox2, either independently or as a dimer, activate each other as well as Nanog. Nanog, in turn, activates both Oct4 and Sox2. Finally, all three factors activate themselves. This core circuitry forms a strong positive feedback system, which is believed to generate multi-stability in gene expression, as we discussed in Section 1.1.2.
transi-tions, to an oscillatory system [59], to a noise-driven excitable system [58]. At the time of these models, there were no reported direct measurements of the dynamics of Nanog expression in individual cells to impose restrictions on these models. It is also important to note that all of these models were drawn from a subset of putative transcription interactions that are each supported by some experimental evidence. The divergent dynamic behaviors of these slightly differing models thus highlight the critical need for these theoretical ap-proaches to the understanding of a complex system to be supplemented by direct dynamic measurements of the system.
1.4
Chromatin Modifications, Chromatin Regulators and Gene
Expression States
1.4.1 What are chromatin modifications and chromatin regulators?
As introduced in Section 1.4, many chromatin modifications and regulators are associated with the regulation of gene expression states and epigenetic memory. In this section, we will focus on how these associations are uncovered, and the mechanisms through which the regulation is mediated.
immunoprecipitation (PolII RIP), followed by sequencing. These studies provided useful insights on the correlation between different modifications and the level of gene activation or repression they may provide.
1.4.2 How do chromatin modifications regulate gene expression?
There are two types of characterized mechanisms that can mediate gene regulation down-stream of chromatin modifications. The first type involves disrupting the contacts between different histones in neighboring nucleosomes, or that between histones and DNA [17]. Among the various types of histone modification, acetylation is at the center of this hy-pothesis due to its ability to modulate the electric charge of histone tails. The addition of acetyl groups neutralizes the positive charge of lysine residues, and can disrupt binding between these lysine residues and the negatively charged phosphate backbone on DNA [78]. As for interactions between neighboring nucleosomes, the tail of nonacetylated histone H4 on one nucleosome is proposed to interact with a cluster of acidic amino acids on histones H2A/H2B on an adjacent nucleosome [79]. This interaction could cause a multi-nucleosomal array to condense into a compact 30nm-fiber, a secondary chromatin structure. In vitro ex-periments demonstrated that constitutive acetylation of histone H4 at residue K16 impedes the formation of this fiber [80]. Together, these results support a molecular mechanism in which histone acetylation promotes a more open chromatin structure, which in turn leads to higher accessibility to transcription machineries and increased gene expression. Removal of acetylation by histone deacetylases (HDACs) can therefore promote chromatin compaction and lead to gene silencing [81, 82] .
of different modifications [17]. These transcription factors and readers may provide tran-scriptional or regulatory activities to the gene locus, or they may recruit other factors that carry such activities. DNA methylation, for example, exhibits this type of regulation on various levels [22].
First, methylation can directly interfere with the binding of transcription factors. In vitro experiments showed that methylation at a viral promoter, AdMLP, blocks the binding of a mammalian transcription factor, MLTF, and inhibits transcription from the promoter [83]. The occlusion to binding depends on methylation at a specific CpG position within the transcription factor binding site at the promoter, and unmethylated promoter is actively transcribed.
Second, methylation can interfere with the binding of “insulator” proteins, which regu-late the interactions between a promoter and its enhancers. This is shown in the imprinting of mouse Igf2 gene, where methylation of an intergenic region is associated with active expression of a nearby gene, as oppose to promoter methylation in the other examples. Here, binding of “insulator” proteins, CTCFs, at an unmethylated control region on the maternal allele prevents the action of a distal enhancer and blocks Igf2 expression [84]. On the paternal allele, however, the CpG sites within the control region are highly-methylated, thereby abolishing CTCF binding and enabling Igf2 to express.
shown to associate with corepressor complex mSin3a and HDACs [86]. Binding of MeCP2 at methylated chromosomal loci therefore represses gene expression partly by removing histone acetylation and promoting chromatin compaction as described above. Altogether, these studies highlight the complex nature of chromatin regulation, with crosstalks between pathways of different modifications, and the role of these modifications in gene regulation and pathology.
1.4.3 Inheritance and propagation of chromatin modifications
The discovery of base-pairing in double stranded DNA pointed to an elegant solution to the faithful inheritance of genetic code through replication. Similarly, the discovery of Dnmt1 foretold a simple model of maintenance for CpG methylation [87]. Dnmt1 can bind hemi-methylated CpG, sites that are hemi-methylated on one strand only, and methylate the opposite strand. Unmethylated DNA can acquire CpG methylation on one strand through the action ofde novo methyltransferases, Dnmt3a or Dnmt3b. The resulting hemi-methylated DNA is then recognized by Dnmt1, which leads to methylation on both sides of the CpG palindrome. During DNA replication, each progeny DNA will have one inherited, methylated strand and one newly-synthesized, unmethylated strand. Continuous presence of Dnmt1 ensures that all hemi-methylated progeny DNA will be fully methylated, and that the methylation pattern persists over cell generations.
to have readers that can recruit writers/erasers for the same mark. These include Eed (reader) and Ezh2 (writer) for H3K27me3 [90], HP1 (reader) and SUV39H (writer) for H3K9me3 [88, 91–93], and Sir3 (reader) and Sir2 (eraser) for deacetylated H4K16 [94–96]. Thesereader-writerandreader-eraser pairs are proposed to recognize the inherited histones seeded with a particular modification and replicate the same modification to neighboring, newly incorporated histones, thereby conserving the original pattern of modifications.
This proposed mechanism, however, is challenged by recent findings that methylated histones (H3K27me3 and H3K4me3) are replaced by non-methylated histones during DNA replication [97]. Instead of existing histone modification seeding the progeny DNA molecules, it is indicated that complexes writing these marks (Polycomb and Trithorax groups, for H3K27me3 and H3K4me3, respectively) are continuously associated with the DNA during the replication process. These results suggest a contrasting model for histone mark in-heritance, where writer complexes remain bound to specific gene loci and re-establish the modification patterns after replication. It will be interesting to see if this second mechanism represents a general strategy for all histone modifications and cell types, or if the two pro-posed mechanisms co-exist in a context-dependent manner. Regardless of the mechanism, however, it is well-established that some histone modifications (e.g. H3K9me3) can persist across cell divisions even in the absence of the signal that originally triggered the addition of the mark [98]. These results provide strong evidence that chromatin marks, together with the background machineries of CRs, are sufficient to impart gene expression regulation and memory.
sim-ulation of a simple stochastic model, Hathaway et al. [98] showed that modification at a single nucleation site can lead to a steady state domain through spreading. This domain has a finite size as a result of competition between propagation of marks to neighboring nucleosomes and turnover of marked nucleosomes with unmarked ones. The profile of this simulated modification domain resembles the ones obtained from chromatin immunoprecip-itation (ChIP) assays at different sites around a single gene [98], or averaged genome-wide across different loci [99]. These results highlighted the dynamic nature of chromatin regu-lation, and supported a stochastic model for the underlying molecular process, suggesting that the response at the level of individual cells may also be stochastic.
1.5
Dynamics of Cellular State Regulation: Outstanding
Ques-tions
Despite much work on elucidating the molecular players and pathways involved in cellular states, fundamental questions on how these states are established, maintained over time, and altered remain unanswered. More specifically, we ask:
• What are the dynamics of gene expression in individual cells within a
cellular state and in cells transitioning between states? It is now evident
cell types. These questions can only be answered using single-cell techniques. The resulting experimental platform, in turn, enables further interrogation of the system under different perturbations.
• How do CRs control gene expression in single cells? From the perspective
of establishing a new gene expression state, either under a natural or synthetic con-text, CRs represent a critical point of control connecting the signal that triggers CR recruitment to the alteration of chromatin and its downstream gene regulation and memory. What is the causal relationship between recruitment of different CRs and the dynamic response of the target gene? How strongly and how rapidly can each CR alter gene expression? What type of gene expression memory can they generate? Furthermore, given the evidence of stochastic response in some context of chromatin regulation, such as in X-inactivation and position-effect variegation, we would like to know how the response to CR recruitment varies between individual cells.
• How can a multicellular system control the balance between different
cel-lular states? The dynamics of switching between cellular states can determine the
1.6
Contributions of This Thesis
The chapters in this thesis investigate the dynamics of cellular state decisions at two different levels and make several contributions to our understanding of this topic:
• Natural dynamics in ES cells. We created a platform for time-lapse imaging of ES
cells and reported novel observations of single-cell gene expression dynamics in these cells. Combining our data from movies and single molecule mRNA fluorescencein situ
hybridization (smFISH) revealed that these dynamics are the result of two processes: rare, abrupt transitions between two main cellular states, and frequent transcriptional bursts within each of these states. These results demonstrated unequivocally the existence of two broadly correlating cellular states in ES culture, even in wild-type cells, and transitions between them. Moreover, our platform enabled us to further investigate how signaling pathway perturbation alters pluripotency by modulating both the timescale of transcriptional bursts and the rates of transitions between the states, tipping the balance of the system in favor of a more pluripotent state. Finally, we presented evidence that DNA methylation is critically involved in maintaining bistability in the system.
• Dynamics of chromatin regulation in a synthetic system. We generated a
Chapter 2
Dynamic Heterogeneity and DNA
Methylation in Embryonic Stem
Cells
(This chapter was adapted, in part, from [100])
2.1
Abstract
dy-namics arise from a combination of intrinsic noise, coherent cellular states and epigenetic regulation.
2.2
Introduction
Many cell populations appear to consist of mixtures of cells in distinct cellular states. In fact, interconversion between states has been shown to underlie processes ranging from adult stem cell niche control [101, 102], to bacterial fitness [13], to cancer development [73]. A central challenge is to identify transcriptional states, along with the mechanisms that control their stability and generate transitions among them.
Single-cell transcriptional studies have revealed substantial gene expression heterogene-ity in stem cells [47, 56, 69, 71, 103]. Moreover, subpopulations expressing different levels of Nanog, Rex1, Dppa3, or Prdm14, show functional biases in their differentiation propensities [70, 74, 75, 104]. This heterogeneity could in principle arise from stochastic fluctuations, or ‘noise’, in gene expression [7, 105, 106]. Alternatively, it could reflect the coexistence of multiple cellular states, each with a distinct gene expression pattern showing correlation between a set of genes [56, 73, 107, 108]. Disentangling these two sources of variation is important for interpreting the transcriptional states of individual cells and understanding stem cell dynamics.
Gene 1 Gene 3
Gene 2
Gene 1 Gene 3
Gene 2
A
B
Gene X’s Promoter production rate Time
High state
Low state
High state
Low state Time
Gene X’s Promoter production rate
[image:40.612.153.494.77.322.2]Cell 1 Cell 2 Cell 3 Cell 4
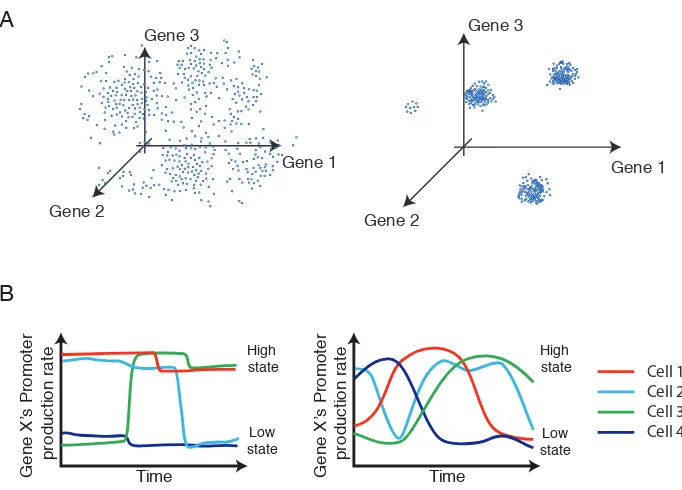
Figure 2.1: Different types of gene expression heterogeneity
(A) Intrinsic noise in gene expression can lead to uncorrelated variation (left), while the coexistence of distinct cellular states can produce correlated variability in gene expression (right). Both panels depict schematic static ‘snapshots’ of gene expression.
(B) Dynamically, gene expression levels could vary infrequently and abruptly (left) or more frequently and gradually (right) both within and between cellular states (schematic).
heterogeneity and induces a ‘na¨ıve’ pluripotent state [116, 117] with reduced methylation [118–120]. However, a causal role linking methylation, heterogeneity, and 2i remains to be elucidated.
Together, these observations provoke several fundamental questions: First, how do noise and states together determine the distribution of expression levels of individual regulatory genes (Figure 2.1A)? Second, how do gene expression levels vary dynamically in individual cells, both within a state and during transitions between states (Figure 2.1B)? Finally, how do cells stabilize metastable gene expression states, and what role does DNA methylation play in this process?
most variation in some genes, while others are dominated by stochastic bursts. Using time-lapse movies of individual cells, we observed abrupt, step-like dynamics due to cell state transitions and transcriptional bursts. Finally, using perturbations, we observed that DNA methylation modulates the population fraction of cells in the two states, consistent with reciprocal expression of the methyltransferase Dnmt3b and the hydroxymethylase Tet1. Together, these results suggest how noise, dynamics, and epigenetic regulatory mechanisms contribute to the overall distribution of gene expression states in stem cell populations.
2.3
Results
Mouse ESCs show three distinct types of gene expression distributions
The process of mRNA transcription is inherently stochastic. As a result, even a clonal cell population in a single state is expected to display variability in the copy number of each mRNA [9, 15, 40, 41, 121–125], potentially leading to phenotypic differences between otherwise identical cells [13, 44, 126–128].
In order to accurately measure mRNA copy numbers in large numbers of individual ESCs, we developed an automated platform for smFISH (Supp. Info.). This system enables rapid analysis of four genes per cell across ∼400 cells per sample (Figure A.1A-D). We validated the system by comparing three measures of expression of the same gene in the same cells using a Rex1-dGFP reporter line [129] (Figure A.1E).
within the framework of bursty transcriptional dynamics. In this model, mRNA production occurs in stochastic bursts that are brief compared to the mean inter-burst interval, and are exponentially distributed in size. Bursty dynamics produce negative binomial (NB) mRNA distributions [15, 130], whose shape is determined by the frequency and mean size of bursts. Genes exhibited three qualitatively distinct types of mRNA distributions. First, most genes were unimodal and well-fit by a single NB distribution (Figures 2.2B, A.2A, maximum-likelihood estimation (MLE), χ2 Goodness of Fit (GOF) test p>0.05). This class included Oct4, Rest, Tcf3, Smarcc1, Sall4, and Zfp281. Coefficients of variation (CV) were typically ∼0.5 for the most homogeneous genes (Figure 2.2A).
Second, a subset of unimodal genes exhibited long-tailed distributions, in which most cells had few, if any, transcripts, while a small number of cells displayed many transcripts. These distributions were also well fit by a single NB distribution, but with resulting distribu-tions that generally decreased monotonically with increasing mRNA concentration (Figures 2.2B, A.2A, χ2 GOF. p >0.05). The most heterogeneous long-tailed genes had burst fre-quencies of less than one burst per mRNA half-life. These included Tbx3 (CV=2.130.23, means.e.m.), Dppa3 (CV=1.760.31), and Prdm14 (CV=1.5990.20). Other long-tailed genes such as Pecam1, Klf4, Blimp1, Socs3, Nr0b1, and Fgfr2 had higher burst frequencies and less skew. Long-tailed genes arising from rare bursts could provide a source of stochastic variation that could propagate to downstream genes.
0 100 200 300 0 0.05 0.1 Transcript Count/Cell Population Fraction
0 20 40
0 0.5
15 20
0.02
* 00 200 400
0.05 0.1 Nanog A B C D Prdm14 p=0.15 p=0.32
0 20 40
0 0.1 0.2
Pecam p=0.95
0 100 200 300
0 0.1 0.2 Rex1 p=0.73 p<0.001 p=0.13
r=0.7 r= -0.46
r=0.20
0 20 40 60
0 0.05 Tcf3 p=0.24 p=0.44 Long-Tailed Bimodal Unimodal Oct4 r=0.7 Hi
Rex1Prdm14 Dppa3 Tbx3
Rex1
Prdm14Dnmt3b Tet1
Hi Lo Lo
Oct4
Trim28 Sall4 Cnot3 Carm1 Sdha Nacc1 Prmt5
Smarcc1
Rest Tbp Sox2 Dppa4 Tet1
Jmjd2c Zic3 gp130 Zfp281 Tcf3 Stat3
Lifr
Rex1 Esrrb Fgf4 Socs3 Nanog Fgfr2 Nr0b1
Dnmt3b Pecam1 Klf4 Tcl1
Blimp1 Dppa3 Prdm14 Tbx3
T
Zscan4c
[image:43.612.139.508.71.556.2]Normalized Transcript Count 1 0 CV 0 2 4 6 8 Rex1-Expression Low High Cell Count Low High
Figure 2.2: smFISH reveals gene expression heterogeneity and correlation
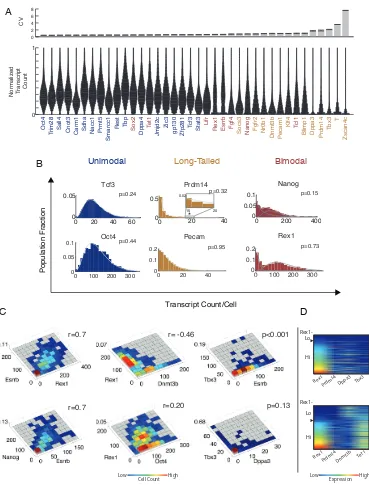
(A) Top: coefficients of variation (CV, meanSEM) for ESC-associated regulators and house-keeping genes. Bottom: Distributions (violin plots) normalized by maximum expression level reveal qualitatively distinct gene expression distributions. Genes are sorted by in-creasing CV.
(B) Smoothed histograms for mRNA distributions overlaid with NB fits. Solid lines show individual NB distributions. Dashed gray lines show their sum (for bimodal genes). * denotes 95th percentile for Prdm14. p-value: 2 goodness of fit test.
(C) Pairwise relationships between genes, analyzed by smFISH (r, Pearson correlation co-efficient; p-value by 2D K-S test (methods, Figure A.2A,B)).
and Esrrb), while in other cases they overlapped strongly (e.g. Nanog and Lifr), such that the absolute number of transcripts for a single gene did not accurately indicate to which state the cell belonged. These bimodal distributions suggested the existence of multiple cell states (see below).
Markers of most differentiated fates including Pax6 (neuroectoderm), Fgf5 (epiblast), Sox17 and FoxA2 (definitive endoderm), and Gata6 (primitive endoderm) showed no de-tectable expression (data not shown). However, the mesendodermal regulator Brachyury (T) was expressed at a level of ∼5-20 transcripts in 6% of Rex1-low cells. Similarly, the two-cell-like state marker Zscan4c [131] showed ∼3-60 transcripts in 3% of cells (Figure A.2A). These genes did not fit well to NB distributions, suggesting that processes other than transcriptional bursting impact their expression in this small fraction of cells.
Bimodal genes vary coherently
explain these correlations (Figure A.2C). Together, these data suggest that bimodal genes appear to be broadly co-regulated in two distinct states.
Long-tailed genes exhibited more complex relationships. Those with very large variation (CV>1.5) were correlated with the expression state of the bimodal gene cluster, but not with one another (Figures 2.2C & D, A.2B). For example, genes like Dppa3, Tbx3, and Prdm14 burst predominantly in the Rex1-high state, but even in this state, most cells showed no transcripts of these genes (p<0.001, see Supp. Info. for statistical analysis). Thus, it appears that these genes are expressed in infrequent, stochastic bursts that occur mainly in one of the two cellular states.
Interestingly, expression of Socs3, a negative regulator and direct target of Stat signaling [132], appeared conditional on expression of its bimodally expressed receptor Lifr (note ab-sence of Socs3 expression in low Lifr cells in Figure A.2B). Analysis of additional regulators not measured here could in principle reveal additional states or more complex distributions. Overall, however, the multi-dimensional mRNA distributions measured here are consistent with a simple picture based on two primary states and stochastic bursting.
The two primary states exhibit distinct DNA methylation profiles
that the Rex1-low state might exhibit increased methylation compared to the Rex1-high state.
To test this hypothesis, we sorted Rex1-high and -low cells using the Rex1-dGFP re-porter line, and performed locus-specific bisulfite sequencing at known targets of methy-lation Dazl, Mael, and Sycp3 [140] (Figures 2.3B, A.3A & B). These promoters exhibited 2-3 times greater methylation in Rex1-low cells compared to Rex1-high cells, indicating the two states are differentially methylated in at least some genes. In contrast, Rex1-low cells that subsequently reverted to the Rex1-high state recovered the methylation levels of Rex1-high cells, indicating that methylation is reversible. Similarly, quantitative enzyme-linked immunosorbent assay (ELISA) analysis demonstrated both differential methylation and reversibility in global methylation levels (Figure 2.3C).
0 0.2 0.4 0.6 0.8 1 0 0.05 0.1 0.15 0.2 0.25
0 0.2 0.4 0.6 0.8 1
0 0.05 0.1 0.15 0.2 0.25 0 0.5 1 1.5 2 2.5
Fold change in
%5mC of total CpG
Rex1-High Rex1-Low Rex1-Rev
A B C
D E 0 0.15 0.3 0 50 100 150 200 250 300
Fraction 0 50 100 0 50 100 150 200
r=0.66 r=−0.31
Rex1 Transcripts/Cell
Tet1 Transcripts/Cell Dnmt3b Transcripts/Cell Rex1- Rev
Rex1- Low Rex1- High 44% 85% 47% Dazl log2(CpG Count)
0 0.1 0.2 0.3 0.4 0.5 0.6 0.7 0.8 0.9 1
0 0.1 0.2 0.3 0.4 0.5 0.6 0.7 0.8 0.9 1
Rex1 High − Average Promoter Methylatio Average Promoter Methylation
Average Promoter Methylation
n
Rex1 Low − Average Promoter Methylatio
Fraction of Promoters
Fraction of Promoters
n β-actin Gapdh Esrrb Tcl1 Tet1 Dazl Mael Sycp3 2 3 4 5 6 7
0 0.5 1
0 0.5 1
Esrrb
0 0.5 1
0 0.5 1 Tet1 -2kb 500bp -2kb 500bp Re x1-L
ow Single C
pG M
eth.
Rex1-High Single CpG Meth. Rex1-High Methylation
Rex1-Low Methylation
[image:47.612.119.537.109.454.2]** *
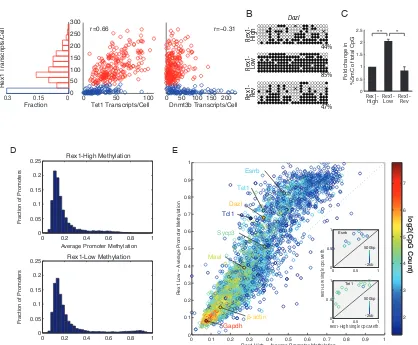
Figure 2.3: The two Rex1 states are differentially methylated
(A) smFISH measurements show Rex1 bimodality is correlated with Tet1, and anticorrelated with Dnmt3b expression.
(B) Locus-specific bisulfite sequencing of the Dazl promoter. Methylation levels shown are in the Rex1-high (top), Rex1-low (middle), and Rex1-low-to-high reverting (bottom) populations.
(C) Global levels of 5mC measured by quantitative ELISA in the Rex1-high, -low, and -low-to-high reverting cells.
(D) Histogram of promoter methylation shows bimodality in the Rex1-high (top) and -low (bottom) states, as quantified by RRBS.
that were, several key ES regulators including Esrrb, Tet1, and Tcl1 all showed increased levels of methylation in the Rex1 -low state. Figures 2.3E (inset) and A.3C show methyla-tion levels of individual CpGs for 17 gene promoters. These results provide a view of the change in promoter methylation that occurs during transitions between the Rex1-high and -low states.
Bursty transcription generates dynamic fluctuations in individual cells
Evidently, cells populate two transcriptional states, each characterized by distinct methy-lation profiles. To understand the dynamic changes in gene expression that occur as indi-vidual cells switch between these states, we turned to time-lapse microscopy. We analyzed transcriptional reporter cell lines for Nanog and Oct4, each containing a histone 2B (H2B)-tagged fluorophore expressed under the control of the corresponding promoter (Figure A.4A & B; see also Supp. Info.). We imaged the reporter cell lines for ∼50-hour periods with 15-minute intervals between frames, and segmented and tracked individual cells over time in the resulting image sequences. For each cell lineage, we quantified the instantaneous reporter production rate, defined as the rate of increase of total fluorescent protein in the cell, corrected for the partitioning of fluorescent protein into daughter cells during cell divi-sion (Supp. Info.). The H2B-fluorescent protein degradation rate is negligible under these conditions (Figure A.4C), enabling us to use the reporter production rate as a measure of in-stantaneous mRNA level. An advantage of this approach is that it provides relatively strong fluorescence signals per cell, but still enables high time resolution analysis [141]. Consistent with static smFISH distributions, the production rate distributions of the Nanog and Oct4 fluorescent reporters were bimodal and unimodal, respectively (Figure 2.4A).
Cell cycle phase
Normalized occurrence
0 0.2 0.4 0.6 0.8 1
0 10 20
Total reporter (a.u.) 0
5 10 102 103 Time (hours) Slope estimate
0 10 20 30
x103 010 2030 40 0 0.1 0.2 101 102 103 104 Fraction Production rat
e LineageTree # 0
5 1015 0 0.1 0.2 101 102 103 104 Fraction Production rat
e LineageTree #
Production rate
Fraction
101 102 103 104
0 0.05 0.1 0.15 Production rate Fraction
101 102 103 104
0 0.05 0.1 0.15 0.2 0.25
Oct4 intra-state A B C Oct4 Nanog-High 37% Nanog-Low 63% Oct4 Nanog-High Nanog-Low Nanog-High (simulated) Promoter Bursting off on 300 0 100 200 mRNA # mRNA 0 2 4 6 8 10 Time (hours)
Total protein (a.u.)
0 10 20 30
x 104
E Cell cycles Cell cycles Cell cycles Average mRNA level
Up/down steps in production rate D
Up-steps Down-steps
Stepping within the Nanog-High state
Total reporter (a.u.) 0
2 4
x 104
102
103
Time (hours)
Slope estimate
0 10 20 30
Nanog-High intra-state
G
Event rates (per 100 cell cycles) NLo
2.3 ± 0.25
7.9 ± 1.2 NHi Serum+LIF
F Nanog-Low to Nanog-High
Time (hours)
Total reporter (a.u.)
0 5 10 15 20 25
0 1 2 3
x 104
*
Nanog-High to Nanog-Low
Time (hours)
Total reporter (a.u.)
0 5 10 15 20 25
0 2 4
x 104
*
State-switching events *
Up/down steps in production rate
Cell
[image:49.612.118.536.130.640.2]division divisionCell
Figure 2.4: Movies reveal transcriptional bursting and state-switching dynamics in individual cells
(A) Distribution of Nanog and Oct4 production rates from representative movies in serum+LIF, and Gaussian fits to the components. Production rates were extracted from a total of 376 and 103 tracked cell cycles for Nanog and Oct4, respectively.
(B) Production rate distributions of individual cell lineage trees, each consisting of closely related cells descending from a single cell. Lineage trees are color-coded by the state they spend the majority of time in.
(C) Example single lineage traces exhibiting step-like changes in production rates within a state.
(D) Cell cycle phase distribution of steps within the Nanog-high state. Step occurrences are normalized by the frequencies of each cell cycle phase observed in the tracked data. (E) Representative trace showing apparent steps from simulations under the bursty tran-scription model, using parameters estimated from mRNA distribution for the Nanog-high state (see Supp. Info.; see Figure A.4E for simulation of Oct4 dynamics).
(F) Example traces of individual cells switching between Nanog-low and Nanog-high states. (G) Empirical transition rates (mean SD) between the two Nanog states (NHi, Nanog-high; NLo, Nanog-low).
multiple cell cycles (Figure 2.4B). During these periods, expression levels varied over the full range of Nanog expression levels within each state, with no evidence for persistent sub-states. However, closer examination revealed fluctuations within a single state, which typically occurred in discrete steps separated by periods of steady expression (Figure 2.4C). Using a computational step detection algorithm (Figure A.4D, Supp. Info.), we found that Nanog and Oct4 reporters exhibited 0.38 and 0.29 steps per cell cycle, respectively. These steps occurred in a cell cycle phase-dependent manner (Figure 2.4D), with down-steps clustered around cell division events and up-down-steps more broadly distributed across cell cycle phases.
determine the characteristics of detectable steps (Figure A.4F); in general, steps were most prominent at low burst frequencies and short mRNA half-lives, and became difficult to discriminate at high burst frequencies and long mRNA half-lives.
Step-like dynamics appear to be a natural consequence of stochastic expression, with up-steps reflecting burst-like production of mRNA, and down-steps resulting from ∼2-fold reduction in mRNA copy number at cell division (Figure A.4G). This interpretation is consistent with the observed clustering of down-steps around cell division events, and a more uniform cell cycle distribution of up-steps (Figure 2.4D). Because large bursts can effectively cancel out mRNA dilution at cell division events, they may appear under-represented near cell division events. Note that most cell cycles showed no up-steps, suggesting that they are not due to increased gene dosage after chromosome replication [142, 143].
Dynamic transitions between cellular states
We next asked how cells transition dynamically between states. Previous work has relied on cell sorting, which can distort the signaling environments. By contrast, movies enable direct observation of switching events within a mixed cell population. Since the Nanog reporter production rate fluctuates even within a single state, we used a Hidden Markov Model (HMM) to classify each cell into either Nanog-high or Nanog-low at every point in time (Supp. Info.). We trained the HMM using time-series data of Nanog reporter production rates, sampled at fixed intervals across all tracked cell cycles, and used it to identify switching events and estimate switching frequencies.
independent, stochastic events. Inter-state switching on average showed bigger and longer-lasting fold-changes than intra-state steps in production rates (Figure A.4H). Together, these results suggest that gene expression dynamics are dominated by a combination of step-like changes due to bursty transcription on shorter timescales, and abrupt, apparently stochastic, inter-state switching events on longer timescales.
‘2i’ inhibitors modulate bursty transcription and state-switching dynamics
We next asked how gene expression heterogeneity and dynamics change in response to key perturbations. Dual inhibition of MEK and GSK3, known as ‘2i’, was shown to enhance pluripotency and reduce Rex1 and Nanog heterogeneity [116, 129]. However, it has remained unclear how 2i affects the distribution of other heterogeneously expressed regulatory genes, and what impact it has on dynamic fluctuations in gene expression.
0 5 10 0 0.5 1 Time (hours) A( τ ), protein production rate
Event rate (per 100 cell cycles) 98 NSH NLo 2i+Serum+LIF Production rate Fraction
101 102 103 104
0 0.050.1 0.150.2 0.250.3 4% 96% Nanog-Low Nanog-SH 2i+Serum+LIF 0.01 0 A E G 0 1 2 3 0 0.5 1 Normalized Transcript Count Relative CV
Dppa3 Tet1 Oct4 Tcl1 Dnmt3b
Lifr
Sox2
Blimp1 Nr0b1 Esrrb Nanog Rex1 Prdm14 Pecam1 Klf4 Tbx3
Serum+LIF 2i+Serum+LIF UnimodalBimodal Long-Tailed +2i DMSO 5-Aza 2d 5-Aza 4d 5-Aza 6d
102 103 104
Rex1−dGFP 0 0.005 0.01 0.015 0.02 Fr ac tion
102 103 104
0 0.005 0.01 0.015 0.02
102 103 104 102 103 104
Fr
ac
tion
Rex1−dGFP
2 days 4 days 6 days
2i 2i to DMSO 2i to 5-Aza
B C D
0 50 100
SDHA
0 500
Nanog
Transcript Count
0 100 200
Esrrb
0 500 1000
[image:53.612.126.511.132.647.2]Rex1 TKO WT Fr ac tion F
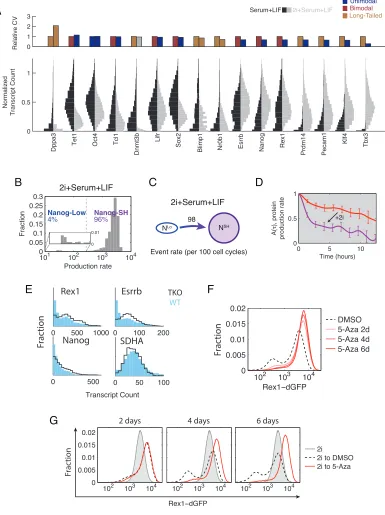
Figure 2.5: 2i and DNA methylation modulate bursty transcription and state-switching dynamics
(A) Comparison of mRNA distributions and CV between cells grown in serum+LIF and 2i+serum+LIF. Top: For each gene, the CV in serum+LIF is plotted on the left, and the CV for 2i+serum+LIF is plotted on the right. Dnmt3b in 2i+serum+LIF is represented in gray to reflect its marginal case of poor quality of fit in both bimodal and long-tailed models. Bottom: The left half of each violin represents the mRNA distribution in serum+LIF, while the right represents 2i+serum+LIF. For each gene, both conditions are normalized by the same value that is the larger of the pair’s 95th percentile expression level.
(B) Distribution of Nanog production rates from movies in 2i+serum+LIF.
(C) Empirical transition rates between the two Nanog states in the presence of 2i (NLo, Nanog-low; NSH, Nanog-SH).
(D) Mixing time in each condition is estimated from auto-correlation, A(τ), of production rate ranks shown in Figure A.5D, right panels. Red: serum+LIF; Purple: 2i+serum+LIF; Error bars: standard deviation, bootstrap method.
(E) Comparison of transcriptional heterogeneity between Dnmt TKO (black line) and the parental line (blue bars) as measured by smFISH for Rex1, Nanog, Esrrb, and SDHA. Note that for Rex1/Nanog/Essrb, there are fewer off cells in the leftmost bins for the TKO than WT.
(F) Rex1-dGFP distribution as measured by flow cytometry grown in serum+LIF with 5-aza or DMSO (carrier control). Time-points were taken after 2, 4, and 6 days.
(G) Cells were grown in 2i+serum+LIF, and subsequently re-plated into serum+LIF with 5-aza or DMSO (carrier control). Time-points were taken after 2, 4, and 6 days. GFP levels were measured by flow-cytometry.
in-creases the Nanog-low to Nanog-high switching rate and reduces or eliminates Nanog-high to Nanog-low transitions (Figure 2.5C).
What effect, if any, does 2i have on the dynamics of gene expression noise? Static dis-tributions suggested that 2i increased Nanog burst frequency by ∼45%, from 0.39 to 0.55 burst/hour, using Nanog mRNA half-life previously estimated (Table A.11 in [144]) and as-suming no change between conditions. To analyze the effects on dynamics, we computed the mixing time, previously introduced to quantify the mean timescale over which a cell main-tains a given expression level relative to the rest of the cell population [8]. Simulations of the bursty gene expression model showed that higher burst frequencies lead to faster mixing times, while burst size has little effect (Figure A.5C). Together with smFISH measurements, this model predicted that Nanog mixing times should be faster in 2i. Qualitatively consis-tent with this prediction, the mixing time of Nanog production rate was reduced from 8.5 hours in Nanog-high in serum+LIF media to 1.7 in Nanog-SH cells in 2i-containing media (Figures 2.5D, A.5D).
Together, these results indicate that 2i impacts ESC heterogeneity at three levels: First, it reduces gene expression variation in many, but not all, genes. Second, it eliminates one cell state by increasing the rate of transitions out of the Nanog-low state and inhibiting the reverse transition. Third, as shown for Nanog, 2i increases burst frequency and re-duces mixing times, effectively speeding up the intra-state equilibration rate within the cell population.
DNA methylation modulates metastability
appear differentially methylated (Figures 2.3B-E), it remains unclear whether methylation plays a functional role in stabilizing these states. To address this issue, we used a triple-knockout (TKO) cell line lacking the active DNA methyltransferases Dnmt1, Dnmt3A, and Dnmt3B [145]. We compared the expression distribution of Rex1, Nanog, and Esrrb in TKO cells to their parental line using smFISH. The TKO cell lines had 352% fewer cells in the Rex1-low state (Figure 2.5E), with similar results observed for Nanog and Esrrb. This change did not reflect global up-regulation of all genes, as expression of the houskeeping gene SDHA was indistinguishable between the two cell lines. These results suggest that DNA methyltransferases increase the population of the Rex1-low state.
To see if these results could be recapitulated with acute rather than chronic pertur-bations to methylation, we assayed changes in heterogeneity in Rex1-dGFP reporter cells exposed to 70nM 5-azacytidine (5-aza), an inhibitor of DNA methylation. Within six days, the number of cells in the Rex1-low state diminished by more than half from 29% to 13% of all cells (Figure 2.5F). Thus, acute as well as chronic methylation inhibition reduced the occupancy of the low state.
2.4
Discussion
Recent work on ESC biology from a systems perspective has highlighted the apparent complexity and strong interconnectivity of the circuit governing pluripotency [146, 147]. But it has been unclear how variably this circuit behaves in different cells, and to what extent population average measurement techniques may obscure its single-cell dynamics. Because gene expression is a stochastic process, levels of both mRNA and protein in each cell are effectively random variables, best characterized by their distributions. The framework of stochastic gene expression provides a tool to more rigorously and quantitatively separate stochastic fluctuations inherent to gene expression from variation due to multiple cell states specified by the underlying transcriptional and signaling circuit. While the simplified model of bursty transcription used here can explain the data, other models, including the telegraph model of transcription, may provide other insights [123, 148].
investiga-tion of this possibility will require determining whether these bursts propagate to influence subsequent cell fate decision-making events [149, 150].
The data above implicate methylation as a key regulatory mechanism affecting stochastic switching between states. Methylation was previously explored in ES cells at the population level [114, 115, 119, 120, 133, 134], but it remained unclear whether methylation itself contributes to heterogeneity [69, 74, 75, 104]. smFISH data revealed a strong reciprocal relationship between the hydroxymethylase Tet1 and the DNA methyltransferase Dnmt3b, with Tet1 expressed more highly in the Rex1-high state, and Dnmt3b expressed more highly in the Rex1-low state. This difference in expression correlates with a differential global DNA methylation and in the methylation of the promoters of key pluripotency regulators. Finally, methylation appears to be functionally required for transitions, since either genetic deletion of DNA methyltransferases or pharmacological inhibition both impact the populations of the two cell states and the underlying dynamics of state-switching (Figure 2.5E-G). It will be interesting to see whether methylation plays similar functional roles in other stochastic state-switching systems.
[104, 118–120, 137, 138]. Given the long-tailed expression pattern of Prdm14 observed here in serum+LIF and its strong up-regulation in 2i, it will be interesting to see how much of the variation in Dnmt3b/Tet1, and methylation more generally, can be attributed to bursty expression of Prdm14.
Nanog is consistent with bursty transcription, with a relatively low burst frequency of ∼0.39 burst/hour. Thus, active transcriptional loci analyzed by smFISH against nascent transcripts [158] would be expected to ‘flicker’ on and off stochastically due to bursting. Such bursting could also lead to the misleading appearance of weak correlations between alleles in static snapshots, and in measurements based on destabilized fluorescent reporters. On the other hand, the Nanog protein fusion reporters analyzed by [159] showed correlated static levels between alleles, likely because the longer lifetime of their reporters allowed integration of signal over many transcriptional bursts, and because transitions between cellular states are rare and affect both alleles in a correlated fashion. The results of Faddah et al. with dual transcriptional reporters similarly showed general correlations between the two alleles, consistent with the smFISH correlations shown here (Figures A.1E, A.4B). Taken together, these previous studies and the data presented here appear to converge on a relatively simple picture of heterogeneity based on two states and stochastic bursting.
2.5
Materials and Methods
Culture conditions and cell lines
E14 cells (E14Tg2a.4) obtained from Mutant Mouse Regional Resource Centers were used for smFISH studies. NKICit cells, created by Kathrin Plath, were generated by target-ing the endogenous Nanog locus in V6.5 cells with H2B-Citrine-IRES-Neo-SV40pA (Fig-ure A.4A). NKICit+Cer cells were generated by randomly integrating into NKICit cells a linearized PGK-H2B-Cerulean-BGHpA-SV40-Hygro-SV40pA vector. OBACCer cells were generated by randomly integrating into E14 cells (a kind gift from Bill Skarnes and Peri Tate) a linearized bacterial artificial chromosome (BAC) containing the Oct4 locus (BAC-PAC (CHORI)), in which H2B-Cerulean-SV40pA-PGK-Neo-BGHpA was inserted before the coding sequence (Figure A.4A). Rex1-dGFP cells were kindly provided by the Austin Smith lab [117]. All cells were maintained on gelatin-coated dishes without feeders.
smFISH hybridization, imaging, and analysis
mRNA distribution fitting
The Negative Binomial Distribution is defined as
P(n, r, po) =
n+r−1
n
pr0(1−po)n,
where n=number of transcripts per cell,p0= probability of transition from the on promoter
state to the off promoter state, and r = number of bursting events per mRNA half-life. The average burst size is computed as b = (1 −p0)/p0. Using this model, individual
mRNA distributions were fit using maximum likelihood estimation. To discriminate between unimodal and bimodal fits, two tests were used to ensure that the improvement of the fit was counterbalanced by the additional degrees of freedom from the added parameters. To be considered bimodal, a distribution was required to pass both Akaike Information Criteria (AIC) and the log-likelihood ratio test (p<0.05).
Fluorescence time-lapse microscopy and data analysis
Reporter cells were mixed with unlabeled parental cells at 1:9 ratio and plated at a total density of 20,000 cells/cm2 on glass-bottom plates (MatTek) coated with human laminin-511 (BioLamina) >12 hours before imaging. Images were acquired every 15 minutes for ∼50 hours with daily medium change. Cells were segmented and tracked from the acquired images using our own Matlab code (see supplementary for image analysis methods).
2i perturbation and analysis
with 2i for 6 days before harvesting for smFISH assay and imaging for movies.
Methylation analysis and perturbation
RRBS preparation and high-throughput sequencing were performed by Zymo Research. Analysis was performed using Bismark and Galaxy, with a single CpG coverage threshold 5. 5-azacytidine (Sigma) was used at a final concentration of 70nM. 5mC ELISA was performed with ELISA 5mC kit (Zymo).
Accession information