R E S E A R C H
Open Access
Sympatric prey responses to lethal top-predator
control: predator manipulation experiments
Benjamin L Allen
1,2*, Lee R Allen
2, Richard M Engeman
3and Luke K-P Leung
1Abstract
Introduction:Many prey species around the world are suffering declines due to a variety of interacting causes such as land use change, climate change, invasive species and novel disease. Recent studies on the ecological roles of top-predators have suggested that lethal top-predator control by humans (typically undertaken to protect livestock or managed game from predation) is an indirect additional cause of prey declines through trophic cascade effects. Such studies have prompted calls to prohibit lethal top-predator control with the expectation that doing so will result in widespread benefits for biodiversity at all trophic levels. However, applied experiments investigatingin situresponses of prey populations to contemporary top-predator management practices are few and none have previously been conducted on the eclectic suite of native and exotic mammalian, reptilian, avian and amphibian predator and prey taxa we simultaneously assess. We conducted a series of landscape-scale, multi-year, manipulative experiments at nine sites spanning five ecosystem types across the Australian continental rangelands to investigate the responses of sympatric prey populations to contemporary poison-baiting programs intended to control top-predators (dingoes) for livestock protection.
Results:Prey populations were almost always in similar or greater abundances in baited areas. Short-term prey responses to baiting were seldom apparent. Longer-term prey population trends fluctuated independently of baiting for every prey species at all sites, and divergence or convergence of prey population trends occurred rarely. Top-predator population trends fluctuated independently of baiting in all cases, and never did diverge or converge. Mesopredator population trends likewise fluctuated independently of baiting in almost all cases, but did diverge or converge in a few instances.
Conclusions:These results demonstrate that Australian populations of prey fauna at lower trophic levels are typically unaffected by top-predator control because top-predator populations are not substantially affected by contemporary control practices, thus averting a trophic cascade. We conclude that alteration of current top-predator management practices is probably unnecessary for enhancing fauna recovery in the Australian rangelands. More generally, our results suggest that theoretical and observational studies advancing the idea that lethal control of top-predators induces trophic cascades may not be as universal as previously supposed.
Keywords:Canis lupus dingo, Carnivore conservation, Fauna recovery planning, Ground-dwelling birds, Kangaroo, Poison baiting, Small mammals, Threatened species
* Correspondence:[email protected] 1
School of Agriculture and Food Sciences, The University of Queensland, Warrego Highway, Gatton, QLD 4343, Australia
2
Robert Wicks Pest Animal Research Centre, Biosecurity Queensland, Tor Street, Toowoomba, QLD 4350, Australia
Full list of author information is available at the end of the article
Introduction
Many prey species around the world are threatened or suffering declines in many parts of their ranges due to a variety of interacting biotic, abiotic and anthropogenic causes such as land use change, climatic change, invasive species and novel disease [1-3]. Unbalanced ecosystems with disproportionately high densities of some fauna (e.g. herbivores and mid-sized or mesopredators) can exacer-bate the rate of species declines in some cases [4,5]. Apex or top-predators such as lions (Panthera leo), bears (Ursus spp.) or grey wolves (Canis lupus) are expected to stabilise or recalibrate ecosystems by reducing populations of such overabundant species and allowing threatened prey at lower trophic levels to recover [6-8]. Moreover, many top-predators are themselves threatened, in decline or pres-ently absent from large portions of their former ranges, and for this reason alone are worthy of conservation and restoration [9]. Great interest surrounds the recov-ery and potential use of top-predators as ‘natural’ and low-cost biodiversity conservation tools [10,11]. Conse-quently, predator management strategies known or per-ceived to have negative effects on top-predator populations are expected by some to produce outcomes ultimately det-rimental to prey species and even vegetation communities at lower trophic levels [12,13]. Humans are not detached from these processes given their (often unacknowledged) role as the ultimate‘top-predator’ or manipulator of spe-cies and ecosystems [14-18].
Though the important role that terrestrial top-predators can sometimes play in structuring food webs and ecosys-tems through their consumptive (e.g. predation) and non-consumptive (e.g. fear, competition) effects on sympatric mesopredator and herbivore species is well known [7-9], top-predators are often lethally controlled to protect livestock, managed game and some threatened fauna from top-predator predation (e.g. [19-22]). Lethal con-trol of top-predators is typically achieved through trap-ping, shooting and/or poisoning in different parts of the world. Lethal control of rare or threatened top-predators is often unacceptable in many cases (e.g. [23]), and knowledge of or expectations about the eco-logical roles of top-predators is often used to justify calls to cease lethal control of these threatened top-predators (e.g. [8,24]). But not all top-top-predators are rare or in decline. In places where top-predator populations are very common, robust and resilient to control (such as Australia), their strategic lethal control (or periodic, tem-porary suppression) might facilitate profitable livestock or game production while retaining their important func-tional roles in limiting, suppressing or regulating over-abundant species [25].
Introduced to Australia about 5,000 years ago, dingoes (Canis lupus dingo and hybrids) are a relatively small (typically 12–17 kg) but now common and widespread
canid top-predator, extant across ~85% of the contin-ent [26,27]. However, some specific dingo genotypes are in decline and worthy of conservation [28-30]. Genetic issues aside, dingoes’distribution and densities are naturally increasing (back into the few remaining areas, <15% of Australia, where they were formerly ex-terminated) despite often being subject to periodic le-thal control programs for the protection of livestock and some threatened fauna [19,27,31]. Faunal biodiver-sity conservation is expected by some to be compro-mised by lethal dingo control through its perceived indirect positive effects on mesopredators and their cascading negative effects on prey (e.g. [32-34]). Snap-shot, observational, correlative or desktop studies have sometimes reported negative relationships between dingoes and mesopredators or positive relationships between dingoes and some threatened fauna (reviewed in [35,36]). In contrast, long-term and/or experimental studies on the subject have consistently reported that mesopredator populations fluctuate independent of dingoes and dingo control over time ([25,37-39]; see also [40]). Investigation of predator–prey relationships have been a pillar of ecological studies for decades [41], but applied-science studies investigating the in-directin situresponses of prey populations to contem-porary top-predator management practices are few [12,18,22,42,43].
mammalian, avian, reptilian and amphibian prey popu-lations were influenced by contemporary poison-baiting programs aimed at controlling dingoes (R6 in Figure 1). Comparisons were made between a series of paired poison-baited and unbaited areas monitored over time both before and after multiple baiting events using pas-sive tracking indices (PTI; see Methods for details of study sites and design, prey population monitoring tech-niques and analytical approaches). These experiments were conducted at nine sites spanning the breadth of the beef-cattle rangelands of Australia, comprising one of the largest geographic scale predator manipulation experiments con-ducted on any species anywhere in the world [43].
Results
Step 1–Overall patterns in prey abundance
Linear mixed model analyses revealed a significant inter-action between baiting history (i.e. consistent history, historically baited in both treatments before cessation of baiting in the unbaited area, or historically unbaited in both treatments before baiting commenced in the baited area) and treatment (baited or unbaited) for dingoes, but not for any other predator or prey species (Table 1). This is unsurprising given that baiting programs target dingoes, and as expected, baiting history and treatment were similarly significant as univariate factors influen-cing dingo PTI (Table 1). Overall mean and median macropod PTI was also different between different bait-ing histories, but not between baited and unbaited treatment areas. No other predator or prey species or species group showed an interaction, nor did any show a difference in PTI between baited and unbaited areas using this approach (Table 1). However, results from this analysis may obscure true prey responses to baiting given the unique combination of experimental design, sampling effort, land system, treatment size, baiting history, baiting context, baiting frequency, fauna assem-blage, rainfall conditions and climate trend effects potentially influencing observed fauna responses to baiting at each site. Thus, results for individual ‘site x species’responses to top-predator control are described
hereafter to explicitly identify any species- and site-specific responses to baiting.
Repeated measures ANOVA yielded no indication that PTI values for prey were consistently lower in areas ex-posed to periodic poison-baiting for dingoes (Table 2). Demonstrable differences in PTI between treatments were found in only 20 of the 67‘site x prey species’ com-binations with sufficient data; in only 11 of these (16% of all cases) was prey PTI lower in baited areas. These 11 cases occurred at different sites for a range of mammals and birds (Table 2). Stratifying the data by season like-wise indicated no consistently lower prey PTI values in baited areas (Table 3). Demonstrable differences in PTI between treatments were found in only 29 of the 193
‘site x season x prey species’combinations with sufficient data; in only 13 of these (7% of all cases) was prey PTI lower in baited areas. These 13 cases occurred in all sea-sons except summer, for birds, reptiles and mammals at some sites (Table 3).
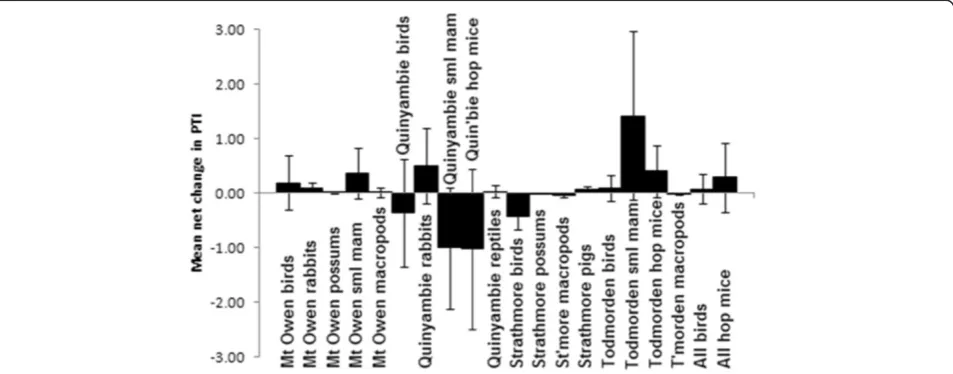
Step 2–Short-term behavioural responses of prey A total of 25 baiting events from all sites included post-baiting surveys conducted within four months of post-baiting from both treatments (mean number of days since bait-ing = 51). Assessbait-ing changes in prey PTI between sur-veys conducted just prior and subsequent to baiting showed little indication of short-term responses of prey at Mt Owen (N = 8 events), Quinyambie (N = 4 events), Strathmore (N = 5 events) or Todmorden (N = 5 events) (Figure 2). An insufficient number of pre- and post-baiting pairs were available to reliably run this analysis for the other sites. Using this approach, demonstrable changes were only found for birds at Strathmore, where PTI values were lower subsequent to baiting (Figure 2).
Step 3–Longer-term prey abundance trends
[image:3.595.57.540.89.193.2]demonstrably negative correlations were observed. For example, birds were positively correlated between treat-ments at all sites except Quinyambie and Cordillo. Small mammals were positively correlated between treatments at all sites except Strathmore. Macropods were positively correlated between treatments at Barcaldine, Blackall, Lambina, Mt Owen and Strathmore, but not Cordillo,
Quinyambie, Tambo or Todmorden. No demonstrable correlations between treatments were found for echidnas (Tachyglossus aculeatus) at any site. Of the 33 demon-strable and positive correlations observed, 25 (or 76% of cases) showed r values exceeding 0.75, indicating that the positive correlations observed were typically very strong (Table 4). For example, r approached 1.0 and p = <0.001 in most correlations for hopping-mice (Notomys spp.) and other small mammals.
Divergence or convergence of PTI trends was assess-able for 65 ‘site x prey species’combinations. Of these, six suggested a demonstrable increase in PTI in baited areas over time, and only three (birds at Quinyambie, and possums at Mt Owen and Strathmore; <5% of all cases) suggested a demonstrable decrease in baited areas over time (Figures 3, 4, 5, 6, 7, 8, 9, 10, 11, 12, 13, 14, 15, 16, 17, 18, 19, 20). No demonstrable changes in PTI differences over time were detected for all other ‘site x prey species’combinations. These data demonstrate that longer-term prey PTI trends were typically unaffected by dingo control, instead fluctuating synchronously in bai-ted and unbaibai-ted areas over time (Figures 3, 4, 5, 6, 7, 8, 9, 10, 11, 12, 13, 14, 15, 16, 17, 18, 19, 20).
Predator responses to baiting
[image:4.595.56.291.189.594.2]We previously showed that mesopredator suppression by dingoes was not apparent given that European fox (Vulpes vulpes), feral cat (Felis catus) and goanna ( Vara-nus spp.) trends were not negatively correlated with dingoes over time [25]. However, correlations in longer-term predator PTI trends between baited and unbaited areas were determined here for 33 possible‘site x preda-tor species’combinations (Table 5; see also Figure Two in [25]). Of these correlations, nine were demonstrably positive (27% of all cases) and the remainder were all in-distinguishable from zero. No negative correlations be-tween treatments were detected for any predator at any site (Table 5). The nine demonstrably positive correla-tions were detected for dingoes, foxes, cats and goannas at different sites (Table 5). Divergence or convergence of predator PTI trends was also assessed here for 35‘site x predator species’combinations. Of these, cat PTI appar-ently increased in baited areas at Tambo and Todmor-den yet decreased in baited areas at Quinyambie, and fox PTI apparently decreased in baited areas at Todmor-den (Figures 12, 13, 14, 15, 16, 17, 18, 19, 20). However, each of these four outcomes seem artificial given that very few cats or foxes were ever observed at these sites (Table 6 and Figure Two in [25]). Regardless, divergence or convergence of trends was not detected for dingoes (or goannas) at any site (Figures 12, 13, 14, 15, 16, 17, 18, 19, 20), demonstrating that (1) dingo PTI trends were unaffected by dingo control over time and (2) ob-served convergence or divergence of mesopredator PTI
Table 1 P values obtained from linear mixed model analyses investigating the effects of baiting history (consistent, historically baited in both treatments before cessation of baiting in the unbaited area, or historically unbaited in both treatments before commencement of baiting in the baited area), treatment (baited or
unbaited) and their interaction on overall mean (Mn) and overall median (Med) predator and prey PTI at nine sites across Australia
Source Baiting history (H) Treatment (T) T*H
Dingoes~ Mn 0.0242 0.0001 0.0004
Med 0.0283 0.0001 0.0001
Foxes~ Mn 0.1200 0.1200 0.1400
Med 0.1000 0.2100 0.1700
Cats~ Mn 0.9500 1.0000 0.1800
Med 0.8000 0.6100 0.3600
Goannas~ Mn 0.8500 1.0000 0.1800
Med 0.7400 0.6100 0.9300
Birds~ Mn 0.5200 0.4400 0.2800
Med 0.5300 0.6700 0.1200
Rabbits~ Mn 0.1900 0.5800 0.0481
Med 0.1800 0.7600 0.3000
Possums~ Mn 0.4600 0.3800 0.4100
Med 0.4500 0.3600 0.4200
Small mammals~ Mn 0.3100 0.4100 0.6600
Med 0.3900 0.3200 0.7700
Macropods~ Mn 0.0185 0.9100 0.1300
Med 0.0336 0.7000 0.2100
Pigs~ Mn 0.5000 0.4700 0.3600
Med 0.4400 0.4300 0.3800
Echidnas~ Mn 0.1300 0.3600 0.4200
Med 0.4200 0.3600 0.4200
Frogs~ Mn 0.5100 0.5700 0.2700
Med 0.4200 0.3600 0.4200
Hopping-mice Mn* 0.4400 0.5100 0.5000
Med* 0.4200 0.4600 0.5100
Reptiles Mn^ 0.5400 0.4700 0.2900
Med* 0.8800 0.7000 0.1700
trends in these four cases could not be related to changes in dingo PTI trends.
Discussion
Evidence for top-predator control-induced decline of prey fauna
Our results provide demonstrable experimental evidence that the prey populations we monitored are very rarely affected negatively by contemporary dingo control prac-tices in the beef cattle rangelands of Australia. Baiting history was important only to macropods (Table 1). Overall mean prey PTI was seldom lower in baited areas than in paired unbaited areas (Tables 2 and 3). Short-term declines in prey PTI in baited areas (relative to unbaited areas) also occurred rarely (Figure 2). Longer-term prey PTI trends fluctuated similarly in baited and unbaited areas in each case (Table 4, Figures 3, 4, 5, 6, 7, 8, 9, 10, 11). Divergence or convergence of prey PTI trends was seldom observed (Figures 12, 13, 14, 15, 16, 17, 18, 19, 20). These non-effects of baiting were consist-ent across sites and site histories, environmconsist-ental con-texts, and across assemblages of different ground-dwelling exotic or native and small or large mammalian, avian, reptilian and amphibian prey assessed. Indeed, the few ‘significant’ differences observed in Steps 1, 2 or 3 of our analyses occurred infrequently and sporadically enough across sites and taxa that they may well have oc-curred simply by chance. If contemporary dingo control practices truly had detrimental effects on prey abundances,
through either numerical and/or functional changes in predator populations, then: (1) prey PTI should have been lower in baited areas and/or (2) should have declined im-mediately after baiting and/or (3) should have been nega-tively correlated between baited and unbaited areas and/or (4) should have shown evidence of decreasing PTI trends in baited areas over time. Rarely did any of these occur for any prey species at any site, and never did our results of Step 3 show evidence of baiting-induced PTI decline for any threatened prey species or species group, such as hopping-mice or other small mammals (Figures 3, 4, 5, 6, 7, 8, 9, 10, 11, 12, 13, 14, 15, 16, 17, 18, 19, 20).
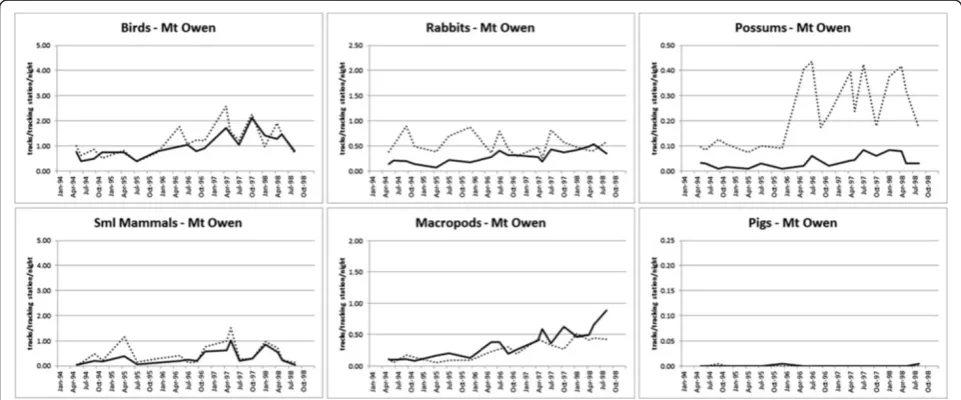
[image:5.595.59.539.112.328.2]Perhaps our best evidence of baiting-induced changes in prey populations comes from Mt Owen, where a unique combination of baiting history, baiting context, land system, mammal assemblage, rainfall and climate trend suggested that some prey species were affected by dingo control in that given context. Our experiment began at Mt Owen during a period of drought and con-tinued through a period of repeated above-average sea-sonal conditions when several predator and prey species showed evidence of somewhat linear and bottom-up driven PTI increases in response to rainfall (compare Figures 7, 16 and 21 and Figure Two in [25]). This het-erogeneous and structurally complex dry woodland site also supported a relatively high diversity of mammalian prey species of various sizes, including several macropod species [47-49]. The relative abundance of dingoes, cats and goannas increased in both baited and unbaited areas
Table 2 P values obtained from repeated measures ANOVA assessing differences in overall mean prey PTI (all surveys pooled) between baited and unbaited areas at nine sites across Australia (see Table 3 for seasonal breakdown)
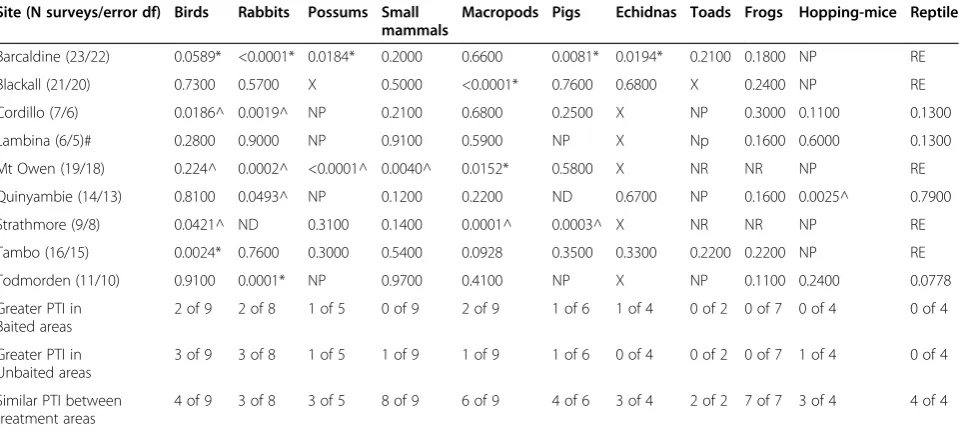
Site (N surveys/error df) Birds Rabbits Possums Small mammals
Macropods Pigs Echidnas Toads Frogs Hopping-mice Reptile
Barcaldine (23/22) 0.0589* <0.0001* 0.0184* 0.2000 0.6600 0.0081* 0.0194* 0.2100 0.1800 NP RE
Blackall (21/20) 0.7300 0.5700 X 0.5000 <0.0001* 0.7600 0.6800 X 0.2400 NP RE
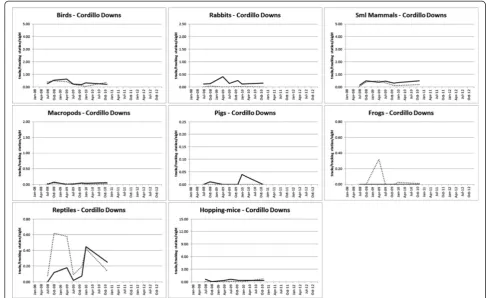
Cordillo (7/6) 0.0186^ 0.0019^ NP 0.2100 0.6800 0.2500 X NP 0.3000 0.1100 0.1300
Lambina (6/5)# 0.2800 0.9000 NP 0.9100 0.5900 NP X Np 0.1600 0.6000 0.1300
Mt Owen (19/18) 0.224^ 0.0002^ <0.0001^ 0.0040^ 0.0152* 0.5800 X NR NR NP RE
Quinyambie (14/13) 0.8100 0.0493^ NP 0.1200 0.2200 ND 0.6700 NP 0.1600 0.0025^ 0.7900
Strathmore (9/8) 0.0421^ ND 0.3100 0.1400 0.0001^ 0.0003^ X NR NR NP RE
Tambo (16/15) 0.0024* 0.7600 0.3000 0.5400 0.0928 0.3500 0.3300 0.2200 0.2200 NP RE
Todmorden (11/10) 0.9100 0.0001* NP 0.9700 0.4100 NP X NP 0.1100 0.2400 0.0778
Greater PTI in Baited areas
2 of 9 2 of 8 1 of 5 0 of 9 2 of 9 1 of 6 1 of 4 0 of 2 0 of 7 0 of 4 0 of 4
Greater PTI in Unbaited areas
3 of 9 3 of 8 1 of 5 1 of 9 1 of 9 1 of 6 0 of 4 0 of 2 0 of 7 1 of 4 0 of 4
Similar PTI between treatment areas
4 of 9 3 of 8 3 of 5 8 of 9 6 of 9 4 of 6 3 of 4 2 of 2 7 of 7 3 of 4 4 of 4
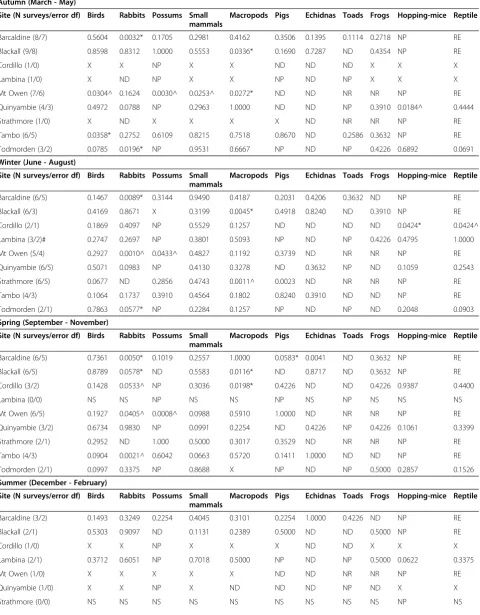
Table 3 P values obtained from repeated measures ANOVA assessing seasonal differences in mean prey PTI (surveys pooled by season) between baited and unbaited areas at nine sites across Australia
Autumn (March - May)
Site (N surveys/error df) Birds Rabbits Possums Small mammals
Macropods Pigs Echidnas Toads Frogs Hopping-mice Reptile
Barcaldine (8/7) 0.5604 0.0032* 0.1705 0.2981 0.4162 0.3506 0.1395 0.1114 0.2718 NP RE
Blackall (9/8) 0.8598 0.8312 1.0000 0.5553 0.0336* 0.1690 0.7287 ND 0.4354 NP RE
Cordillo (1/0) X X NP X X ND ND ND X X X
Lambina (1/0) X ND NP X X NP ND NP X X X
Mt Owen (7/6) 0.0304^ 0.1624 0.0030^ 0.0253^ 0.0272* ND ND NR NR NP RE
Quinyambie (4/3) 0.4972 0.0788 NP 0.2963 1.0000 ND ND NP 0.3910 0.0184^ 0.4444
Strathmore (1/0) X ND X X X X ND NR NR NP RE
Tambo (6/5) 0.0358* 0.2752 0.6109 0.8215 0.7518 0.8670 ND 0.2586 0.3632 NP RE
Todmorden (3/2) 0.0785 0.0196* NP 0.9531 0.6667 NP ND NP 0.4226 0.6892 0.0691
Winter (June - August)
Site (N surveys/error df) Birds Rabbits Possums Small mammals
Macropods Pigs Echidnas Toads Frogs Hopping-mice Reptile
Barcaldine (6/5) 0.1467 0.0089* 0.3144 0.9490 0.4187 0.2031 0.4206 0.3632 ND NP RE
Blackall (6/3) 0.4169 0.8671 X 0.3199 0.0045* 0.4918 0.8240 ND 0.3910 NP RE
Cordillo (2/1) 0.1869 0.4097 NP 0.5529 0.1257 ND ND ND ND 0.0424* 0.0424^
Lambina (3/2)# 0.2747 0.2697 NP 0.3801 0.5093 NP ND NP 0.4226 0.4795 1.0000
Mt Owen (5/4) 0.2927 0.0010^ 0.0433^ 0.4827 0.1192 0.3739 ND NR NR NP RE
Quinyambie (6/5) 0.5071 0.0983 NP 0.4130 0.3278 ND 0.3632 NP ND 0.1059 0.2543
Strathmore (6/5) 0.0677 ND 0.2856 0.4743 0.0011^ 0.0023 ND NR NR NP RE
Tambo (4/3) 0.1064 0.1737 0.3910 0.4564 0.1802 0.8240 0.3910 ND ND NP RE
Todmorden (2/1) 0.7863 0.0577* NP 0.2284 0.1257 NP ND NP ND 0.2048 0.0903
Spring (September - November)
Site (N surveys/error df) Birds Rabbits Possums Small mammals
Macropods Pigs Echidnas Toads Frogs Hopping-mice Reptile
Barcaldine (6/5) 0.7361 0.0050* 0.1019 0.2557 1.0000 0.0583* 0.0041 ND 0.3632 NP RE
Blackall (6/5) 0.8789 0.0578* ND 0.5583 0.0116* ND 0.8717 ND 0.3632 NP RE
Cordillo (3/2) 0.1428 0.0533^ NP 0.3036 0.0198* 0.4226 ND ND 0.4226 0.9387 0.4400
Lambina (0/0) NS NS NP NS NS NP NS NP NS NS NS
Mt Owen (6/5) 0.1927 0.0405^ 0.0008^ 0.0988 0.5910 1.0000 ND NR NR NP RE
Quinyambie (3/2) 0.6734 0.9830 NP 0.0991 0.2254 ND 0.4226 NP 0.4226 0.1061 0.3399
Strathmore (2/1) 0.2952 ND 1.000 0.5000 0.3017 0.3529 ND NR NR NP RE
Tambo (4/3) 0.0904 0.0021^ 0.6042 0.0663 0.5720 0.1411 1.0000 ND ND NP RE
Todmorden (2/1) 0.0997 0.3375 NP 0.8688 X NP ND NP 0.5000 0.2857 0.1526
Summer (December - February)
Site (N surveys/error df) Birds Rabbits Possums Small mammals
Macropods Pigs Echidnas Toads Frogs Hopping-mice Reptile
Barcaldine (3/2) 0.1493 0.3249 0.2254 0.4045 0.3101 0.2254 1.0000 0.4226 ND NP RE
Blackall (2/1) 0.5303 0.9097 ND 0.1131 0.2389 0.5000 ND ND 0.5000 NP RE
Cordillo (1/0) X X NP X X X ND ND X X X
Lambina (2/1) 0.3712 0.6051 NP 0.7018 0.5000 NP ND NP 0.5000 0.0622 0.3375
Mt Owen (1/0) X X X X X ND ND NR NR NP RE
Quinyambie (1/0) X X NP X ND ND ND NP ND X X
over the course of the study there (Table 5, and Figure Two in [25]), and were numerically unaffected by baiting (Figures 7 and 16). In this context, however, macropods and rabbits (Oryctolagus cuniculus) increased in the baited area where possums (Trichosurus vulpecula) decreased (Figures 7 and 16); all other taxa showed no evidence of baiting-induced changes in PTI trends. Possums (53% oc-currence), macropods (29% occurrence) and rabbits (7% occurrence) were the three most frequently occurring prey species in dingo diets at Mt Owen, where dingoes switched seasonally between macropods and possums [47,48]. These observations suggest that baiting-induced changes to dingo populations can occur in some contexts, whereby large macropod prey can become unavailable (or uncatchable) to socially-fractured dingo populations ex-posed to baiting, which then must switch to alternative prey more easily captured [47,50]. In this case, dingoes ex-posed to baiting appeared to suppress populations of com-mon possums, but not any other more threatened small mammal species. The historical decline of possums in the Australian rangelands has previously been attributed to dingo predation [51-53]. Whether or not these baiting-induced prey responses are sustained subsequent to a change in the ecological context is unknown, but unlikely,
given that baiting-induced functional changes in dingo movement behaviour [54] or prey selection (B. Allen, unpublished data from [55,56]) did not occur at several other sites where these processes were investigated (Table 4, Figures 3, 4, 5, 6, 8, 9, 10, 11, 12, 13, 14, 15 and 17, 18, 19, 20). These variable results suggest that the few numerical changes we observed in some of the preferred dingo prey species at some sites may be re-lated to context-specific functional changes to dingo populations subjected to baiting, which might some-times occur.
[image:7.595.57.539.114.142.2]Although patterns in prey PTI were typically unaffected by dingo control, it is possible that prey behaviour might have been altered–perhaps negatively–through changes to the landscape of fear [12,57,58]. In other words, baiting-induced changes to dingo function (if or when it occurs) might allow mesopredators to forage more freely and then increase predation pressure on prey, negatively affecting prey behaviour and fitness [32,33,59]. Changes to the landscape of fear might occur independently of nu-merical trends in predator populations. Step 2 of our ana-lyses provided the greatest opportunity to assess the behavioural responses of prey to predator control, yet short-term changes in prey PTI were not apparent in most Table 3 P values obtained from repeated measures ANOVA assessing seasonal differences in mean prey PTI (surveys pooled by season) between baited and unbaited areas at nine sites across Australia(Continued)
Tambo (2/1) 0.5718 0.5000 ND 0.5000 0.1772 0.5000 0.5000 ND 0.5000 NP RE
Todmorden (4/3) 0.8290 0.0632 NP 0.3193 0.1027 NP ND NP 0.3910 0.8470 0.0021*
NP = not present; ND = known to be present but not detected on tracking plots; NR = present and detected on tracking plots but not recorded; RE = Mostly
Varanusspp. and reported in [25]; X = insufficient data; *All reptiles except forVaranusspp. (i.e. predominately agamidae and skincidae); ^All dasyurids and rodents except for hopping-mice.
[image:7.595.61.538.509.696.2]cases (Figure 2). Comprehensive reviews of the short-term effects of dingo control on prey concur with our results to show that populations of non-target prey are not nega-tively affected by dingo control [60,61]. Specifically investi-gating the behavioural responses of prey to dingo control, Fenner et al. [62] likewise found no change in small mam-mal prey behaviour following baiting. The predator ma-nipulation experiments conducted by Eldridge et al. [39] similarly show prey populations (such as birds and rep-tiles) to fluctuate independent of dingo control. Modelling the outcomes of dingo reintroduction and cessation of fox control on prey fauna in forested temperate areas by Dexter et al. [63] also suggests small mammal populations fluctuate largely independent of dingoes. Whereas, the predator exclosure experiments of Kennedy et al. [64] sug-gest that some small mammal prey of dingoes benefit from dingo exclusion, as predicted by Allen and Leung [55]. The predator exclosure experiment of Moseby et al. [65] showed that some rodents benefited from the removal of rabbits, dingoes and other predators, whereas reptiles, dasyurids and other rodents were largely unaffected by their exclusion. If baiting-induced behaviourally-mediated trophic cascades were occurring at our sites, such changes were not manifest as numerical effects on longer-term prey abundance trends in most cases (Tables 1, 2 and 3, Figures 3, 4, 5, 6, 7, 8, 9, 10, 11).
These results contradict perceptions (reviewed in [35,36]) that (1) prey population abundances are lower in baited areas, (2) prey activity is suppressed shortly after bait-ing, (3) commencement of baiting produces declines in prey abundances, and (4) cessation of baiting increases prey abundances. Long-term (10–28 years) correlative studies of dingoes, mesopredators and their prey con-cur with these experimental results (e.g. [37,38]), and
“almost all available studies reporting dissimilar results are based on demonstrably confounded predator popu-lation sampling methods and/or low-inferential value study designs that simply do not have the capacity to provide reliable evidence for dingo control-induced mesopredator release”([40], pg. 4). Thus, not only is there a clear absence of reliable evidence for dingo control-induced trophic cascades (e.g. [46,66]), but there is also a strong and growing body of demonstrable experimental evidence that prey populations are usually affected posi-tively (not negaposi-tively) by dingo control if prey are affected at all (e.g. [55,59], this study).
Trophic cascade and mesopredator release theory and reality
[image:8.595.56.539.112.376.2]Trophic cascade and mesopredator release theory predicts that declines of top-predators produce increases of mesopredators and larger herbivores, which then
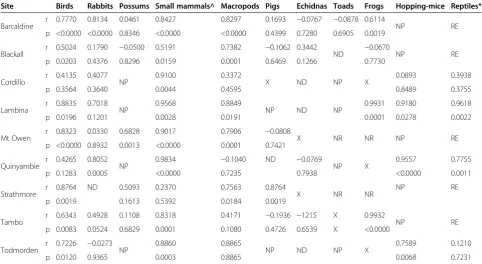
Table 4 Correlations (r) and p values (p) for relationships in longer-term prey PTI trends between baited and unbaited areas at nine sites across Australia
Site Birds Rabbits Possums Small mammals^ Macropods Pigs Echidnas Toads Frogs Hopping-mice Reptiles*
Barcaldine r 0.7770 0.8134 0.0461 0.8427 0.8297 0.1693 −0.0767 −0.0878 0.6114 NP RE p <0.0000 <0.0000 0.8346 <0.0000 <0.0000 0.4399 0.7280 0.6905 0.0019
Blackall r 0.5024 0.1790 −0.0500 0.5191 0.7382 −0.1062 0.3442 ND −0.0670 NP RE p 0.0203 0.4376 0.8296 0.0159 0.0001 0.6469 0.1266 0.7730
Cordillo r 0.4135 0.4077 NP 0.9100 0.3372 X ND NP X 0.0893 0.3938
p 0.3564 0.3640 0.0044 0.4595 0.8489 0.3755
Lambina r 0.8835 0.7018 NP 0.9568 0.8849 NP ND NP 0.9931 0.9180 0.9618
p 0.0196 0.1201 0.0028 0.0191 0.0001 0.0278 0.0022
Mt Owen r 0.8323 0.0330 0.6828 0.9017 0.7906 −0.0808 X NR NR NP RE
p <0.0000 0.8932 0.0013 <0.0000 0.0001 0.7421
Quinyambie r 0.4265 0.8052 NP 0.9834 −0.1040 ND −0.0769 NP X 0.9557 0.7755
p 0.1283 0.0005 <0.0000 0.7235 0.7938 <0.0000 0.0011
Strathmore r 0.8764 ND 0.5093 0.2370 0.7563 0.8764 X NR NR NP RE
p 0.0019 0.1613 0.5392 0.0184 0.0019
Tambo r 0.6343 0.4928 0.1108 0.8318 0.4171 −0.1936 −1215 X 0.9932 NP RE p 0.0083 0.0524 0.6829 0.0001 0.1080 0.4726 0.6539 X <0.0000
Todmorden r 0.7226 −0.0273 NP 0.8860 0.8865 NP ND NP X 0.7589 0.1210
p 0.0120 0.9365 0.0003 0.8865 0.0068 0.7231
produce declines in smaller prey, which are often threat-ened [5,7]. The theory appears to work best in reality when food webs are simpler and less complex [67,68]. Deriving their conclusions from desktop studies, snap-shot field studies and/or those conducted on fauna on other continents, some have predicted that dingo control will release feral pigs (Sus scrofa), macropods and rabbits from dingo suppression, which will then simultaneously reduce the abundances of hopping-mice and other small mammals, birds and other fauna [13,36,69]. Thus, top-predator management programs that kill, remove or alter the function of top-predators might conceivably produce indirect declines of threatened fauna [8,34]. Despite the potential for substantial and direct negative effects of dingoes on the same threatened fauna through predation [26,51,55,70], such predictions have led some to advocate cessation of dingo control programs with the expectation that doing so will provide widespread net benefits to threatened fauna at lower trophic levels (e.g. [13,32,71]). However, our simultaneous assessment of the effects of dingo control on predator and prey pop-ulations demonstrated that the predicted mesopredator increases do not occur (Table 5 and Figures 12, 13, 14, 15, 16, 17, 18, 19, 20; see also Figure Two in [25])
because contemporary dingo control practices “do not appear to suppress dingo populations to levels low enough and long enough for mesopredators to exploit the situation” ([25], pg. 11). Hence, the consistent ab-sences of negative prey responses to dingo control we found (Tables 1, 2 and 3, Figures 2, 3, 4, 5, 6, 7, 8, 9, 10, 11, 12, 13, 14, 15, 16, 17, 18, 19, 20) should be entirely expected given that the prerequisite first step or trigger for the predicted trophic cascade (i.e. dingo decline) did not occur (Figures 12, 13, 14, 15, 16, 17, 18, 19, 20). What-ever the relationships between dingoes and mesopredators or prey are, they do not appear to be affected by contem-porary dingo control practices to any substantial degree. Alternative dingo control strategies which actually achieve sustained reduction of dingo abundances and/or alteration of dingo function may produce different results that might lend support to popular predictions of dingo control-induced trophic cascades or mesopredator release [25].
[image:9.595.53.539.88.387.2]assemblages largely untouched by humans are not easily transferable to other predators occupying the severely human-altered areas that dominate the earth’s surface [18], such as dingoes and the relatively depauperate mam-mal assemblages in the beef cattle rangelands of Australia [19]. Moreover, by undertaking applied-science experi-ments which circumvent investigations of the internal processes at play and instead focus on the actualin situ prey responses to top-predator control (R6 in Figure 1)
–what Kinnear et al. [74] label the‘black box’approach
– our results confirm that prey populations are typic-ally unaffected by contemporary dingo control practices independent of how predators and prey might interact with each other (R2 in Figure 1).
Our findings are in accord with what is known from other predator manipulation experiments worldwide. Fauna at lower trophic levels are unlikely to respond positively to lethal control where (1) multiple predators are removed (i.e. dingoes and foxes are both susceptible to and targeted by baiting [25]) (2) the efficacy of predator removal is low (i.e. where predator populations are resili-ent to lethal control over time, as in Table 5 or Figures 12, 13, 14, 15, 16, 17, 18, 19, 20; see also [30] or Figure Two in [25]), and/or where (3) the fauna are not the primary
prey species of the predator ([43]; but see [48,55] for information on dingo diets at our sites). Though small and medium-sized mammals (such as rodents, pos-sums and rabbits) are preferred prey for dingoes and other mesopredators alike when available [26,55], fluc-tuations in the availability of a variety of prey species typically mean that suppression of a given prey species is often only temporary [41,75,76]. Besides targeting multiple predators and producing no lasting changes in predator PTI trends in our experiments (Table 5, Figures 12, 13, 14, 15, 16, 17, 18, 19, 20), the flexible and generalist nature of dingoes’, foxes’, cats’and go-annas’prey preferences may be another reason why we did not detect changes in prey PTI trends following predator baiting.
[image:10.595.53.539.89.386.2]resilience of prey to changes in predator numbers or be-haviour are each important factors influencing the re-sponses of prey to predator control [41-43]. Study design and analytical approach also influences the ob-served outcomes given that ‘what you see depends on how you look’(e.g. [40,44,46,56]). Changes in prey abun-dances following predator control might only be ex-pected where or when predation is actually the limiting factor for prey [51,69]. Many of Australia’s threatened fauna are affected to a greater degree by much more than just predator effects [3,70,78-80], suggesting that al-teration of predator communities or predator control strategies–in isolation of other, more important drivers of prey decline – might not be universally expected to enhance prey recovery [14,51].
The timeframe over which prey are monitored may also influence the observed prey responses to predator baiting. Snap-shot studies with a single observation conducted at only T0(e.g. [81-84]) obviously have no capacity
whatso-ever to measure a spatial or temporal ‘change’,‘shift’ or
‘response’to dingo control [44,45], which is why we con-ducted multiple surveys over multiple successive years at each site (T0, T1, T2…up to T23; Table 2). Despite
con-ducting our experiments over these timeframes, similar to
most other predator manipulation experiments [43], it is possible that 2–5 years of repeated prey surveys might not be long enough to detect changes in prey abundances fol-lowing predator removal [65]. However, three lines of evi-dence suggest that this is not the case for our data.
[image:11.595.52.540.89.387.2]baiting had occurred multiple times each year for over 10 years [25]. Viewed in isolation, this latter result might be interpreted to suggest that prey had already declined in baited areas and was now being held below their carrying capacity; however, shorter-term declines were not
[image:12.595.54.539.91.385.2]apparent (Table 4, Figures 3, 4, 5, 6, 7, 8, 9, 10, 11), baiting history was not important to most species (Table 1), over-all mean prey PTI was not lower in baited areas for any prey at any of the three Blackall sites (Table 2), and nor were predator PTI trends altered by baiting at these sites Figure 6Longer-term prey PTI trends in baited (solid lines) and unbaited (dotted lines) areas at Lambina (see Table 4 for associated r and p values).
[image:12.595.57.538.505.705.2]either (Table 5, Figures 12, 13, 14, 15, 16, 17, 18, 19, 20, and Figure Two in [25]). These lines of evidence indicate that our experimental design was sufficient for detecting baiting-induced changes in prey PTI if they were occur-ring [44].
[image:13.595.53.541.90.386.2]The utility of our fauna sampling method (i.e. road-based sand plots) is also likely to vary between species and species groups [87,88]. This may be one reason why the number of tracks observed, and hence PTI values, for some species were low on occasion (Table 6; see also
[image:13.595.55.539.505.705.2]Figure 9Longer-term prey PTI trends in baited (solid lines) and unbaited (dotted lines) areas at Strathmore (see Table 4 for associated r and p values).
Table Six in [25]) and why their analyses yielded no sig-nificant responses to baiting (Tables 1, 2, 3, 4 and 5). However, the variable utility of the technique for differ-ent species is also of little consequence to our overall conclusions. Far from being a weakness of our study, the observance of few footprints for some species at times (confirming their presence at the study sites) is itself a key result supporting our conclusions given that the number of observations (or PTI values) did not change substantially over time in response to dingo baiting (Figures 3, 4, 5, 6, 7, 8, 9, 10, 11, 12, 13, 14, 15, 16, 17, 18, 19, 20; see also [89]). Our expectation was that if baiting-induced mesopredator releases or prey suppres-sion was occurring (see Predicted outcomes, below), then these responses should have been detectable on the 92–166 sand plots interspersed throughout the treatment areas on dirt roads at each site (Note:‘roads’ here are simply the two 4WD vehicle wheel tracks that wind throughout the study sites with negligible disturb-ance or alteration to the extant habitat). To argue that our sampling methodology was unable to detect changes in fauna PTI is to imply that mesopredator releases or prey suppression was occurring elsewhere, or that observed
[image:14.595.53.539.88.388.2]13, 14, 15, 16, 17, 18, 19, 20) should have detected preda-tor and prey PTI responses to baiting if they were occur-ring, regardless of the variable utility of road-based tracking plots for different species.
Although we undertook our study in an experimental framework inclusive of buffer zones to maximise treat-ment independence, it is also important to remember that our approach was an evaluation of the overall population-level responses of prey to contemporary top-predator control practices under real-world environmental conditions where predators and prey were each cap-able of dispersal and migration between treatments over time. In other words, we sought not to compare nil-treatment areas to paired treated areas with‘X% reduction of predators’or‘X density of baits’, but with‘ contempor-ary dingo control practices’. This applied-science focus therefore produces results that reflect thein situoutcomes of contemporary dingo control practices in the beef-cattle rangelands present across much of the Australian con-tinent. Dingo control strategies that actually achieve complete and sustained dingo removal from the land-scape (such as those that include exclusion fencing and eradication) may produce different results, though
such strategies are unlikely to ever occur in the >5.5 million km2 (or ~75%) of Australia where sheep (Ovis aries) and goats (Capra hircus) are not commercially farmed [27].
Conclusions and implications
[image:15.595.57.538.88.392.2]Our results add to the growing body of experimental evidence that prey populations in rangeland Australia are not negatively affected by contemporary dingo con-trol practices through trophic cascade effects. These findings broaden our understanding of the potential out-comes of predator control on prey fauna at lower trophic levels and have important implications for the management of dingoes and threatened fauna. Given the ineffectiveness of contemporary baiting practices at sustainably reducing dingo populations, it might be concluded that dingo control is a pointless waste of time, money and dingoes, which may even be counter-productive to cattle producers at times [50,92]. Import-antly however, dingo control is typically undertaken to reduce or avert damage to livestock by dingoes, not to reduce dingo densities per se, and the relationship be-tween dingo density and damage is not well understood Figure 11Longer-term prey PTI trends in baited (solid lines) and unbaited (dotted lines) areas at Todmorden (see Table 4 for
[31,93]. Hence, the ‘effectiveness’of dingo control should ultimately be measured in terms of ‘damage reduced’ or
‘losses averted’, not in terms of‘% reduction in dingo PTI’,
‘% dingoes destroyed’, ‘% people participating in dingo control’, or the‘% of land area exposed to control’[44,94]. Greater emphasis on measurable damage reduction and/ or mitigation appears warranted in order to ethically jus-tify continued dingo control programs.
[image:16.595.57.540.87.570.2]of interest and the general indifference of predator and prey populations to contemporary dingo control prac-tices before altering current predator control strategies. We conclude, as have others (e.g. [14,59,97]), that pro-posals to cease dingo control are presently unjustified on grounds that contemporary dingo control somehow harms prey fauna through trophic cascade effects. Our experimental results should be valuable for informing dingo and threatened fauna management plans given that “the majority of work to date has been largely observational and correlative” ([98], pg. 64; see also [35,46]). Future studies might focus on measuring tor control-induced changes in the behaviour of preda-tors (such altered foraging times, prey preferences and space use) and prey (such as selection of non-preferred or safe resources of lesser quality) that may have subtle
effects on prey fitness and long-term population viability not detectable in our experiments.
Methods
[image:17.595.55.542.89.473.2]of Environment and Heritage’s Wildlife Ethics Committee, WEC 16/2008).
Study sites and design
We conducted a series of large-scale, multi-year, predator-manipulation experiments on extensive beef-cattle produ-cing properties in five different land systems representing the breadth of the beef-cattle rangelands of Australia, where mean rainfall varied from 160–772 mm annually, or from arid to tropical areas (see Figure Seven and Table Six in [25]). Seasonal conditions fluctuated between pe-riods of above- and below-average rainfall, or between drought and flush periods at each site during our experi-ments (Figure 21).
Using paired nil-treatment areas without dingo con-trol for comparison (see Figure EightA in [25]), we ex-amined the relative abundances of prey (and predators) in
[image:18.595.58.539.88.472.2]sufficient to kill adult dingoes, foxes or cats if consumed soon after bait distribution [99]. Such spatially and tem-porally sporadic baiting practices are common, occur widely across Australia, and are considered the only effect-ive dingo and fox control tool used in rangeland areas [31,100]. Populations of all other extant fauna at our sites are typically not susceptible to such baiting practices be-cause they are either tolerant of the toxin at the low-level doses used in dingo baits and/or rarely consume carrion-like baits, preferring live prey instead (e.g. [60,61,101]).
Experimental treatment (i.e. baited) and nil-treatment (i.e. unbaited) areas were randomly allocated. Treatment and nil-treatment areas were also replicated in some land systems (see Table Six in [25]). Hone [44] defines this study design as an ‘unreplicated experiment’ or a
‘classical experiment’ for our site with replication (i.e.
Todmorden and Lambina might be considered a single site with two treatments and two controls). Both treat-ment and nil-treattreat-ment areas at three of the six experi-mental sites were historically exposed to baiting up until the commencement of the experiment, whereas, both treatment and nil-treatment areas were not historically exposed to baiting at the other three experimental sites (see Table Six in [25]). Such different baiting histories were necessary to investigate the responses of prey to ei-ther the commencement or cessation of baiting, or to the ‘removal’ or ‘addition’ of predators (i.e. dingoes and foxes were killed at some sites or allowed to increase at others).
[image:19.595.58.539.88.472.2]from the six experimental sites in that the treatments and nil-treatments had already been established for over 10 years and they did not have buffer zones between them (see Figure EightB in [25]). This allowed an assess-ment of the longer-term outcomes of dingo control. Treatment size, independence and baiting practices therefore varied between the nine sites in order to de-liver in situ tests which reflected contemporary dingo control practices within each bioregion. Experiments were conducted at large spatial scales, where the size of the total treatment and nil-treatment area at each of the nine sites ranged between 800 km2 and 9,000 km2, or 45,600 km2 in total (see Table Six in [25]). The mean property size of properties that bait in north Queensland (where several of our study sites were located) is 400 km2, and is substantially less elsewhere in Queensland (Queensland Department of Agriculture, Forestry and Fisheries, unpublished data). The size of the baited treatment areas sampled in our experiments ranged from 400 km2 to 4,000 km2 (Table Six in [25]). Thus, the sizes of our baited treatment areas represent areas of similar size or up to 10 times larger than those com-monly subjected to baiting. Each site was separated by 100–1,500 km, except in the case of Todmorden and
Lambina, which were neighbouring properties (see Figure Seven in [25]).
Prey population monitoring
Prey populations were simultaneously monitored in treatment and nil-treatment areas using passive tracking indices (PTI; [102]), which are commonly used to moni-tor a variety of ground-dwelling mammals, reptiles and birds both in Australia and elsewhere around the world (e.g. [37,38,88,103-105]. We monitored populations of native and exotic amphibians, reptiles, ground-foraging birds and mammals of various sizes from small rodents (~15 g) to large herbivores such as kangaroos (Macropus spp.) and feral pigs using this technique. Larger feral herbivores (e.g. camels Camelus dromedarius, donkeys Equus asinus, and horses Equus caballus) were also re-corded on sand plots on a few occasions, but were ex-cluded from analyses because PTI values for these species are confounded by the effects of humans (e.g. culling and harvesting actions), and nor are these very large species likely to be affected by dingoes to any great degree, or vice versa [106].
[image:20.595.55.540.89.380.2]subsequent year over a 2–5 year period (see Table Six in [25]). At the Blackall sites, between 92 and 166 passive tracking plots (or ‘sand plots’) were spaced at 1 km in-tervals along unformed vehicle tracks. At the six experi-mental sites, 50 plots each were similarly established in both the treatment and nil-treatment areas (i.e. 100 plots per site). For any given survey, plots in both treatments were read and refreshed at the same time daily by the same experienced observer and were monitored for up to 10 successive days (usually 2–5). The location of the first tracking plot in each treatment area was randomly allocated and plots were distributed throughout a similar suite of microhabitat types in both treatment areas. Plots rendered unreadable to one or more species by wind, rain or other factors were excluded from analyses. All predator and prey track intrusions were counted (i.e. a continuous measure). However, the tracks of irruptive
small mammals and hopping-mice were limited to a maximum value of 15 tracks per plot per day, which rep-resented saturation of the sand plot with their tracks (i.e. their populations were super-abundant). PTI values for a given survey therefore represented the mean number of prey track intrusions per sand plot tracking station per 24 hr period (i.e. the mean of daily means; [102]). PTIs collected in this way can be reliably interpreted as robust estimates of relative abundance if analysed appropriately (e.g. [66,77,87], but see [107] for an alternative view).
[image:21.595.56.541.90.472.2]to achieve treatment independence during individual surveys (see Figure Eight in [25]). The appropriate width of the buffer zone at each site was based on the width of 1–2 dingo home ranges in the study areas (e.g. [54,91,108]). Tracking plots were located no closer than 5–25 km from the edge of the treat-ment area (i.e. half the width of the buffer zone) to minimise potential edge effects. Overall, we obtained 35,399 plot-nights of tracking data from 128 surveys conducted over 31 site-years (Table 6; see also Table Six in [25]).
Analytical approaches
Given that each site represented a unique combination of factors including experimental design (experiment or correlation), sampling intensity (N surveys ranged from 6–23), mean annual rainfall (160–772 mm), land system (five different types), treatment size or scale (800– 9,000 km2), baiting context (five different types), baiting frequency (three different types), baiting history (three different types), climate trend during the study period (three different types), and the decade the study was conducted (different sites were sampled up to 30 years apart), reliably assessing their relative effects separately
[image:22.595.59.540.89.379.2]considered equal between sites and should not be pooled across sites as if they were equal.
These limitations meant that only ‘baiting history’and
‘treatment’ offered reliable variables on which to block or pool data across sites, for a given species or species group. Thus, to avoid a complicated variety of site-, context- and species-specific analytical approaches, we consistently applied a conservative three-step logical
approach to examine the effects of lethal dingo control on sympatric prey populations at each site.
[image:23.595.56.540.86.569.2]histories for over 10 years; N = 3 properties for each), treatment (baited or unbaited) and their interaction on both the overall mean and median PTI for predators and prey. Medians were assessed to address potential issues re-lated to the non-symmetrical distributions of PTI values for some species [89]. Means were assessed for compara-tive purposes. Results from these analyses yielded little useful information for determining the responses of prey to predator control because the other factors identified above hide or confound any responses that might actually be present. Thus, subsequent analyses focused in detail on individual ‘site x species’combinations in order to expli-citly identify which (if any) species responded to dingo control at a given site.
We then compared the mean PTI of prey (both overall and also stratified by season) between baited and unbaited
[image:24.595.56.541.89.473.2]In Step 2, we determined short-term changes in prey PTI values between pre- and post-baiting surveys by assessing mean net changes in PTI (i.e. changes in the baited area after accounting for changes in the unbaited area) with one-factor repeated measures ana-lyses, or t-tests. To ensure maximum analytical power, this was done for each site where at least four pre- and post-baiting surveys were conducted. This step identifies any short-term responses to baiting and their cause (i.e. baiting) but cannot determine whether or not these observed responses are sustained over longer time-frames. Greater detail on the resilience of dingoes to le-thal control and the factors affecting the efficacy of individual baiting programs can be found elsewhere in [19,47,85].
In Step 3, we assessed (1) temporal correlations between predator and prey abundance trends in baited and unbaited areas and (2) whether or not the difference in species’PTI values between baited and unbaited areas increased, de-creased or did not change over time. This third and final step assesses whether or not population trends in baited and unbaited areas fluctuate synchronously, identifies causal factors (i.e. baiting), and determines whether or not predator or prey population trends in baited and unbaited areas are diverging or converging over longer timeframes. Step 3 is the most conclusive of our analyses for determin-ing the responses of predators and prey to baitdetermin-ing.
This three-step analytical approach was designed to assess the outcomes of baiting at each site for each spe-cies, and was not designed to assess the relative influ-ence of the many other factors that might also influinflu-ence predator and prey population dynamics, such as rainfall and those others mentioned above (e.g. [117,118]). Ana-lyses were performed using all available data. However, data were not available for all prey species at all sites
because the distribution of various species does not extend to all sites [49] or because extant species were not detected on tracking plots or recorded (Table 6). For example, though they were present at some sites, no analyses could be performed on koalas (Phascolarctos cinereus) due to insufficient data (Table 6). Additional details on the sensitivity and reliability of our methods can be found in Allen et al. [25,89] or Allen [85,119] and Allen [19].
Predicted outcomes (which seldom, if ever, occurred; see Results)
Whether through numerical and/or functional changes to predator and/or prey populations, overall negative ef-fects of lethal top-predator control on prey populations are expected to be manifest as a numerical decline in prey population abundance indices in baited areas (e.g. [13,32,33]). Thus, our three-step analytical approach would detect dingo control-induced prey declines where dingo PTI trends diverge or converge and:
1. Mean overall prey PTI is lower in baited areas (potentially indicative of greater mesopredator abundances and predation pressure on prey in baited areas)
2. Mean net prey PTI significantly decreases shortly after dingo control (potentially indicative of an immediate increase in mesopredator activity, predation pressure on prey or
fear-induced behavioural avoidance of predators by prey)
3. (A) Prey PTI trends are negatively correlated over time between treatments and/or (B) divergence or convergence of PTI trends is apparent (potentially indicative of longer-term dingo control-induced prey declines).
Table 5 Correlations (r, with p values in parentheses) for relationships in longer-term predator PTI trends between baited and unbaited areas at nine sites across Australia (see also Figure Two in [25])
Site Dingoes Foxes Cats Goannas
Barcaldine 0.6174 (0.0017) 0.1930 (0.3777) 0.2962 (0.1700) 0.3682 (0.0838)
Blackall 0.6409 (0.0017) 0.5137 (0.0172) 0.2660 (0.2437) −0.3321 (0.1413)
Cordillo −0.0919 (0.8446) 0.2185 (0.6379) −0.2582 (0.5761) 0.6285 (0.1306)
Lambina 0.5761 (0.3094) −0.0199 (0.9746) 0.7845 (0.1162) −0.3542 (0.5587)
Mt Owen 0.6152 (0.0051) 0.2679 (0.2674) 0.6828 (0.0013) 0.9518 (0.0000)
Quinyambie 0.4028 (0.1533) 0.4199 (0.1350) −0.1627 (0.5785) X
Strathmore 0.4313 (0.2464) NP 0.4393 (0.2368) 0.7577 (0.0180)
Tambo 0.2969 (0.2642) X 0.9564 (0.0000) 0.2254 (0.4013)
Todmorden 0.1463 (0.6678) 0.0145 (0.9663) 0.3002 (0.3698) 0.6259 (0.0394)
Table 6 The total number of prey tracks observed in paired baited and unbaited areas at nine sites in Australia
Site Treatment Plotnights Birds Rabbits Possums Small mammals^ Macropods Pigs Echidnas Koalas Toads Frogs Hopping mice Reptiles*
Barcaldine B 3015 998 1005 17 901 1901 29 24 BP 10 24 NP RE
UB 3131 921 608 2 703 1969 3 9 2 10
Blackall B 809 187 120 1 185 348 1 5 BP ND 2 NP RE
UB 3271 808 473 2 749 762 8 19 19
Tambo B 1352 1001 93 5 222 782 17 1 BP 0 2 NP RE
UB 2130 901 148 4 448 960 13 3 6 11
Mt Owen B 4389 4554 1292 175 1442 1512 2 1 2 NR NR NP RE
UB 4350 5549 2229 1048 2186 1157 1 1 1
Strathmore B 2066 4254 ND 32 21 200 89 3 BP NR NR NP RE
UB 2186 5633 26 53 1183 295 0
Lambina B 750 380 11 NP 1128 127 NP ND NP NP 106 276 132
UB 750 275 10 1051 152 24 303 84
Quinyambie B 1400 1026 922 NP 1942 12 ND 1 NP NP 0 6105 213
UB 1400 948 1234 1554 1 1 3 8883 190
Cordillo Downs B 900 134 16 NP 593 25 7 ND NP NP 0 356 136
UB 900 459 53 980 20 0 37 130 252
Todmorden B 1300 496 221 NP 1366 89 NP ND NP NP 8 393 377
UB 1300 470 9 1333 108 0 272 173
Grand Total 35399 28995 8444 1312 16857 11308 465 68 3 18 246 16718 1557
* = Greater in baited areas; ^ = greater PTI in unbaited areas; NP = not present; ND = known to be present but not detected on tracking plots; NR = present and detected but not recorded; RE = mostlyVaranusspp. and reported in [25]; X = insufficient data to calculate p; #N surveys for hopping-mice at Lambina = 2, error df = 1 for hopping-mice.
Frontiers
in
Zoology
2014,
11
:56
Page
26
of
30
nzoology.com
/content
Availability of supporting data
All PTI values obtained during our study are presented in the tables and figures.
Abbreviations
PTI:Passive tracking index; ANOVA: Analysis of variance.
Competing interests
The authors declare that they have no competing interests.
Authors’contributions
LA designed and supervised the study. BA and LA collected field data and performed preliminary analyses. BA performed the remaining analyses, constructed the tables and figures and wrote the majority of the manuscript. RE performed statistical analyses. LA, RE and LL contributed further to the writing of the manuscript. All authors read and approved the final manuscript.
Acknowledgements
Generous in-kind support and hospitality was freely provided by the owners and managers of the beef-cattle properties on which we worked–this research would not have been possible without them. Damien Byrne, Heather Miller, James Speed, Steve Eldridge and Tony Gonzales assisted in the collection of field data. Analytical and editorial advice on earlier drafts of the paper was provided by Joe Scanlan, Matt Gentle and Matt Hayward. Allan Lisle provided additional statistical advice. Al Glen, Camilla Myers, Dane Panetta, Glen Saunders, Greg Campbell, Jim Hone, John Read, Peter Bird, Peter Fleming, Simon Humphrys and Tony Pople provided advice on the associated study of Allen et al. [25], which advice was further used to shape aspects of this related paper as well. Generous funding for components of this study was provided by the following Australian Government funding sources: Bureau of Resource Sciences, Caring for Our Country, and Natural Heritage Trust. These funding bodies had no role in the design, implementation, analysis or publication of this study. Some of this funding was administered by the South Australian Arid Lands Natural Resources Management Board. The production of this report was undertaken as part of work supported by the Invasive Animals Cooperative Research Centre.
Author details 1
School of Agriculture and Food Sciences, The University of Queensland, Warrego Highway, Gatton, QLD 4343, Australia.2Robert Wicks Pest Animal Research Centre, Biosecurity Queensland, Tor Street, Toowoomba, QLD 4350, Australia.3National Wildlife Research Centre, US Department of Agriculture, LaPorte Avenue, Fort Collins, CO 80521-2154, USA.
Received: 11 March 2014 Accepted: 25 July 2014 Published: 16 September 2014
References
1. Tscharntke T, Clough Y, Wanger TC, Jackson L, Motzke I, Perfecto I, Vandermeer J, Whitbread A:Global food security, biodiversity conservation and the future of agricultural intensification.Biol Conserv2012,151:53–59. 2. Tylianakis JM, Didham RK, Bascompte J, Wardle DA:Global change and
species interactions in terrestrial ecosystems.Ecol Lett2008,11:1351–1363. 3. McKenzie NL, Burbidge AA, Baynes A, Brereton RN, Dickman CR, Gordon G,
Gibson LA, Menkhorst PW, Robinson AC, Williams MR, Woinarski JCZ:
Analysis of factors implicated in the recent decline of Australia’s mammal fauna.J Biogeogr2007,34:597–611.
4. Ritchie EG, Johnson CN:Predator interactions, mesopredator release and biodiversity conservation.Ecol Lett2009,12:982–998.
5. Crooks KR, Soulé ME:Mesopredator release and avifaunal extinctions in a fragmented system.Nature1999,400:563–566.
6. Estes J, Crooks K, Holt RD:Ecological Role of Predators.InEncyclopedia of Biodiversity, Volume 6. 2nd edition. Edited by Levin SA. Waltham: Academic; 2013.
7. Terborgh J, Estes JA:Trophic Cascades: Predator, Prey, and the Changing Dynamics of Nature.Washington D.C: Island Press; 2010.
8. Ripple WJ, Estes JA, Beschta RL, Wilmers CC, Ritchie EG, Hebblewhite M, Berger J, Elmhagen B, Letnic M, Nelson MP, Schmitz OJ, Smith DW, Wallach AD, Wirsing AJ:Status and ecological effects of the world's largest carnivores.Science2014,343:151–163.
9. Hayward MW, Somers MJ:Reintroduction of Top-order Predators.Oxford: Wiley-Blackwell; 2009.
10. Ritchie EG, Elmhagen B, Glen AS, Letnic M, Ludwig G, McDonald RA:
Ecosystem restoration with teeth: what role for predators?Trends Ecol Evol2012,27:265–271.
11. Sergio F, Caro T, Brown D, Clucas B, Hunter J, Ketchum J, McHugh K, Hiraldo F:Top predators as conservation tools: ecological rationale, assumptions, and efficacy.Annu Rev Ecol Evol Syst2008,39:1–19.
12. Ordiz A, Bischof R, Swenson JE:Saving large carnivores, but losing the apex predator?Biol Conserv2013,168:128–133.
13. Wallach AD, Johnson CN, Ritchie EG, O'Neill AJ:Predator control promotes invasive dominated ecological states.Ecol Lett2010,13:1008–1018. 14. Fleming PJS, Allen BL, Ballard G:Seven considerations about dingoes as
biodiversity engineers: the socioecological niches of dogs in Australia. Australian Mammalogy2012,34:119–131.
15. Muhly TB, Hebblewhite M, Paton D, Pitt JA, Boyce MS, Musiani M:Humans strengthen bottom-up effects and weaken trophic cascades in a terrestrial food web.PLoS ONE2013,8:e64311.
16. Wright HL, Lake IR, Dolman PM:Agriculture—a key element for conservation in the developing world.Conserv Lett2012,5:11–19. 17. Phalan B, Balmford A, Green RE, Scharlemann JPW:Minimising the harm to
biodiversity of producing more food globally.Food Policy2011,
36(Supplement 1):S62–S71.
18. Linnell JDC:The relative importance of predators and people in structuring and conserving ecosystems.Conserv Biol2011,25:646–647. 19. Allen BL:The effect of lethal control on the conservation values ofCanis
lupus dingo.InWolves: Biology, Conservation, and Management.Edited by Maia AP, Crussi HF. New York: Nova Publishers; 2012:79–108.
20. Valeix M, Hemson G, Loverage AJ, Mills G, Macdonald DW:Behavioural adjustments of a large carnivore to access secondary prey in a human-dominated landscape.J Appl Ecol2012,49:73–81.
21. Sidorovich VE, Tikhomirova LL, Jedrzejewska B:WolfCanis lupusnumbers, diet and damage to livestock in relation to hunting and ungulate abundance in northeastern Belarus during 1990–2000.Wildl Biol2003,9:103–111. 22. Treves A:Hunting for large carnivore conservation.J Appl Ecol2009,
46:1350–1356.
23. Chapron G, Miquelle DG, Lambert A, Goodrich JM, Legendre S, Clobert J:
The impact on tigers of poaching versus prey depletion.J Appl Ecol2008,
45:1667–1674.
24. Ritchie EG:The world’s top predators are in decline, and it’s hurting us too.The Conversation2014. 10th January 2014, accessed 11th January 2014: available at http://theconversation.com/the-worlds-top-predators-are-in-decline-and-its-hurting-us-too-21830.
25. Allen BL, Allen LR, Engeman RM, Leung LK-P:Intraguild relationships between sympatric predators exposed to lethal control: predator manipulation experiments.Frontiers in Zoology2013,10:39. 26. Corbett LK:The Dingo in Australia and Asia.2nd edition. Marleston: J.B.
Books, South Australia; 2001.
27. Allen BL, West P:The influence of dingoes on sheep distribution in Australia.Aust Vet J2013,91:261–267.
28. Stephens D:The molecular ecology of Australian wild dogs: hybridisation, gene flow and genetic structure at multiple geographic scales, PhD. Australia, Perth: The University of Western Australia; 2011.
29. Corbett LK:Canis lupus ssp. dingo. IUCN 2010. IUCN Red List of Threatened Species. Version 2010.4. www.iucnredlist.org. 2008.Downloaded on 20 April 2011. 30. Allen BL, Higginbottom K, Bracks JH, Davies N, Baxter GS:Balancing dingo
conservation with human safety on Fraser Island: the numerical and demographic effects of humane destruction of dingoes.Australas J Environ Manag. In press.
31. Fleming PJS, Allen BL, Allen LR, Ballard G, Bengsen AJ, Gentle MN, McLeod LJ, Meek PD, Saunders GR:Management of wild canids in Australia: free-ranging dogs and red foxes.InCarnivores of Australia: Past, Present and Future.Edited by Glen AS, Dickman CR. Collingwood: CSIRO Publishing; 2014.
32. Johnson C:Australia’s Mammal Extinctions: A 50 000 Year History.Melbourne: Cambridge University Press; 2006.
33. Wallach AD, Ritchie EG, Read J, O'Neill AJ:More than mere numbers: the impact of lethal control on the stability of a top-order predator.PLoS ONE2009,4:e6861.
34. Letnic M, Greenville A, Denny E, Dickman CR, Tischler M, Gordon C, Koch F:
Does a top predator suppress the abundance of an invasive
![Figure 1 Schematic representation of the six primary relationships of interest (R1–R6) between top-predator control and prey speciesat lower trophic levels (see [42]).](https://thumb-us.123doks.com/thumbv2/123dok_us/150467.27611/3.595.57.540.89.193/figure-schematic-representation-primary-relationships-predator-control-speciesat.webp)