Identification and Characterization of the Physiological Gene Targets
of the Essential Lytic Replicative Epstein-Barr Virus SM Protein
Jacob Thompson,aDinesh Verma,aDaJiang Li,aTim Mosbruger,bSankar Swaminathana
Division of Infectious Diseases, Department of Medicine,aand Huntsman Cancer Institute,bUniversity of Utah School of Medicine, Salt Lake City, Utah, USA
ABSTRACT
Epstein-Barr virus (EBV) SM protein is an essential lytic cycle protein with multiple posttranscriptional mechanisms of action. SM binds RNA and increases accumulation of specific EBV transcripts. Previous studies using microarrays and PCR have shown that SM-null mutants fail to accumulate several lytic cycle mRNAs and proteins at wild-type levels. However, the complete effect of SM on the EBV transcriptome has been incompletely characterized. Here we precisely identify the effects of SM on all EBV transcripts by high-throughput RNA sequencing, quantitative PCR (qPCR), and Northern blotting. The effect of SM on EBV mRNAs was highly skewed and was most evident on 13 late genes, demonstrating why SM is essential for infectious EBV produc-tion. EBV DNA replication was also partially impaired in SM mutants, suggesting additional roles for SM in EBV DNA replica-tion. While it has been suggested that SM specificity is based on recognition of either RNA sequence motifs or other sequence properties, no such unifying property of SM-responsive targets was discernible. The binding affinity of mRNAs for SM also did not correlate with SM responsiveness. These data suggest that while target RNA binding by SM may be required for its effect, specific activation by SM is due to differences in inherent properties of individual transcripts. We therefore propose a new model for the mechanism of action and specificity of SM and its homologs in other herpesviruses: that they bind many RNAs but only enhance accumulation of those that are intrinsically unstable and poorly expressed.
IMPORTANCE
This study examines the mechanism of action of EBV SM protein, which is essential for EBV replication and infectious virus pro-duction. Since SM protein is not similar to any cellular protein and has homologs in all other human herpesviruses, it has poten-tial importance as a therapeutic target. Here we establish which EBV RNAs are most highly upregulated by SM, allowing us to understand why it is essential for EBV replication. By comparing and characterizing these RNA transcripts, we conclude that the mechanism of specific activity is unlikely to be based simply on preferential recognition of a target motif. Rather, SM binding to its target RNA may be necessary but not sufficient for enhancing accumulation of the RNA. Preferential effects of SM on its most responsive RNA targets may depend on other inherent characteristics of these specific mRNAs that require SM for efficient ex-pression, such as RNA stability.
E
pstein-Barr virus (EBV) SM protein is an essential regulatory protein expressed by EBV during the lytic phase of replication (for reviews, see references1and2). SM protein is detectable after immediate early gene expression and prior to expression of other early gene products (3, 4). When the SM gene is insertionally inactivated in recombinant EBV genomes, the resultant virus is incapable of completing the lytic cycle and producing infectious virions (5,6). The exact reasons that SM is essential for lytic rep-lication and virus production have not been fully characterized. SM binds to RNA (7,8) and enhances accumulation of the mRNA transcripts from a wide variety of genes in cotransfection assays, but these results do not necessarily correlate with the dependence of EBV gene expression from the virus during reactivation from latency (9–12). Similarly, the relative binding affinity of EBV tran-scripts to SM has been assessed by immunoprecipitation of SM-bound mRNAs, and while preferential binding to specific tran-scripts was demonstrated, these have not been correlated to SM responsiveness during lytic replication (7). While several mecha-nisms of action have been proposed for SM’s ability to enhance mRNA accumulation, including roles in nuclear RNA stabiliza-tion and export (9,12–19), the exact nature of SM target gene specificity remains to be fully defined.A previous study described inefficient expression of a few late genes from recombinant EBV in which the SM gene had been
inactivated (20). We subsequently performed a study using an oligonucleotide hybridization array to compare lytic EBV gene expression in wild-type (WT) EBV and SM-deleted virus, which revealed a widespread decrease in EBV lytic gene expression in the absence of SM (6). However, the study was not highly quantita-tive, nor did the methodology allow strand-specific identification of all SM-dependent transcripts. We therefore performed a series of experiments using high-throughput RNA sequencing (RNA-Seq) combined with quantitative PCR (qPCR) and Northern blot-ting to more precisely define the physiological EBV mRNA targets of SM and establish the reasons that SM is essential for production of infectious EBV. We compared lytic gene expression between a
Received16 September 2015Accepted5 November 2015
Accepted manuscript posted online11 November 2015
CitationThompson J, Verma D, Li D, Mosbruger T, Swaminathan S. 2016.
Identification and characterization of the physiological gene targets of the essential lytic replicative Epstein-Barr virus SM protein. J Virol 90:1206 –1221. doi:10.1128/JVI.02393-15.
Editor:R. M. Longnecker
Address correspondence to Sankar Swaminathan, [email protected].
Copyright © 2016, American Society for Microbiology. All Rights Reserved.
on November 7, 2019 by guest
http://jvi.asm.org/
previously described recombinant⌬SM EBV (EBVBMLF1-KO) and
the parent WT SM EBV or⌬SM EBV rescued by exogenous SM expression. We thereby delineated the effects of SM on the EBV transcriptome during lytic reactivation and identified which EBV genes are most highly SM dependent. In addition to the major capsid protein and the gp350 glycoprotein genes that had been previously identified as SM targets (6,20), 11 other late lytic EBV transcripts were found to be highly SM dependent, demonstrating that the essential role of SM is primarily in enhancing late lytic transcript accumulation.
MATERIALS AND METHODS
Cells, plasmids, and DNA transfections. HEK293 cells carrying the WT-SM EBV bacmid (2089), expressing green fluorescent protein (GFP) and hygromycin resistance, were maintained as monolayer cultures in Dulbecco’s modified Eagle’s medium supplemented with 10% fetal bo-vine serum, 1% GlutaMAX supplement (Life Technologies), and 100
g/ml of hygromycin (21). Cloned HEK293 cells carrying an SM-null EBV bacmid (EBVBMLF1KO[5]) with the SM gene inactivated by insertion
of a kanamycin resistance gene (SM knockout [SMKO] cells), were main-tained in parallel. Raji is an EBV-positive human Burkitt’s lymphoma cell line (22) carrying a replication-defective EBV strain. Raji cells were grown in RPMI 1640 containing 10% fetal bovine serum (Gibco). Transfections of 293 cells were performed with TransIT293 reagent (Mirus) according to the manufacturer’s protocol. HeLa cell transfections were performed with Lipofectamine Plus reagent with 1.0g of total DNA in 6-well plates according to the manufacturer’s protocol (Invitrogen). All transfection mixtures were adjusted to contain equal amounts of DNA by addition of pCDNA3 vector plasmid (Invitrogen) as required and performed in trip-licate. SM, BMRF1, BSLF1, BALF5, BALF4, and BZLF1 (Z) expression vectors have been previously described (6, 9, 23). BBLF2/3, BBLF4, BALF2, and intron-containing BZLF1 expression vectors were con-structed by PCR amplification of the respective open reading frames (ORFs) from B95-8 DNA and cloned into pCDNA3.
Immunoblotting.Protein cell lysates were made from cells 48 h after transfection. Samples were analyzed by sodium dodecyl sulfate-polyacryl-amide gel electrophoresis (SDS-PAGE) and transferred to nitrocellulose membranes. Blots were probed with anti-Z (Argene), anti-BMRF1
(Cap-ricorn), anti-SM, or anti-BBLF2/3 (a kind gift from Tatsuya Tsurumi) polyclonal antibodies. The signal was visualized by incubation with horse-radish peroxidase-conjugated secondary antibody and chemiluminescent substrate (Bio-Rad) as previously described (10).
Measurement of viral DNA replication and infectious virus titers. Lytic EBV replication in 293 cells infected with either WT or SM knockout (SMKO) EBV was induced by transfection with Z expression plasmid and other plasmids as indicated. Cell pellets were harvested 60 h after transfection, and DNA was purified using a Qiagen blood DNeasy kit and used for mea-surement of EBV DNA copy number. Fifty nanograms of total cell DNA was analyzed by qPCR using EBV gene-specific primers (BILF2) to quantitate the viral genome copy number and was normalized to cellular GAPDH (glycer-aldehyde-3-phosphate dehydrogenase) DNA amounts. Infectious viral parti-cles were measured in cell supernatants at 5 days after induction of EBV replication. Cleared supernatants were filtered through 0.8-m-pore cellu-lose acetate filters, and serial dilutions of supernatants were used to infect Raji cells, which were incubated at 37°C. The numbers of GFP-positive Raji cells representing infectious EBV particles were easily visualized under a fluores-cence microscope at 2 days postinfection, and virus-infected cells were quan-titated by flow cytometry as previously described (6,31).
RNA isolation, qPCR, and Northern blotting.Total RNA was puri-fied from pellets of 293 and HeLa cells using QIAzol and miRNeasy col-umns (Qiagen) according to the manufacturer’s protocols. RNA was quantitated by spectrophotometry, 3 to 5g of total RNA was resolved on 1% denaturing agarose gels, and Northern blotting was performed as previously described (9). Gene-specific32P-labeled DNA probes were
generated using a random oligonucleotide labeling kit (Amersham), and membranes were hybridized with probes overnight at 65°C. The blots were washed, and the radioactive signal was visualized by phosphorimag-ing and autoradiography.
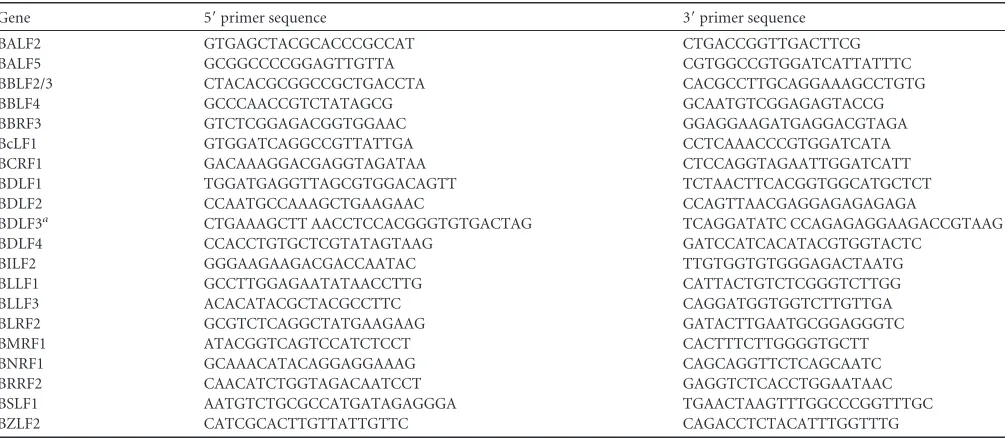
[image:2.585.42.546.76.295.2]qPCR was performed with a SYBR green PCR master mix (ABI) ac-cording to the manufacturer’s protocol using an Applied Biosystems StepOne Plus real-time PCR thermocycler. Poly(A) RNA was selected from total RNA using Oligotex mRNA kits (Qiagen). cDNAs were pre-pared with a high-capacity cDNA reverse transcription kit (Applied Bio-systems) using oligo(dT) primers. Controls with no template were in-cluded in each analysis. Each PCR amplification was performed in triplicate with gene-specific primers (Table 1). Cellular GAPDH was used as the endogenous control for all reactions.
TABLE 1Primers used for qPCR
Gene 5=primer sequence 3=primer sequence
BALF2 GTGAGCTACGCACCCGCCAT CTGACCGGTTGACTTCG
BALF5 GCGGCCCCGGAGTTGTTA CGTGGCCGTGGATCATTATTTC
BBLF2/3 CTACACGCGGCCGCTGACCTA CACGCCTTGCAGGAAAGCCTGTG
BBLF4 GCCCAACCGTCTATAGCG GCAATGTCGGAGAGTACCG
BBRF3 GTCTCGGAGACGGTGGAAC GGAGGAAGATGAGGACGTAGA
BcLF1 GTGGATCAGGCCGTTATTGA CCTCAAACCCGTGGATCATA
BCRF1 GACAAAGGACGAGGTAGATAA CTCCAGGTAGAATTGGATCATT
BDLF1 TGGATGAGGTTAGCGTGGACAGTT TCTAACTTCACGGTGGCATGCTCT
BDLF2 CCAATGCCAAAGCTGAAGAAC CCAGTTAACGAGGAGAGAGAGA
BDLF3a CTGAAAGCTT AACCTCCACGGGTGTGACTAG TCAGGATATC CCAGAGAGGAAGACCGTAAG
BDLF4 CCACCTGTGCTCGTATAGTAAG GATCCATCACATACGTGGTACTC
BILF2 GGGAAGAAGACGACCAATAC TTGTGGTGTGGGAGACTAATG
BLLF1 GCCTTGGAGAATATAACCTTG CATTACTGTCTCGGGTCTTGG
BLLF3 ACACATACGCTACGCCTTC CAGGATGGTGGTCTTGTTGA
BLRF2 GCGTCTCAGGCTATGAAGAAG GATACTTGAATGCGGAGGGTC
BMRF1 ATACGGTCAGTCCATCTCCT CACTTTCTTGGGGTGCTT
BNRF1 GCAAACATACAGGAGGAAAG CAGCAGGTTCTCAGCAATC
BRRF2 CAACATCTGGTAGACAATCCT GAGGTCTCACCTGGAATAAC
BSLF1 AATGTCTGCGCCATGATAGAGGGA TGAACTAAGTTTGGCCCGGTTTGC
BZLF2 CATCGCACTTGTTATTGTTC CAGACCTCTACATTTGGTTTG
aBDLF3 primers included HindIII and EcoRV sites for the 5=and 3=ends, respectively.
on November 7, 2019 by guest
http://jvi.asm.org/
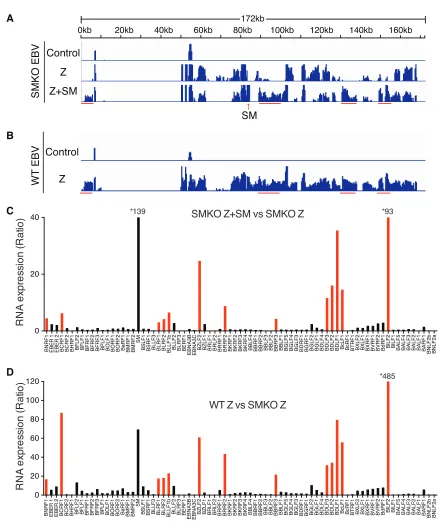
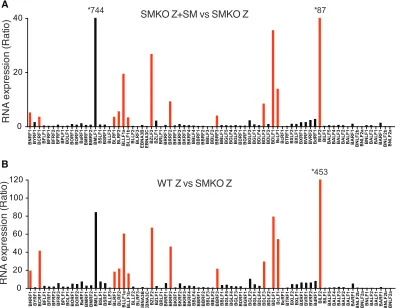
FIG 1Determination of SM-dependent gene expression during lytic EBV replication by RNA-seq analysis. (A) Transcriptome analysis of SMKO EBV-infected 293 cells transfected with either empty vector (Control), Z (to induce replication), or Z⫹SM. Cells were harvested at 48 h after transfection, and RNAs were analyzed by high-throughput RNA sequencing. Sequenced reads mapped to the EBV B95.8 genome on thexaxis are shown as normalized read counts on theyaxis. Red bars indicate clusters of SM-dependent genes whose expression was most highly increased in Z⫹SM-transfected samples compared to those transfected with Z alone. (B) Transcriptome analysis of WT EBV-infected 293 cells transfected with either empty vector (Control) or Z to induce lytic replication. Cells were harvested and analyzed as described for panel A above. Red bars indicate clusters of SM-dependent genes whose expression was increased in Z-transfected WT EBV RNA samples compared to Z-transfected SMKO EBV samples. (C) Differential expression of SM-dependent gene expression is shown as the ratio of RNA expression in SMKO EBV transfected with Z⫹SM versus SMKO Z alone. Genes whose expression is most highly dependent on SM are marked in red. Asterisks denote genes whose expression is above the upper limit of theyaxis. (D) Differential expression of SM-dependent gene expression is shown as the ratio of RNA expression in WT EBV transfected with Z versus SMKO transfected with Z alone. Genes whose expression is most highly dependent on SM are marked in red.
on November 7, 2019 by guest
http://jvi.asm.org/
[image:3.585.70.509.54.585.2]RNA sequencing and data analysis.Total RNAs were isolated using the Qiagen miRNeasy kit. Unfractionated RNA (1.5g) was used for RNA sequencing at the Microarray and Genomic Analysis Core Facility, Hunts-man Cancer Institute, University of Utah. A Ribo-zero kit was used to remove rRNA from total RNA, and libraries were constructed according to the manufacturer’s procedure using Illumina TrueSeq kits and verified using an Agilent bioanalyzer. cDNA libraries were sequenced using HiSeq 101 Cycle Paired-End Sequencing v4 using an Illumina Hiseq 2000 instru-ment. Reference fasta files were generated by combining the standard chromosome sequences from hg19 and the EBV sequence from NCBI referenceV01555.2. Ensembl transcript annotations for hg19 were com-bined with the B95-8 EBV annotations listed in NCBI referenceV01555.2. Gene annotations were created by merging transcripts with the same gene identifier. All possible splice junction sequences from each gene’s tran-scripts were generated using USeq’s MakeTranscriptome application us-ing a radius of 46 (24). These splice junction sequences were added to the combined hg19 and EBV sequences and run through novoindex (v2.8) to create the RNA-Seq reference index.
Reads were aligned to the transcriptome reference index described above using Novoalign (v2.08.01), allowing up to 50 alignments for each read. USeq’s SamTranscriptomeParser application was used to select the best alignment for each read and convert the coordinates of reads aligning to splices back to genomic space.
Differential gene expression was measured using USeq’s DefinedRegion-DifferentialSeq application. Briefly, the numbers of reads aligned to each gene annotation were calculated. The counts were then used in DESeq2, which normalizes the signal and determines differential expression (25).
RSEM indexes were created using rsem-prepare-reference (v1.2.19) with the bowtie option (v1.0.1). The expression of each transcript was calculated using rsem-calculate-expression using the option –forward-prob 0. Differential expression was determined using EBSeq (v1.6) with the “MedianNorm” normalization method (26,27).
Identification of potential transcription factor binding sites in the pro-moter of genes was performed using PROMO (28). Identification of splic-ing factor bindsplic-ing sites in transcripts was performed ussplic-ing SFmap (29). Motif searches were performed using the MEME suite of RNA sequence analysis tools (30).
ChIP assays.Chromatin immunoprecipitation (ChIP) assays were performed with P3HR1-ZHT lymphoma cells that contain the EBV BZLF1 gene fused to the hormone binding domain of the estrogen
recep-tor that allows induction of virus replication by 4-hydroxytamoxifen (4-HT) treatment (7). Twenty-five million cells were harvested at 48 h after tamoxifen treatment and washed with cold phosphate-buffered saline (PBS) containing protease inhibitor cocktail (Sigma), and ChIP assays were performed exactly as described previously (31). Briefly, cells were fixed with formaldehyde, and DNA was sheared by sonication, precleared with rabbit IgG, and immunoprecipitated with SM polyclonal antibodies. Immunoprecipitated DNA was purified using the Qiaquick PCR Purifi-cation kit (Qiagen) and sequenced at the Microarray and Genomic Anal-ysis Core Facility, Huntsman Cancer Institute, University of Utah. DNA libraries were constructed from the ChIP DNA and input samples using the ChIP-Seq DNA sample prep kit (Illumina, San Diego, CA). Libraries were sequenced with single-end reads of 50 cycles on an Illumina HiSeq2000 platform, and sequence reads were analyzed and mapped to the type 2 EBV genome (DQ279927) and the human genome (hg19).
RESULTS
Identification of EBV SM-dependent RNA expression during
EBV replication.In order to define the role of EBV SM protein in
EBV replication and RNA expression, we compared EBV RNA
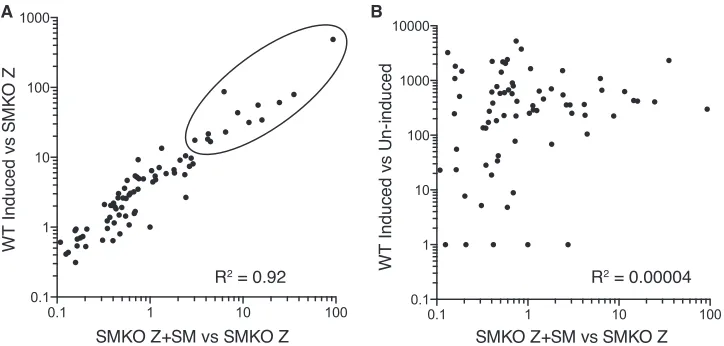
[image:4.585.112.474.66.239.2]FIG 2Correlation of SM-dependent gene expression between WT and SMKO EBV during replication. (A) SM-responsive gene expression correlation is shown as the ratio of RNA expression in the presence of SM versus its absence. Thexaxis shows the ratio of RNA expression in SMKO EBV transfected with Z⫹SM versus SMKO Z alone. Theyaxis shows the ratio of RNA expression in WT EBV transfected with Z alone versus SMKO transfected with Z⫹SM. The most highly SM-dependent genes are circled. (B) Lack of correlation between the most highly induced lytic genes and SM-dependent genes. Thexaxis shows the ratio of RNA expression in SMKO EBV transfected with Z⫹SM versus SMKO Z alone (fold SM enhancement). Theyaxis shows the ratio of RNA expression in WT EBV induced versus uninduced.
TABLE 2Most-highly SM-upregulated genesa
Gene Function
BILF2 Probable membrane glycoprotein BDLF1 Minor capsid protein
BZLF2 gp42
BDLF2 Tegument protein
BcLF1 Major capsid protein
BDLF3 gp150
BRRF2 Tegument protein?
BLLF1b gp220 (gp350)
BCRF1 Viral interleukin 10 BNRF1 Major tegument protein
BBRF3 Glycoprotein M
BLRF2 Tegument protein? BLRF1 Membrane glycoprotein gN
aAll genes listed belong to the late temporal class.
on November 7, 2019 by guest
http://jvi.asm.org/
[image:4.585.298.545.567.715.2]expression during lytic EBV replication in the presence and in the absence of SM protein. EBV enters the lytic phase of replication in 293 cells when induced by transfection with a plasmid expressing the Z immediate early EBV transcriptional activator (Zta, BZLF1). We compared gene expression of cells infected with either SMKO or WT EBV after induction of lytic replication by Z transfection. Deep sequencing of RNA derived from 293 cells infected with either SMKO or WT EBV undergoing lytic replication was per-formed. In order to rescue SM expression, SMKO cells were trans-fected with SM expression vector in addition to Z. As shown inFig. 1A andB, robust lytic RNA expression was observed in both
SMKO and WT cells after induction of lytic replication. However, when SMKO EBV was rescued with SM transfection, it expressed higher levels of RNA in certain specific regions of the EBV genome than did SMKO EBV induced with Z alone. As shown inFig. 1B, WT SM EBV also shows much higher levels of transcription from the same regions that are enhanced by SM rescue. A detailed com-parison of the transcriptomes of SMKO virus and of SM-rescued SMKO was generated by mapping the RNA sequencing reads to all known EBV genes and is shown inFig. 1C. Overall, the majority of EBV lytic genes were expressed at slightly higher levels in the pres-ence of SM. However, 13 genes were highly upregulated (5- to
A
B
RQ
RQ
RQ
RQ
C Z C Z
Z +S M 0 1000 2000 3000 4000 0 500 1000 1500
BILF2
WT SMKOC Z C Z
Z +SM
0 1000 2000 3000 4000 0 500 1000 1500
BcLF1
WT SMKOC Z C Z
Z +S M 0 2000 4000 6000 8000 0 200 400 600 800
BLLF1
WT SMKOC Z C Z
Z +S M 0 200 400 600 800 1000 0 200 400 600 800
BALF2
WT SMKOC Z C Z
Z +S M 0 2000 4000 6000 0 200 400 600 800
BCRF1
WT SMKOC Z C Z
Z +S M 0 200 400 600 0 10 20 30 40 50
BRRF2
WT SMKOC Z C Z
Z +S M 0 500 1000 1500 2000 2500 0 50 100 150 200 250
BBRF3
WT SMKOC Z C Z
Z +S M 0 500 1000 1500 2000 0 50 100 150
BDLF4
WT SMKOC Z C Z
Z +S M 0 2000 4000 6000 0 1000 2000 3000 4000
BDLF1
WT SMKOC Z C Z
Z +S M 0 2000 4000 6000 0 1000 2000 3000 4000
BDLF2
WT SMKOC Z C Z
Z +S M 0 2000 4000 6000 0 200 400 600
BLRF2
WT SMKOC Z C Z
Z +S M 0 500 1000 1500 2000 0 50 100 150 200 250
BLLF3
WT SMKOC Z C Z
Z +S M 0 500 1000 1500 0 20 40 60 80 100
BZLF2
WT SMKOC Z C Z
Z +S M 0 2000 4000 6000 8000 0 1000 2000 3000 4000
BDLF3
WT SMKOC Z C Z
Z +S M 0 50 100 150 200 250 0 100 200 300 400
BNRF1
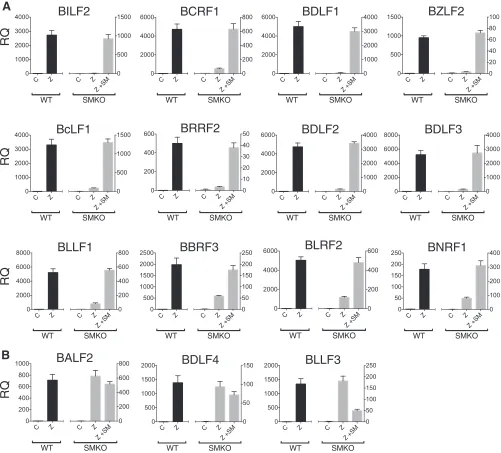
WT SMKOFIG 3Verification of SM-dependent and -independent gene expression by RT-qPCR. Polyadenylated RNA was isolated from 293 cells infected with WT EBV or SMKO EBV during lytic replication. Cells were transfected with either empty vector (C), Z plasmid (Z), or Z⫹SM plasmids as indicated, and RNA was harvested 48 h after transfection. The expression of specific mRNAs was measured by RT-qPCR. The relative quantity (RQ) of specific RNAs in WT EBV-infected (shown in black, aligning to the leftyaxis) and SMKO-infected (shown in gray and aligning to the rightyaxis) cells is shown in each figure. (A) Abundance of 12 highly SM-dependent gene transcripts was measured by qPCR. (B) A similar analysis was performed to measure the effect of SM on abundance of SM-independent or SM-downregulated transcripts.
on November 7, 2019 by guest
http://jvi.asm.org/
[image:5.585.43.544.68.521.2]93-fold) by SM and were poorly expressed in its absence. We also compared gene expression between WT and SMKO viruses after induction of lytic replication as shown inFig. 1D. Although lytic gene expression was more robust in WT EBV, there was neverthe-less almost complete correlation between the most SM-upregu-lated genes in rescued SMKO virus and WT virus (Fig. 2A), further confirming the gene specificity of SM effects on RNA abundance. The most highly SM-upregulated genes (⬎15-fold increased in WT compared to SMKO) along with their temporal class and known functions are shown inTable 2. The most highly SM-de-pendent genes were located throughout the genome. However, several of these genes were clustered together, such as BLRF1-2 and BDLF1-3. Importantly, the highly SM-dependent gene set includes the major viral capsid protein VCA and gp350, the gly-coprotein required for binding to CD21 on the surface of B cells. In addition, several other glycoproteins and tegument proteins were highly upregulated by SM, demonstrating that SM is essen-tial for various steps of EBV assembly, release, and infectivity ( Ta-ble 2). Interestingly, all SM-dependent RNAs were late lytic cycle RNAs. Thus, the effect of EBV SM on EBV gene regulation is different from that of its homolog Kaposi’s sarcoma-associated herpesvirus (KSHV) ORF57, since ORF57 increases both early and late lytic RNA accumulation as recently shown (32). Since EBV late gene transcription is dependent on DNA replication, this raised the possibility that SM effects on these genes were primarily due to enhanced DNA replication in the presence of SM, although no early genes required for DNA replication were particularly SM dependent (Fig. 1C andD). However, comparison of the most highly induced lytic genes in WT EBV with the most SM-depen-dent genes showed little correlation, demonstrating that the ef-fects of SM on these genes is not due to a global effect on late gene expression (Fig. 2B).
In order to confirm the findings of the RNA-seq experiments and to obtain more-precise quantitation of the effects of SM on RNA accumulation, we performed qPCR to measure mRNA levels using oligo(dT)-selected RNA from the samples used for RNA sequencing. The results of qPCR for individual transcripts were highly consistent with the findings of RNA-seq analysis (Fig. 3). In addition, we compared gene expression in several genes whose expression was either unaffected or downregulated by SM, and these results also correlated well with the RNA-seq analysis (Fig. 3B). While antibodies to most of the SM-dependent genes are not available, we and others have shown that both gp350 and VCA proteins are upregulated by SM, indicating that RNA levels of SM-enhanced genes likely correlate with increased protein expres-sion (6,20).
Characteristics of target mRNAs that are SM dependent.
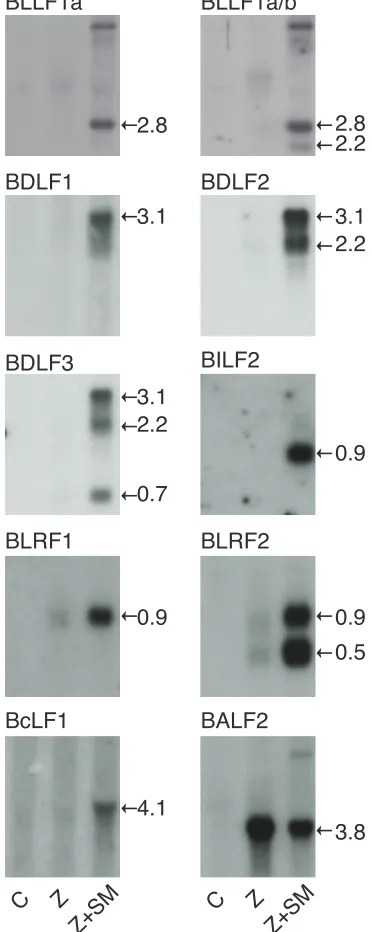
Be-cause several SM-dependent genes were contiguously encoded in the EBV genome, it was possible that they were coordinately reg-ulated and that SM was affecting such a process. Although several such genes have been annotated as being coterminally polyadenyl-ated (human herpesvirus 4 complete wild-type genome NCBI ref-erence sequenceNC_007605.1), there was no experimental evi-dence to confirm the structure of their transcripts. We therefore performed Northern blotting to investigate the effect of SM on various potential mRNA isoforms and to determine which con-tiguous transcripts utilized a common termination and polyade-nylation signal. As shown inFig. 4, Northern blotting indicated that while BDLF1, BDLF2, and BDLF3 are generated from indi-vidual promoters, they are coterminally polyadenylated. A similar
pattern was observed with BLRF1 and BLRF2. However, the BILF2 mRNA was a single species of approximately 0.9 kb, indi-cating that it is separately cleaved and polyadenylated from up-stream BILF1 transcripts. As has been previously demonstrated, gp350 (BLLF1a) and gp220 (BLLF1b) are alternatively spliced
FIG 4Analysis of SM-dependent and -independent gene expression by Northern blotting. 293 SMKO EBV-infected cells were transfected with either empty vector (C), Z alone, or Z⫹SM, and RNA was isolated at 48 h after transfection and analyzed by Northern blotting using gene-specific probes. An approximate calculated size (in kilobases) of each mRNA is shown to the right of each panel. For BDLF1-3 and BLRF1-2, overlapping transcripts are detected by downstream probes. For example, the BDLF3 probe detects BDLF3 (0.7 kb) as well as BDLF2 (2.2 kb) and BDLF1 (3.1 kb) mRNAs. BLLF1b (gp220) is formed by splicing to remove an intron that is retained in BLLF1a (gp350). A probe corresponding to the intron was used to detect BLLF1a, and an exon probe (BLLF1a/b) was used to detect both isoforms.
on November 7, 2019 by guest
http://jvi.asm.org/
[image:6.585.329.515.71.537.2]from the BLLF1 transcript. Accumulation of both isoforms was increased by SM, as shown by use of a probe specific for BLLF1a versus a probe for an exon common to both isoforms. In addition, we measured the transcript abundance of VCA (BcLF1) and an SM-independent gene (BALF2) by Northern blotting, which con-firmed the RNA-seq and qPCR findings.
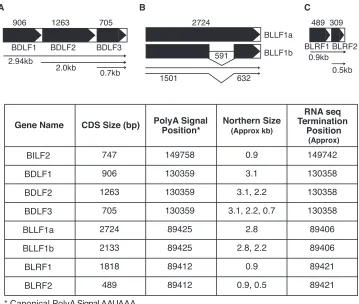
In order to confirm the sites of cleavage and polyadenylation indicated by Northern blotting, we examined the RNA-seq data to identify reads with sequential adenosine residues that did not map to the EBV genome, localizing the sites of poly(A) addition. The predicted sites of cleavage and polyadenylation revealed by North-ern blotting, examination of RNA-seq read density, and poly(A) sequence identification are shown inFig. 5. These complex mRNA processing patterns result in overlapping transcripts for BLRF1 and BLRF2. Similarly, BDLF1, BDLF2, and BDLF3 are processed to yield a ladder of overlapping transcripts (Fig. 4). This could therefore result in overrepresentation of downstream transcripts in the RNA-seq analysis because transcripts originating from up-stream promoters would include downup-stream ORFs. For exam-ple, reads mapped to BDLF3 would include those from overlap-ping BDLF2 and BDLF3 transcripts. The qPCR measurements would be potentially susceptible to the same inflation of down-stream transcript abundance. We therefore reexamined the RNA-seq data after reannotating the EBV genome to correct the tran-scription termination sites based on our mapping as shown inFig. 5. The software uses an expectation maximization algorithm to
estimate the abundance of isoforms and fractionally assigns reads to the various isoforms (see Materials and Methods for details). The results of such an analysis are shown inFig. 6. While the estimates of differential expression in the presence or absence of SM differed somewhat in magnitude from the previous direct-read assignments, the most highly SM-enhanced transcripts re-mained essentially the same, consisting of the genes described in
Table 2.
Target gene coding sequence is important for SM-dependent
gene expression.These data indicated that while some
SM-de-pendent genes are coterminally polyadenylated, the majority are not and that effects on polyadenylation were unlikely to be the sole basis of SM responsiveness. To determine if the coding regions of these genes separated from their native promoters and polyade-nylation signals were still responsive to SM protein, we performed a series of cotransfection assays in which the open reading frames of several SM-responsive genes were cloned in a cytomegalovirus (CMV) promoter-driven plasmid with a heterologous bovine growth hormone-derived polyadenylation signal. As shown in
Fig. 7, SM-responsive gene transcripts were poorly expressed in the absence of SM and showed robust responses to SM expression. While the responsiveness of the coding region RNAs to SM does not rule out other transcriptional or posttranscriptional SM mechanisms in the viral context, it supports the model that SM effects on contiguous transcripts and coterminal transcripts are not promoter or polyadenylation mediated.
FIG 5Gene structure of SM-dependent transcripts by Northern blotting and RNA-seq during lytic replication. The coding domains of BDLF1-3 (A), BLLF1a-b (B), and BLRF1-2 (C) are shown with arrowheads. The approximate calculated size of each transcript is shown in each panel. The gene name with coding domain size, the location of the putative canonical polyadenylation signal, and the transcript size predicted by Northern blotting and deep sequencing are shown in the table. All genes used the canonical polyadenylation signal, AAUAAA.
on November 7, 2019 by guest
http://jvi.asm.org/
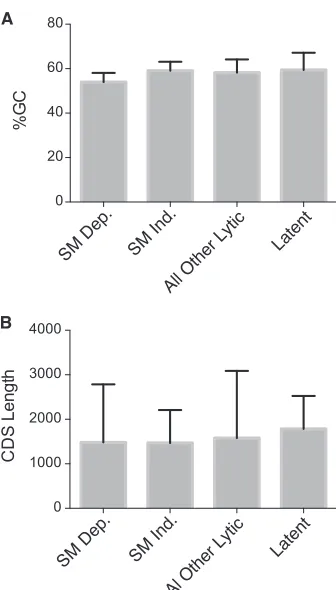
[image:7.585.114.473.64.368.2]In order to determine whether there were distinctive aspects of the coding sequences of the most SM-dependent genes, we first compared the content of SM-dependent genes versus the overall GC content of the EBV genome and a reference set of SM-inde-pendent genes (Fig. 8A). It has been suggested that one basis for the gene specificity of the KSHV SM homolog ORF57 is the GC content of its target genes (33). While the SM-dependent gene set had a slightly lower GC content than the comparator sets of SM-independent genes, all other lytic genes, or latent genes, the aver-age values were not overtly different (Fig. 8A). The overall GC content of the SM-dependent genes was 53.97⫾4.14, and that of the SM-independent genes was 59.12⫾4.01. Since the choice of mRNA export pathways for intronless mRNAs and stability can be influenced by gene length (34), we also compared the average length of SM-dependent genes with that of the other lytic genes (Fig. 8B). Although there was significant variation in gene length in both SM-dependent and -independent gene sets, the average gene length was similar.
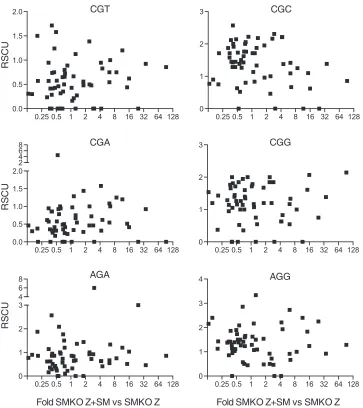
Atypical codon usage in rhesus rhadinovirus (RRV) has been correlated with differences in mRNA stability and dependence on ORF57, the RRV homolog of SM (35,36). In order to assess codon usage in SM-dependent versus SM-independent genes, we used the CAIcal toolset (37) and calculated relative synonymous codon usage (RSCU) for each coding sequence of SM-dependent genes and the comparison set of SM-independent genes. The RSCU is
expressed as percentages of the different synonymous codons used for each amino acid. For example, there are four synonymous valine codons. The relative use of each of the four valine codons in each gene can be determined, and any biases in RSCU between two sets of genes can be determined. We performed such an anal-ysis and found that the largest differences in RSCU between SM-dependent and -inSM-dependent genes were in the use of two arginine codons. We then asked if there was any correlation between SM dependence and the RSCU of the six arginine codons. As shown in
Fig. 9, there was no clear relationship between arginine RSCU and SM responsiveness.
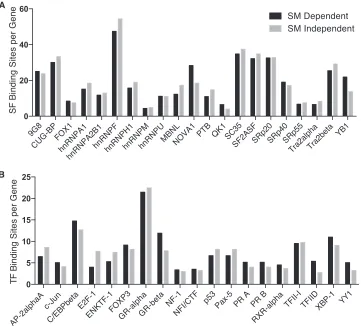
We have previously shown that SM recruits the cellular splicing factor SRSF3 (SRp20) to cellular mRNAs and modulates their splicing (19,38). Splicing factors may also be involved in regulat-ing viral mRNA export and stability (15,39,40). We therefore examined the sequences of SM-dependent and SM-independent EBV mRNAs for the presence of splicing factor binding sites that are overrepresented in SM-dependent genes using the SFmap pro-gram for prediction of splicing factor binding sites (29). Splicing factors that were predicted to bind to all SM-dependent genes were identified, and the average number of binding sites per gene for each splicing factor was determined. A similar analysis was conducted for the SM-independent gene set. There were no sig-nificant differences in the binding site density for any splicing
FIG 6Comparison of EBV RNA transcriptome in the presence or absence of SM analyzed with an expectation maximization algorithm. (A) SM-dependent gene expression is shown as the ratio of RNA expression in SMKO EBV transfected with Z⫹SM versus SMKO Z alone. Genes whose expression is most highly dependent on SM are marked in red. Read assignment and differential expression analysis were performed using EBSeq with the MedianNorm normalized method. (B) Differential expression of SM-dependent gene expression is shown as the ratio of RNA expression in WT EBV transfected with Z versus SMKO Z alone. SM-dependent genes are marked in red as described above. Asterisks denote genes whose expression is above the upper limit of theyaxis.
on November 7, 2019 by guest
http://jvi.asm.org/
[image:8.585.95.498.68.376.2]factor between SM-dependent and SM-independent genes (Fig. 10A).
In order to ask if there were any motifs that could be identified by an unsupervised screen for overrepresented nucleotide motifs in the coding sequences and predicted 5=and 3=untranslated re-gions (UTRs) of SM-dependent genes, we used the MEME pro-gram in discriminative mode, which allows the comparison of sets of RNA sequences to control sets in order to identify potential RNA motifs that are enriched in the gene set of interest (30). While it was possible to identify position-specific weight matrices (PSWMs) that statistically were enriched in the SM-dependent gene set (data not shown), these PSWMs were not highly specific for SM-dependent genes and could be identified in a significant number of SM-independent genes, suggesting that SM interaction with such sites was unlikely to be asine qua nonof SM responsive-ness.
Finally, although we have previously demonstrated that SM responsiveness of both EBV and heterologous genes can be dem-onstrated to operate in a promoter-dependent fashion and that transcriptional initiation is not affected by SM for certain individ-ual promoters (9), it remained possible that specific characteris-tics of some EBV promoters could confer SM upregulation by transcriptional mechanisms. We therefore analyzed the occur-rence of transcription factor binding sites in the promoter regions of the SM-dependent and -independent gene sets. The prevalence of the most common transcription factors in the promoters of both sets of genes was virtually identical (Fig. 10B), indicating that interaction with specific transcription factors is unlikely to be in-volved in gene regulation by SM.
The quantitative effect of SM on lytic transcripts is highly
gene dependent.The quantitative effect of SM on lytic transcripts
was highly gene dependent as demonstrated by the variation in the magnitude of its effect on individual genes. While approximately one-half of EBV genes either did not change or decreased slightly in the presence of SM, of the remaining genes, 13 genes were much more highly responsive (Fig. 2A). The degree of inequality of this effect can be globally described by the Lorenz curve, used in eco-nomics and ecology to measure inequality in wealth or size (41). If all individuals are the same size, the Lorenz curve is a straight diagonal line, the line of equality. If there is any inequality in size, then the Lorenz curve falls below the line of equality (Fig. 11A). The total amount of inequality can be summarized by the Gini coefficient, which is the ratio between the area enclosed by the line of equality and the Lorenz curve (A) and the total triangular area under the line of equality (A⫹B). Thus, if every EBV gene were equally upregulated by SM, the Gini coefficient would be 0, whereas if only one gene were upregulated by SM, the Gini coef-ficient would be 1. A calculation of the Gini coefcoef-ficient for the SM effect on all lytic genes is shown inFig. 11B. As can be seen, the effect of SM on the entire lytic transcriptome is quite dispropor-tionate and corresponds to a Gini coefficient of 0.79. Interestingly, the effect of ORF57 on the lytic KSHV transcriptome that we
BLLF1
2.8 1.7
1.5
BDLF1
1.2
BDLF3
1.1 BDLF2
1.6
C SM BLRF2
0.8 BILF2
1.0
BBRF3
1.5
C SM
FIG 7The coding domain of each gene was cloned into pCDNA3 expression vector and transfected into HeLa cells with either empty vector (C) or SM. RNAs were analyzed by Northern blotting using gene-specific probes, as shown above each panel. An approximate calculated size (in kilobases) of each mRNA is shown to the right of each panel.
FIG 8Comparison of GC content and coding domain sequence (CDS) length between SM-dependent, SM-independent, and all other lytic and latent EBV genes. (A) The CDSs of known EBV genes were analyzed for their percent GC content. These were grouped into the top 13 most highly SM-dependent genes (3- to 93-fold upregulation) (SMKO Z⫹SM versus SMKO Z), 13 independent genes (between 0.6- and 1.14-fold upregulation), all other lytic genes, and latent genes. The average GC content (shown as a percentage) is shown. (B) Average CDS lengths of EBV genes, grouped into the four categories as de-scribed above, are shown.
on November 7, 2019 by guest
http://jvi.asm.org/
[image:9.585.337.505.62.357.2] [image:9.585.94.236.67.330.2]recently described (32) is significantly less gene preferential, with a calculated Gini coefficient of 0.5.
Relationship of SM to EBV lytic DNA replication.We have
previously shown that lytic EBV DNA replication is impaired in the absence of SM (6). This relative deficiency in DNA replication in SMKO virus had been attributed to relatively poor expression of DNA polymerase and primase, and DNA replication was par-tially rescued by overexpression of these two genes (6). However, in the current analysis, using more-quantitative methods and pre-cise techniques, mRNA accumulation of the 6 genes required for replication of the EBV lytic replication origin (oriLyt) was not found to be highly SM dependent (Fig. 1CandD). Nevertheless, as shown inFig. 12A, when DNA replication was measured by qPCR, it was moderately deficient in SMKO virus and was significantly enhanced by SM expression. Close examination of RNA-seq and qPCR data revealed that while the mRNAs for the six genes re-quired for oriLyt replication (BALF2, BALF5, BMRF1, BBLF2/3, BBLF4, and BSLF1) were expressed relatively efficiently without SM, some were nevertheless expressed at somewhat higher levels
in the presence of SM. It thus appeared possible that the additive effect of SM on these six replicative gene products could account for the increase in DNA replication seen with SM. To test this hypothesis, we exogenously expressed the six genes previously shown to be necessary for oriLyt replication (42,43), along with Z, in SMKO virus-infected cells to ask whether this could rescue DNA replication. We compared DNA replication in these cells to DNA replication when SM and Z alone were transfected. As shown inFig. 12A, transfection of the six genes with Z was not completely effective in rescuing DNA replication compared to Z⫹SM. As expected, despite partial rescue of DNA replication (approximately 50%) by cotransfection of replication genes, in-fectious virion production was undetectable in the absence of SM (Fig. 12B), again demonstrating the key role of SM in late gene expression. In order to confirm that accumulation of the mRNAs for the 6 replication genes was adequate and comparable to that induced by SM, we performed qPCR of RNA from the six gene transfections and compared replicative gene RNA accumulation to that in SM-transfected cells. As shown inFig. 12C, in every case, 0.25 0.5 1 2 4 8 16 32 64 128
0.0 0.5 1.0 1.5
2.0 CGT
0.25 0.5 1 2 4 8 16 32 64 128 0.0
0.5 1.0 1.5 2.02 4 6
8 CGA
0.25 0.5 1 2 4 8 16 32 64 128 0
1 2 3 4 6 8
Fold SMKO Z+SM vs SMKO Z AGA
0.25 0.5 1 2 4 8 16 32 64 128 0
1 2
3 CGC
0.25 0.5 1 2 4 8 16 32 64 128 0
1 2
3 CGG
0.25 0.5 1 2 4 8 16 32 64 128 0
1 2 3 4
Fold SMKO Z+SM vs SMKO Z AGG
RS
CU
RS
CU
RS
CU
FIG 9Relationship between codon usage and SM dependence of lytic gene expression. Correlation between relative synonymous codon usage (RSCU,yaxis) and the ratio of gene expression in the presence versus absence of SM (xaxis). All six of the codons used for arginine are shown in their respective graphs.
on November 7, 2019 by guest
http://jvi.asm.org/
[image:10.585.112.475.64.472.2]expression of each replicative gene mRNA was actually greater than that in SM-transfected cells. These data suggested that SM may be directly or indirectly required in some other manner for efficient lytic EBV DNA replication. We also compared protein expression of BMRF1 and BBLF2/3, two of the six genes for which antibodies are readily available. Expression of both of these pro-teins in the six gene transfections was also greater than that seen when Z alone was transfected (Fig. 12D), consistent with the qPCR data.
The Zta protein binds directly to oriLyt and is required for initiation of lytic origin replication (43,44). Although Z was ex-pressed from exogenously transfected plasmid with a strong CMV promoter in all cases, we asked whether Z expression was compa-rable when SM was present and when SM was absent. Western blotting revealed comparable Z protein expression in the presence and absence of SM and where the six replication genes were trans-fected (Fig. 12D). In addition, the EBV Rta protein, which is not essential for triggering entry into the lytic cycle, is transcription-ally activated by Zta, binds to the oriLyt enhancer region, and is required for oriLyt initiation (42,43). We therefore also compared the expression of Rta in all cases in the experiment above. Immu-noblotting for Rta demonstrated that, similar to Zta, Rta was ex-pressed efficiently and comparably once lytic replication was
in-duced and was not impaired in the absence of SM (data not shown). These data therefore suggest that SM may be directly or indirectly enhancing oriLyt DNA replication by other mecha-nisms besides enhancing transcript abundance of the core repli-cation proteins.
SM affects BHRF1 and BHLF1 mRNA accumulation during
lytic replication.Transcription in the region of oriLyt is required
for efficient lytic origin usage (45). BHLF1 RNA transcribed from a divergent promoter region that is required for BHLF1 and BHRF1 transcription has been shown to form RNA-DNA hybrids that are required for BALF2 (ssBP) recruitment to oriLyt and fa-cilitate oriLyt initiation incis. In addition, BHRF1 RNA transcrip-tion may partially substitute for the requirement for BHLF1 RNA (45). We therefore examined the effect of SM on transcription in this region. Analysis by RNA-seq of transcript abundance in the region of oriLyt in the presence or absence of SM revealed that when SM was expressed, transcript accumulation of both BHRF1 and BHLF1 was actually significantly decreased compared to the levels observed when SMKO virus was induced to replicate with-out SM rescue (Fig. 13). The decrease was particularly notable for BHRF1; however, BHLF1 transcript abundance was also de-creased by more than 50%. Therefore, the dede-creased DNA repli-cation seen without SM rescue, despite provision intransof all 6
FIG 10Comparison of predicted splicing factor and transcription factor binding sites between SM-dependent and -independent genes. (A) Average number of predicted splicing factor binding sites per gene in either the top 13 most highly SM-responsive (3- to 93-fold upregulation) (SMKO Z⫹SM versus SMKO Z) or 13 SM-nonresponsive (0.6 to 1.14-fold upregulation) genes. (B) Average number of predicted transcription factor binding sites for 13 SM-responsive and -nonresponsive genes (described above). Thexaxis indicates the transcription factors selected (due to their presence in all 13 SM-dependent genes) in this analysis.
on November 7, 2019 by guest
http://jvi.asm.org/
[image:11.585.113.474.66.392.2]replication genes, cannot be attributed to an SM enhancing effect on BHRF1 or BHLF1 RNA.
SM-specific DNA binding to the EBV genome is not
detect-able during replication.Because we were unable to fully rescue
EBV DNA replication without SM even by expressing higher levels of replication gene RNAs, we considered the possibility that SM might directly interact with oriLyt. The concept that RNA binding proteins may also interact functionally with DNA has been but-tressed by the recent demonstration that the SM homolog KSHV ORF57 binds specifically to several sites in the KSHV genome (46). We therefore performed ChIP for SM using robustly induc-ible EBV-positive P3HR1-ZHT lymphoma cells. Cells were treated with 4-hydroxytamoxifen (4-HT) to induce lytic replica-tion, and 48 h after inducreplica-tion, cells were analyzed by ChIP using polyclonal SM antibody. Input DNA and immunoprecipitated DNA were purified and analyzed by high-throughput sequencing. The results shown inFig. 14Ademonstrate no SM-specific bind-ing to the EBV genome durbind-ing lytic replication. This indicates that direct SM binding to oriLyt or other regions of the EBV genome is
not the mechanism by which it enhances DNA replication. Inter-estingly, however, there was a strong region of SM binding to human chromosome 11 (Fig. 14B) between nucleotides at kb 114475 and kb 114496. This approximately 21-kb intergenic re-gion lies between the NXPE4 and NXPE2 genes and contains highly repetitive motifs of 45 nucleotides (nt) each. Although the functional significance, if any, of this robust binding to the human chromosome remains to be determined, it nevertheless indicates that the ChIP assay performed as expected and that there is no significant binding of SM to the EBV genome that may enhance EBV lytic replication.
DISCUSSION
SM and its homologs in other herpesviruses, such as KSHV ORF57, hCMV UL69, and HSV ICP27, are all essential for lytic replication and virus production and act by enabling efficient viral mRNA expression (5,9,47–49). However, in areas where they have been tested, they are incapable of cross-complementing each other’s function and rescuing replication (5,49,50), suggesting different target specificities even if they share mechanisms of ac-tion. Identifying the precise physiological target mRNAs of SM during EBV replication and the specificity and magnitude of its effects on individual mRNAs is necessary for further understand-ing its function. Here we have quantitatively measured the effect of SM on all EBV lytic gene transcripts and demonstrate that while SM increases accumulation of many EBV mRNAs, its effect is highly specific and skewed toward a subset of late lytic genes. In addition to the previously described effect on gp350 and VCA, we identify 11 additional mRNAs that are highly SM dependent. De-spite extensive analysis, SM-dependent transcripts were not dis-tinguishable from SM-independent RNAs by sequence character-istics or affinity for SM. These findings suggest that while SM may interact preferentially with some RNAs, the basis for preferential enhancement of some RNAs depends on intrinsic differences in the expression competence of these viral mRNAs.
The basis of the mechanism of action and specificity of SM and its homologs in other herpesviruses has been a matter of consid-erable debate and investigation. Differential GC content, the pres-ence of specific RNA motifs in responsive transcripts, atypical codon usage, and differential transcriptional activation have all been proposed to explain specificity of action of SM homologs (33,36,46,51–53). Our data demonstrate that while the basis for SM responsiveness does appear to reside in the coding sequences of the relevant genes, there is no clear relationship of the SM effect to any of the above characteristics in the SM-dependent gene set. The gene specificity is therefore unlikely to depend on a relatively simple SM binding site shared among its targets. One or more structural RNA motifs that are not strictly sequence defined may be one explanation for differential binding of SM to its preferred targets. We have reported preferential interaction of SM with sev-eral EBV transcripts previously (7), but interestingly there is no clear correlation with SM binding and SM dependence (Fig. 15). For example, BFRF3, which is highly SM bound, is not particularly SM dependent. SM may bind to a variety of EBV mRNAs but have differential effects on them due to inherent differences in the tran-scripts themselves. Thus, SM may bind to two trantran-scripts equally avidly but enhance accumulation of one transcript more than the other because the SM-responsive transcript is much less stable.
Another notable aspect of the highly SM-dependent genes is that they were all late genes and include the major membrane
FIG 11Preferential gene specificity of the SM effect on enhancing RNA abun-dance. (A) Diagram of a line of equality, in which each member of the popu-lation has an equal proportion of the total amount of the variable, and the Lorenz curve, in which the total amount of the variable is differentially distrib-uted among the members of the population. The formula for calculation of the Gini coefficient, a global statistic for inequality of effect, is shown. (B) A Lorenz curve of the skewed distribution of SM effect. The fraction of the total SM effect is shown on theyaxis plotted against the fraction of all EBV genes on the
xaxis.
on November 7, 2019 by guest
http://jvi.asm.org/
[image:12.585.79.250.67.401.2]glycoprotein gp350, required for binding to the B cell receptor CD21, the major viral capsid protein, and several tegument pro-teins. Thus, SM is primarily required for virion formation, egress, and infectivity. This is in contrast to the gene profile of the KSHV ORF57-dependent genes. In KSHV, while some important late genes belong to the highly ORF57-dependent set, the majority are genes essential for lytic KSHV DNA replication (32). Thus, SM is essential for later steps in the cascade of lytic virus production than ORF57 in KSHV, where the proximate block in ORF57 KO mu-tants occurs at DNA replication and prior to late gene transcrip-tion (32).
Although all six replication gene mRNAs were adequately ex-pressed, rescue of lytic EBV DNA replication was not as robust as in the presence of SM. Even when the replication genes were
over-FIG 12The 6 replication complex genes are not sufficient to rescue robust viral DNA replication or virion production in SMKO EBV-infected cells. SMKO EBV-infected 293 cells were transfected with either empty vector (C), Z alone, Z⫹SM, or Z plus the six polymerase complex genes, BALF5, BALF2, BSLF1, BBLF4, BMRF1, and BBLF2/3, (Z⫹6) and were analyzed as follows. (A) qPCR for DNA replication was performed 72 h after transfection. (B) Virion production was measured in cell supernatants at 5 days posttransfection. Cell supernatants were used to infect Raji cells, and GFP-positive Raji cells were quantitated by flow cytometry. (C) qPCR for RNA expression was performed at 48 h. (D) Immunoblot analysis for BMRF1, BBLF2/3, Z, and SM proteins.
FIG 13SM inhibits BHLF1 and BHRF1 transcript accumulation during lytic replication. Measurement of RNA abundance in the BHLF1 and BHRF1 re-gion (⬃50 kb to⬃56 kb) of the B95-8 EBV genome by RNA-seq shows that both transcripts were downregulated in the presence of SM. RNA analysis of SMKO EBV-infected 293 cells transfected with either empty vector (Control), Z (to induce replication), or Z⫹SM was performed as described forFig. 1A.
on November 7, 2019 by guest
http://jvi.asm.org/
[image:13.585.112.471.61.495.2] [image:13.585.329.512.591.667.2]expressed by exogenous transfection, complete rescue was not achieved. This may be due to the additive effect of other gene products that are slightly upregulated by SM and are not essential for but contribute to efficient DNA replication. Such genes in-clude EBV ribonucleotide reductase, for example. Nevertheless, these data confirm that the most important essential role of SM in EBV infectious virion production is in facilitating late gene ex-pression.
The demonstration in this study that no single unifying
char-acteristic of highly SM-dependent transcripts can explain the gene specificity of SM activity in enhancing transcript abundance raises an important mechanistic question. Many previous studies have sought to explain the mechanism of action of SM and its homologs by a global function that facilitates expression of viral lytic genes, such as an ability to stabilize mRNAs or facilitate their export. Whether one or more of these mechanisms applies still does not explain target gene specificity, which, as we have shown here, not only is highly gene specific but also varies in the magnitude of the effect. Further, certain characteristics of the target transcript that have been proposed to be the basis for gene selectivity, such as GC content, codon usage, or the presence of specific sequences, do not appear to apply in the case of EBV. Further, the fact that affinity for a specific transcript also does not correlate well with the SM effect casts doubt on the model that gene specificity depends on a target motif in the RNA, even if it is purely structural and not strictly sequence determined. These data suggest that while SM binding to transcripts may be essential for its activity, binding alone is not sufficient. Rather, SM’s effect on the bound RNA may depend on the inherent ability of that transcript to be expressed, preferen-tially enhancing accumulation of the most poorly expressed mRNAs. Further study of SM target transcripts to determine if differences in their intrinsic decay or nuclear export rates correlate with enhancement by SM will be required to establish the mech-anisms by which SM and related essential herpesvirus posttran-scriptional regulatory proteins achieve gene specificity.
ACKNOWLEDGMENTS
RNA and DNA sequencing and ChIP assays were performed with the equipment and assistance of the Huntsman Cancer Institute’s High Throughput Genomics Core Facility. Flow cytometry was performed at the University of Utah Health Sciences Flow Cytometry Core Facility. FIG 14SM binding to the EBV genome by ChIP-Seq during lytic replication in a lymphoma cell line. Total DNA was immunoprecipitated with polyclonal SM antibodies from P3HR1 cells 48 h after induction of lytic replication. (A) The relative read numbers from input and immunoprecipitated samples are shown on the vertical axis versus the EBV genome on the horizontal axis. The empty space between⬃35 and 40 kb in the EBV genome is due to the deletion in the P3HR1 genome compared to the prototype EBV genome. (B) SM ChIP data from human chromosome 11 demonstrating that SM binds to a specific region on the genome between genes NXPE4 and NXPE2. Read numbers are shown on theyaxis, and the human chromosome nucleotide coordinates are shown on thexaxis.
FIG 15Relationship between SM-RNA transcript affinity and SM-dependent gene expression. Fold enhancement of each lytic transcript by SM derived from RNA-seq analysis (SMKO Z⫹SM versus SMKO Z) was plotted on thexaxis versus fold enrichment of each transcript in SM immunoprecipitates versus control antibody immunoprecipitates (SM affinity,yaxis).
on November 7, 2019 by guest
http://jvi.asm.org/
[image:14.585.127.460.67.306.2] [image:14.585.73.252.497.676.2]FUNDING INFORMATION
HHS | NIH | National Cancer Institute (NCI) provided funding to Sankar Swaminathan under grant number CA81133.
The funding agency had no role in study design, data collection and in-terpretation, or the decision to submit the work for publication.
REFERENCES
1.Swaminathan S.2005. Post-transcriptional gene regulation by EBV SM protein, p 631– 650.InRobertson E (ed), Epstein-Barr virus. Caister Press, Poole, United Kingdom.
2.Swaminathan S, Kenney S.2009. The Epstein-Barr virus lytic lifecycle.In
Damania B, Pipas J (ed), DNA tumor viruses. Springer, Berlin, Germany. 3.Cho MS, Jeang KT, Hayward SD.1985. Localization of the coding region for an Epstein-Barr virus early antigen and inducible expression of this 60-kilodalton nuclear protein in transfected fibroblast cell lines. J Virol 56:852– 859.
4.Sample J, Lancz G, Nonoyama M.1986. Mapping of genes in BamHI fragment M of Epstein-Barr virus DNA that may determine the fate of viral infection. J Virol57:145–154.
5.Gruffat H, Batisse J, Pich D, Neuhierl B, Manet E, Hammerschmidt W, Sergeant A.2002. Epstein-Barr virus mRNA export factor EB2 is essential for production of infectious virus. J Virol76:9635–9644.http://dx.doi.org /10.1128/JVI.76.19.9635-9644.2002.
6.Han Z, Marendy E, Wang Y-D, Yuan J, Sample JT, Swaminathan S. 2007. Multiple roles of Epstein-Barr virus SM protein in lytic replication. J Virol81:4058 – 4069.http://dx.doi.org/10.1128/JVI.02665-06. 7.Han Z, Verma D, Hilscher C, Dittmer DP, Swaminathan S. 2009.
General and target-specific RNA binding properties of Epstein-Barr virus SM posttranscriptional regulatory protein. J Virol83:11635–11644.http: //dx.doi.org/10.1128/JVI.01483-09.
8.Hiriart E, Bardouillet L, Manet E, Gruffat H, Penin F, Montserret R, Farjot G, Sergeant A.2003. A region of the Epstein-Barr virus (EBV) mRNA export factor EB2 containing an arginine-rich motif mediates di-rect binding to RNA. J Biol Chem278:37790 –37798.http://dx.doi.org/10 .1074/jbc.M305925200.
9.Ruvolo V, Wang E, Boyle S, Swaminathan S.1998. The Epstein-Barr virus nuclear protein SM is both a post-transcriptional inhibitor and ac-tivator of gene expression. Proc Natl Acad Sci U S A95:8852– 8857.http: //dx.doi.org/10.1073/pnas.95.15.8852.
10. Verma D, Kim EA, Swaminathan S.2013. Cell-based screening assay for antiviral compounds targeting the ability of herpesvirus posttranscrip-tional regulatory proteins to stabilize viral mRNAs. J Virol87:10742– 10751.http://dx.doi.org/10.1128/JVI.01644-13.
11. Gupta AK, Ruvolo V, Patterson C, Swaminathan S.2000. The human herpesvirus 8 homolog of Epstein-Barr virus SM protein (KS-SM) is a posttranscriptional activator of gene expression. J Virol74:1038 –1044.
http://dx.doi.org/10.1128/JVI.74.2.1038-1044.2000.
12. Hiriart E, Farjot G, Gruffat H, Nguyen MV, Sergeant A, Manet E.2003. A novel nuclear export signal and a REF interaction domain both promote mRNA export by the Epstein-Barr virus EB2 protein. J Biol Chem278: 335–342.
13. Farjot G, Buisson M, Duc Dodon M, Gazzolo L, Sergeant A, Mikaelian I.2000. Epstein-Barr virus EB2 protein exports unspliced RNA via a Crm-1-independent pathway. J Virol74:6068 – 6076.http://dx.doi.org/10.1128 /JVI.74.13.6068-6076.2000.
14. Hiriart E, Gruffat H, Buisson M, Mikaelian I, Keppler S, Meresse P, Mercher T, Bernard OA, Sergeant A, Manet E.2005. Interaction of the Epstein-Barr virus mRNA export factor EB2 with human Spen proteins SHARP, OTT1, and a novel member of the family, OTT3, links Spen proteins with splicing regulation and mRNA export. J Biol Chem280: 36935–36945.http://dx.doi.org/10.1074/jbc.M501725200.
15. Juillard F, Bazot Q, Mure F, Tafforeau L, Macri C, Rabourdin-Combe C, Lotteau V, Manet E, Gruffat H.2012. Epstein-Barr virus protein EB2 stimulates cytoplasmic mRNA accumulation by counteracting the delete-rious effects of SRp20 on viral mRNAs. Nucleic Acids Res40:6834 – 6849.
http://dx.doi.org/10.1093/nar/gks319.
16. Juillard F, Hiriart E, Sergeant N, Vingtdeux-Didier V, Drobecq H, Sergeant A, Manet E, Gruffat H.2009. Epstein-Barr virus protein EB2 contains an N-terminal transferable nuclear export signal that promotes nucleocytoplasmic export by directly binding TAP/NXF1. J Virol83: 12759 –12768.http://dx.doi.org/10.1128/JVI.01276-09.
17. Boyle SM, Ruvolo V, Gupta AK, Swaminathan S.1999. Association with the cellular export receptor CRM 1 mediates function and intracellular localization of Epstein-Barr virus SM protein, a regulator of gene expres-sion. J Virol73:6872– 6881.
18. Li DJ, Verma D, Swaminathan S.2012. Binding of cellular export factor REF/Aly by Kaposi’s sarcoma-associated herpesvirus (KSHV) ORF57 pro-tein is not required for efficient KSHV lytic replication. J Virol86:9866 – 9874.http://dx.doi.org/10.1128/JVI.01190-12.
19. Verma D, Swaminathan S.2008. Epstein-Barr virus SM protein functions as an alternative splicing factor. J Virol82:7180 –7188.http://dx.doi.org /10.1128/JVI.00344-08.
20. Batisse J, Manet E, Middeldorp J, Sergeant A, Gruffat H.2005. Epstein-Barr virus mRNA export factor EB2 is essential for intranuclear capsid assembly and production of gp350. J Virol79:14102–14111.http://dx.doi .org/10.1128/JVI.79.22.14102-14111.2005.
21. Delecluse HJ, Hilsendegen T, Pich D, Zeidler R, Hammerschmidt W. 1998. Propagation and recovery of intact, infectious Epstein-Barr virus from prokaryotic to human cells. Proc Natl Acad Sci U S A95:8245– 8250.
http://dx.doi.org/10.1073/pnas.95.14.8245.
22. Pulvertaft JV.1965. A study of malignant tumours in Nigeria by short-term tissue culture. J Clin Pathol18:261–273.http://dx.doi.org/10.1136 /jcp.18.3.261.
23. Neuhierl B, Feederle R, Hammerschmidt W, Delecluse HJ.2002. Gly-coprotein gp110 of Epstein-Barr virus determines viral tropism and effi-ciency of infection. Proc Natl Acad Sci U S A99:15036 –15041.http://dx .doi.org/10.1073/pnas.232381299.
24. Nix DA, Courdy SJ, Boucher KM.2008. Empirical methods for control-ling false positives and estimating confidence in ChIP-Seq peaks. BMC Bioinformatics9:523.http://dx.doi.org/10.1186/1471-2105-9-523. 25. Love MI, Huber W, Anders S.2014. Moderated estimation of fold change
and dispersion for RNA-seq data with DESeq2. Genome Biol15:550.http: //dx.doi.org/10.1186/s13059-014-0550-8.
26. Leng N, Li Y, McIntosh BE, Nguyen BK, Duffin B, Tian S, Thomson JA, Dewey CN, Stewart R, Kendziorski C.2015. EBSeq-HMM: a Bayesian approach for identifying gene-expression changes in ordered RNA-seq experiments. Bioinformatics (Oxford, England)31:2614 –2622.http://dx .doi.org/10.1093/bioinformatics/btv193.
27. Li B, Dewey CN.2011. RSEM: accurate transcript quantification from RNA-Seq data with or without a reference genome. BMC Bioinformatics 12:323.http://dx.doi.org/10.1186/1471-2105-12-323.
28. Messeguer X, Escudero R, Farre D, Nunez O, Martinez J, Alba MM. 2002. PROMO: detection of known transcription regulatory elements us-ing species-tailored searches. Bioinformatics18:333–334. http://dx.doi .org/10.1093/bioinformatics/18.2.333.
29. Paz I, Akerman M, Dror I, Kosti I, Mandel-Gutfreund Y.2010. SFmap: a web server for motif analysis and prediction of splicing factor binding sites. Nucleic Acids Res38:W281–W285.http://dx.doi.org/10.1093/nar/gkq444. 30. Bailey TL, Boden M, Buske FA, Frith M, Grant CE, Clementi L, Ren J,
Li WW, Noble WS.2009. MEME suite: tools for motif discovery and searching. Nucleic Acids Res37:W202–W208.http://dx.doi.org/10.1093 /nar/gkp335.
31. Li DJ, Verma D, Mosbruger T, Swaminathan S. 2014. CTCF and Rad21 act as host cell restriction factors for Kaposi’s sarcoma-associated herpesvirus (KSHV) lytic replication by modulating viral gene transcription. PLoS Pathog 10:e1003880. http://dx.doi.org/10 .1371/journal.ppat.1003880.
32. Verma D, Li DJ, Krueger B, Renne R, Swaminathan S.2015. Identifi-cation of the physiological gene targets of the essential lytic replicative Kaposi’s sarcoma-associated herpesvirus ORF57 protein. J Virol89:1688 – 1702.http://dx.doi.org/10.1128/JVI.02663-14.
33. Vogt C, Hackmann C, Rabner A, Koste L, Santag S, Kati S, Mandel-Gutfreund Y, Schulz TF, Bohne J.2015. ORF57 overcomes the detri-mental sequence bias of Kaposi’s sarcoma-associated herpesvirus lytic genes. J Virol89:5097–5109.http://dx.doi.org/10.1128/JVI.03264-14. 34. Masuyama K, Taniguchi I, Kataoka N, Ohno M. 2004. RNA length
defines RNA export pathway. Genes Dev18:2074 –2085.http://dx.doi.org /10.1101/gad.1216204.
35. Shin YC, Desrosiers RC. 2011. Rhesus monkey rhadinovirus ORF57 induces gH and gL glycoprotein expression through the post-transcriptional accumulation of target mRNAs. J Virol85:7810 –7817.
http://dx.doi.org/10.1128/JVI.00493-11.
36. Bilello JP, Morgan JS, Desrosiers RC.2008. Extreme dependence of gH and gL expression on ORF57 and association with highly unusual codon
on November 7, 2019 by guest
http://jvi.asm.org/
usage in rhesus monkey rhadinovirus. J Virol82:7231–7237.http://dx.doi .org/10.1128/JVI.00564-08.
37. Puigbo P, Bravo IG, Garcia-Vallve S.2008. CAIcal: a combined set of tools to assess codon usage adaptation. Biol Direct3:38.http://dx.doi.org /10.1186/1745-6150-3-38.
38. Verma D, Bais S, Gaillard M, Swaminathan S. 2010. Epstein-Barr virus SM protein utilizes cellular splicing factor SRp20 to mediate al-ternative splicing. J Virol84:11781–11789.http://dx.doi.org/10.1128 /JVI.01359-10.
39. Escudero-Paunetto L, Li L, Hernandez FP, Sandri-Goldin RM.2010. SR proteins SRp20 and 9G8 contribute to efficient export of herpes simplex virus 1 mRNAs. Virology401:155–164.http://dx.doi.org/10.1016/j.virol .2010.02.023.
40. Huang Y, Steitz JA.2001. Splicing factors SRp20 and 9G8 promote the nucleocytoplasmic export of mRNA. Mol Cell7:899 –905.http://dx.doi .org/10.1016/S1097-2765(01)00233-7.
41. Lorenz MO.1905. Methods for measuring the concentration of wealth. Am Stat Assoc9:209 –219.
42. Fixman ED, Hayward GS, Hayward SD.1992. trans-acting requirements for replication of Epstein-Barr virus ori-lyt. J Virol66:5030 –5039. 43. Fixman ED, Hayward GS, Hayward SD.1995. Replication of
Epstein-Barr virus oriLyt: lack of a dedicated virally encoded origin-binding pro-tein and dependence on Zta in cotransfection assays. J Virol69:2998 – 3006.
44. Schepers A, Pich D, Hammerschmidt W.1996. Activation of oriLyt, the lytic origin of DNA replication of Epstein-Barr virus, by BZLF1. Virology 220:367–376.http://dx.doi.org/10.1006/viro.1996.0325.
45. Rennekamp AJ, Lieberman PM.2011. Initiation of Epstein-Barr virus lytic replication requires transcription and the formation of a stable RNA-DNA hybrid molecule at OriLyt. J Virol85:2837–2850.http://dx.doi.org /10.1128/JVI.02175-10.
46. Sei E, Wang T, Hunter OV, Xie Y, Conrad NK. 2015. HITS-CLIP analysis uncovers a link between the Kaposi’s sarcoma-associated herpes-virus ORF57 protein and host pre-mRNA metabolism. PLoS Pathog11: e1004652.http://dx.doi.org/10.1371/journal.ppat.1004652.
47. Sandri-Goldin RM.2011. The many roles of the highly interactive HSV protein ICP27, a key regulator of infection. Future Microbiol6:1261– 1277.http://dx.doi.org/10.2217/fmb.11.119.
48. Toth Z, Stamminger T.2008. The human cytomegalovirus regulatory protein UL69 and its effect on mRNA export. Front Biosci13:2939 –2949.
http://dx.doi.org/10.2741/2899.
49. Han Z, Swaminathan S.2006. Kaposi’s sarcoma-associated herpesvirus lytic gene ORF57 is essential for infectious virion production. J Virol80: 5251–5260.http://dx.doi.org/10.1128/JVI.02570-05.
50. Boyer JL, Swaminathan S, Silverstein SJ.2002. The Epstein-Barr virus SM protein is functionally similar to ICP27 from herpes simplex virus in viral infections. J Virol76:9420 –9433.http://dx.doi.org/10.1128/JVI.76 .18.9420-9433.2002.
51. Massimelli MJ, Kang JG, Majerciak V, Le SY, Liewehr DJ, Steinberg SM, Zheng ZM.2011. Stability of a long noncoding viral RNA depends on a 9-nt core element at the RNA 5=end to interact with viral ORF57 and cellular PABPC1. Int J Biol Sci7:1145–1160.
52. Hunter OV, Sei E, Richardson RB, Conrad NK.2013. Chromatin immunoprecipitation and microarray analysis suggest functional co-operation between Kaposi’s sarcoma-associated herpesvirus ORF57 and K-bZIP. J Virol 87:4005– 4016. http://dx.doi.org/10.1128/JVI .03459-12.
53. Sahin BB, Patel D, Conrad NK.2010. Kaposi’s sarcoma-associated her-pesvirus ORF57 protein binds and protects a nuclear noncoding RNA from cellular RNA decay pathways. PLoS Pathog6:e1000799.http://dx .doi.org/10.1371/journal.ppat.1000799.
on November 7, 2019 by guest
http://jvi.asm.org/