ALT-803 Transiently Reduces Simian Immunodeficiency Virus
Replication in the Absence of Antiretroviral Treatment
Amy L. Ellis-Connell,
aAlexis J. Balgeman,
aKatie R. Zarbock,
bGabrielle Barry,
bAndrea Weiler,
bJack O. Egan,
cEmily K. Jeng,
cThomas Friedrich,
b,dJeffrey S. Miller,
eAshley T. Haase,
fTimothy W. Schacker,
gHing C. Wong,
cEva Rakasz,
bShelby L. O’Connor
a,baDepartment of Pathology and Laboratory Medicine, University of Wisconsin-Madison, Madison,
Wisconsin, USA
bWisconsin National Primate Research Center, Madison, Wisconsin, USA
cAltor BioScience Corporation, Miramar, Florida, USA
dDepartment of Pathobiological Sciences, University of Wisconsin-Madison, Madison, Wisconsin, USA
eDivision of Hematology, Oncology, and Transplantation, University of Minnesota, Minneapolis,
Minnesota, USA
fDepartment of Microbiology and Immunology, University of Minnesota, Minneapolis, Minnesota, USA
gDivision of Infectious Disease and International Medicine, University of Minnesota, Minneapolis,
Minnesota, USA
ABSTRACT
Developing biological interventions to control human
immunodefi-ciency virus (HIV) replication in the absence of antiretroviral therapy (ART) could
contribute to the development of a functional cure. As a potential alternative to
ART, the interleukin-15 (IL-15) superagonist ALT-803 has been shown to boost the
number and function of HIV-specific CD8
⫹T and NK cell populations
in vitro
. Four
simian immunodeficiency virus (SIV)-positive rhesus macaques, three of whom
pos-sessed major histocompatibility complex alleles associated with control of SIV and all
of whom had received SIV vaccine vectors that had the potential to elicit CD8
⫹T
cell responses, were given ALT-803 in three treatment cycles. The first and second
cycles of treatment were separated by 2 weeks, while the third cycle was
adminis-tered after a 29-week break. ALT-803 transiently elevated the total CD8
⫹effector
and central memory T cell and NK cell populations in peripheral blood, while viral
loads transiently decreased by
⬃
2 logs in all animals. Virus suppression was not
sus-tained as T cells became less responsive to ALT-803 and waned in numbers. No
ef-fect on viral loads was observed in the second cycle of ALT-803, concurrent with
downregulation of the IL-2/15 common
␥
C and

chain receptors on both CD8
⫹T
cells and NK cells. Furthermore, populations of immunosuppressive T cells increased
during the second cycle of ALT-803 treatment. During the third treatment cycle,
re-sponsiveness to ALT-803 was restored. CD8
⫹T cells and NK cells increased again
3-to 5-fold, and viral loads transiently decreased again by 1 3-to 2 logs.
IMPORTANCE
Overall, our data show that ALT-803 has the potential to be used as
an immunomodulatory agent to elicit effective immune control of HIV/SIV
replica-tion. We identify mechanisms to explain why virus control is transient, so that this
model can be used to define a clinically appropriate treatment regimen.
KEYWORDS
ALT-803, ART-naive, IL-15 superagonist, SIV, SIV treatment, nonhuman
primate, virus
D
espite the ability of modern antiretroviral therapy (ART) to control human
immu-nodeficiency virus (HIV) infection, a cure remains elusive. Even with ART, the virus
establishes latent infection in resting CD4
⫹T cells from which reactivation can occur.
Development of alternative biological interventions that harness the strength of the
Received4 October 2017Accepted6 November 2017
Accepted manuscript posted online8 November 2017
CitationEllis-Connell AL, Balgeman AJ, Zarbock KR, Barry G, Weiler A, Egan JO, Jeng EK, Friedrich T, Miller JS, Haase AT, Schacker TW, Wong HC, Rakasz E, O'Connor SL. 2018. ALT-803 transiently reduces simian
immunodeficiency virus replication in the absence of antiretroviral treatment. J Virol 92:e01748-17.https://doi.org/10.1128/JVI
.01748-17.
EditorViviana Simon, Icahn School of Medicine at Mount Sinai
Copyright© 2018 American Society for Microbiology.All Rights Reserved. Address correspondence to Shelby L. O'Connor, slfeinberg@wisc.edu.
crossm
on November 6, 2019 by guest
http://jvi.asm.org/
host immune system to control virus replication could contribute to the development
of a functional cure.
Even though ART treatment exhibits phenomenal success for HIV
⫹patients,
effec-tive non-ART-based clinical approaches to enhance the effeceffec-tiveness of ART are not yet
available. Recently, there has been great interest in developing non-ART-based
thera-pies that can work alone or together with ART. One approach is to use prophylactic
vaccines to boost CD8
⫹T cell responses, as these cells play a crucial role in the control
of virus replication (1–4). The need to enhance CD8
⫹T cells during ART was recently
highlighted by Cartwright et al., who found that CD8
⫹T cells were needed to control
virus replication in SIV-infected nonhuman primates being treated with ART (5).
There has been recent enthusiasm for approaches that increase the transcription of
viral genes from latent reservoirs while boosting both adaptive and innate immune cell
populations to eliminate the newly activated virus-infected cells. For example, both
Toll-like receptor 7 (TLR7) agonists and
␣
4

7 integrin molecules have been used with
some success to promote virologic control in simian immunodeficiency virus
(SIV)-positive nonhuman primates (6, 7). While these therapies work by different
mecha-nisms, they demonstrate the enthusiasm for non-ART-based approaches that harness
host immunity to control HIV/SIV replication.
Interleukin-15 (IL-15) agonists, such as IL-15:IL-15R
␣
-Fc complexes, are another class
of compounds that may promote antiviral functions of the host immune response.
These agonists are broad activators of several innate and adaptive immune
popula-tions, in particular CD8
⫹T cells and NK cells (8, 9). There is some evidence that IL-15
agonists also can act as latency-reversing agents and drive virus transcription in latently
infected CD4
⫹T cells
in vitro
(10). Although treatment with IL-15 was unable to
suppress plasma viremia (11–14), using IL-15 agonists as molecular adjuvants to vaccine
vectors has led to some virologic benefit (15, 16).
A novel IL-15 superagonist, ALT-803, recently has been shown to boost
in vitro
CD8
⫹T cell and NK cell responses to HIV infection (10). ALT-803 is a soluble IL-15
superagonist complex (IL-15N72D:IL-15R
␣
SuFc) in which a mutant IL-15 (N72D) is
bound to the sushi domain of IL-15R
␣
fused to the Fc region of IgG1 (17–19).
ALT-803 promotes rapid expansion of CD8
⫹T cell and NK cell populations
in vitro
in human donors and mice and
in vivo
in nonhuman primates (20). In contrast to
recombinant IL-15, ALT-803 has superior
in vivo
lymph tissue retention in mouse
biodistribution studies and more potent antitumor activity (20). Previous data of
ALT-803 in several mouse models of cancer suggest broad therapeutic applications
in hematologic and solid tumors (21–23). Furthermore, clinical trials evaluating
ALT-803 are under way for treatment of hematologic and solid cancers and HIV
(ClinicalTrials registration no. NCT02191098).
Given that ALT-803 has such a potentiating effect on cellular immunity, we tested
the hypothesis that ALT-803 modulation of cellular immunity could suppress SIV
replication in nonhuman primates. We treated ART-naive chronic-phase SIV
⫹rhesus
macaques weekly with 0.1 mg/kg of body weight of ALT-803 subcutaneously for four
consecutive weeks. We observed a dramatic 1- to 2-log decline to levels below the limit
of detection in plasma viremia during the first 7 to 14 days of treatment. The effect was
transient, such that virus loads rebounded concomitantly with IL-15 receptor
internal-ization and changes in the sequences of the virus population. Sensitivity to ALT-803
returned after the animals received a 29-week break from treatment. This study
provides evidence that treatment with the IL-15 superagonist ALT-803 can suppress SIV
replication in the absence of ART in nonhuman primates.
RESULTS
Initial subcutaneous ALT-803 treatment transiently reduces viremia of SIV
ⴙprogressor rhesus macaques.
Four rhesus macaques infected with SIVmac239 for a
minimum of 1.5 years were selected for this study. All animals had been part of previous
studies and had received a variety of vector vaccines expressing SIV antigens that could
or could not elicit CD8
⫹T cell responses (24). Even though they all initially controlled
February 2018 Volume 92 Issue 3 e01748-17 jvi.asm.org 2
on November 6, 2019 by guest
http://jvi.asm.org/
viremia to nearly undetectable levels (24), their plasma viral loads ranged from 10
3to
10
4viral copy equivalents (CEQ)/ml at the time of this study (Fig. 1A). Three of these
animals expressed
Mamu-B
*
08
and 1 animal expressed
Mamu-A
*
01
major
histocom-patibility complex (MHC) class I allele (Table 1).
To test the hypothesis that ALT-803 modulation of cellular immunity can suppress
SIV replication in nonhuman primates, we treated all animals subcutaneously with 0.1
mg/kg ALT-803 weekly for 4 weeks. This dose had been previously used to boost
cellular immunity in SIV-naive macaques with no adverse side effects (20). Plasma SIV
gag
viral loads were measured biweekly during treatment. During the first 7 to 10 days
of ALT-803 treatment, we observed a precipitous decline in the SIV viral loads (Fig. 1A),
such that the viral loads in all 4 animals dropped below the limit of detection on day
10. Unfortunately, suppression of virus replication was transient and the duration was
variable across animals.
-28 -21 -14 -7 0 3 7 10 14 17 21 24 28 35 1
2 3 4 5
Days post ALT-803 treatment
Log
10
V
iral Copy
Equivalents/mL
(CEQ/mL)
-28 -21 -14 -7 0 7 14 21 28 35 0
500 1000 1500 2000 2500 3000 3500
T
otal cells/μL
blood
-28-21-14 -7 0 7 14 21 28 35 0
500 1000 1500 2000 2500
T
otal cells/μL
blood
Total CD4 T cells
Days post ALT-803 treatment
-28 -21 -14 -7 0 7 14 21 28 35 0
500 1000 1500
Total NK cells
T
otal cells/μL
blood
Days post ALT-803 treatment Days post ALT-803 treatment
Total CD8 T cells
Log10 Viral load
Log
10
CD8 T cell counts
R=-0.6668 p≤0.01
Log10 Viral load
Log
10
N
K
c
e
ll c
o
unt
s R=-0.5436
p≤0.01
Log
10
CD4 T cell counts
Log10 Viral load R=-0.4346 p=0.04
r09089 r11021
r08054
r08016 =Day of ALT803 delivery
A
B
C
D
E
F
G
2 3 4 5
2.0 2.5 3.0 3.5
2 3 4 5
1.5 2.0 2.5 3.0 3.5
2 3 4 5
2.0 2.5 3.0 3.5
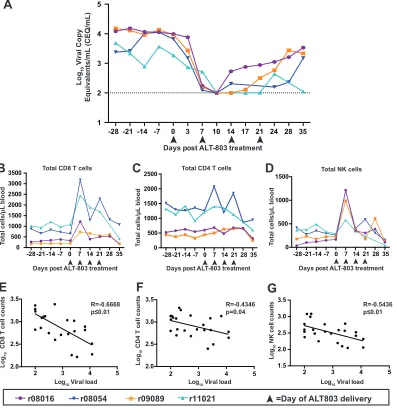
FIG 1ALT-803 treatment alters lymphocyte cell populations and viral loads in SIV⫹ macaques. (A) Log
10 virus copy
equivalents/ml in plasma were measured as described in Materials and Methods for each animal. Arrowheads mark days on
which animals received ALT-803. (B and C) Total CD8⫹and CD4⫹T lymphocyte populations perl of blood were determined
as described in Materials and Methods using antibodies described in Table 4 and using complete blood counts determined for each time point. (D) Flow cytometry to measure NK cell populations present in PBMC was performed according to Materials and Methods using antibodies described in Table 2. The percentage of NK cells was determined as indicated in Materials and
Methods. Total NK cell counts perl of blood then were calculated based on complete blood counts for each time point. (E
to G) Pearson’s correlation coefficients (R) were calculated as previously described in Materials and Methods by comparing the
log10viral loads/ml plasma to the log10total cell counts for CD8⫹(E), CD4⫹(F), and NK (G) cells.
on November 6, 2019 by guest
http://jvi.asm.org/
[image:3.585.45.442.75.488.2]Increasing absolute number of CD8
ⴙT cells and NK cells correlates with
decreasing SIV viral loads.
Previously, ALT-803 was reported to increase the absolute
numbers of T cells and NK cells in healthy cynomolgus macaques (20), but this reagent
had not yet been studied in SIV
⫹animals. We measured the absolute number of T cell
and NK cell populations prior to and during ALT-803 treatment in SIV
⫹animals.
Consistent with data obtained from healthy animals (20), we observed an increase in
both CD8
⫹T cells and NK cells after the first dose of ALT-803 (Fig. 1B and D), but there
were no marked effects on the total number of CD4
⫹T cells (Fig. 1C). We performed
Spearman’s correlation analyses to determine if the frequency of CD8
⫹T cells or NK
cells correlated with changes in viral load. The absolute cell counts for CD8
⫹, CD4
⫹, and
NK cells, as well as the viral loads, were converted to log-scale numbers for each time
point before and during ALT-803 treatment. We observed a significant negative
cor-relation between CD8
⫹(
R
⫽ ⫺
0.67) and NK (
R
⫽ ⫺
0.54) cell numbers and viral load
(Fig. 1E and G, respectively). In contrast, the correlation observed between CD4
⫹T cells
and viral load yielded a low spearman correlation
R
value (
R
⫽ ⫺
0.43; Fig. 1F) and
therefore was not significant.
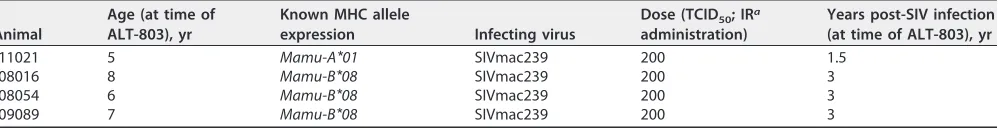
We further examined changes in the frequency of CD8
⫹T, CD4
⫹T, and NK cell
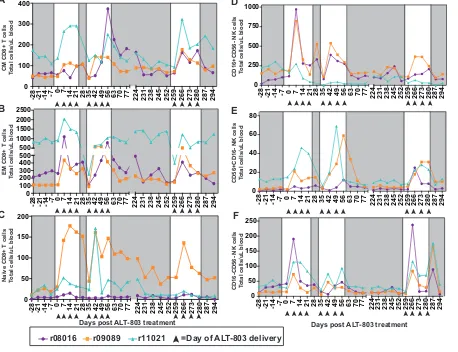
subpopulations (Fig. 2). Consistent with previous IL-15 and ALT-803 studies (20, 25), the
majority of the upregulated CD8
⫹T cells had an effector memory (EM) phenotype (Fig.
2B), with minor increases in central memory (Fig. 2A) and naive (Fig. 2C) CD8
⫹T cells
as well. For the NK cells, the majority of the upregulated cells consisted of CD16
⫹cells,
with minor increases in both CD16
⫺CD56
⫺and CD56
⫹populations (Fig. 2G to I). There
were no significant changes in CD4
⫹T cell subsets (Fig. 2D to F).
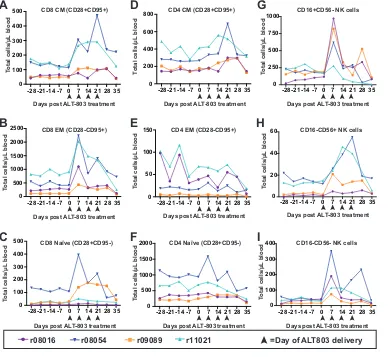
Sensitivity to ALT-803 returns after an extended break from treatment.
We
wanted to determine if suppression of SIV viremia would return in the presence of
ongoing ALT-803 treatment or if a break from ALT-803 was needed to restore sensitivity
to the drug. Three of the animals, two of which were
Mamu-B
*
08
⫹and one of which
was
Mamu-A
*
01
⫹, were included in this part of the study. The fourth animal had to be
removed for unrelated reasons but otherwise appeared healthy. These three animals
were given an additional 4-week course of ALT-803 immediately after the first cycle of
treatment (defined as cycle 2) (Fig. 3A), the animals were given a break for 29 weeks,
and then they received a final 4-week course of ALT-803 (defined as cycle 3) (Fig. 3A).
We found that there was no suppression of SIV viremia during cycle 2, but remarkably,
sensitivity to ALT-803 returned during cycle 3 and plasma SIV viral loads were again
suppressed, although less substantially than during cycle 1 (Fig. 3B).
CD8
ⴙT and NK cell numbers are still boosted during subsequent ALT-803
treatment cycles in the peripheral blood.
One possibility for the lack of suppression
of plasma viremia observed during cycle 2 of ALT-803 is that CD8
⫹T cells and NK cells
did not expand in the peripheral blood. Therefore, we assessed whether CD8
⫹T cell
and NK cell populations increased in the blood during cycles 2 and 3. While there were
still increased numbers of CD8
⫹T cells (Fig. 3C) and NK cells (Fig. 3D) in the peripheral
blood relative to pretreatment levels, the increases were more modest than those we
observed during the initial ALT-803 treatment (Fig. 1). We then assessed the
relation-ship between the number of CD8
⫹T cells and NK cells and plasma viral loads. We did
not observe a negative relationship between CD8
⫹T cells or NK cells and viral load in
the second cycle of ALT-803 treatment (Fig. 3G and H), but the negative correlation
[image:4.585.45.544.83.147.2]between CD8
⫹T cells and viral loads was restored when ALT-803 treatment resumed
TABLE 1Animal information for animals involved in study
Animal
Age (at time of ALT-803), yr
Known MHC allele
expression Infecting virus
Dose (TCID50; IRa administration)
Years post-SIV infection (at time of ALT-803), yr
r11021 5 Mamu-A*01 SIVmac239 200 1.5
r08016 8 Mamu-B*08 SIVmac239 200 3
r08054 6 Mamu-B*08 SIVmac239 200 3
r09089 7 Mamu-B*08 SIVmac239 200 3
aIR, intrarectal.
February 2018 Volume 92 Issue 3 e01748-17 jvi.asm.org 4
on November 6, 2019 by guest
http://jvi.asm.org/
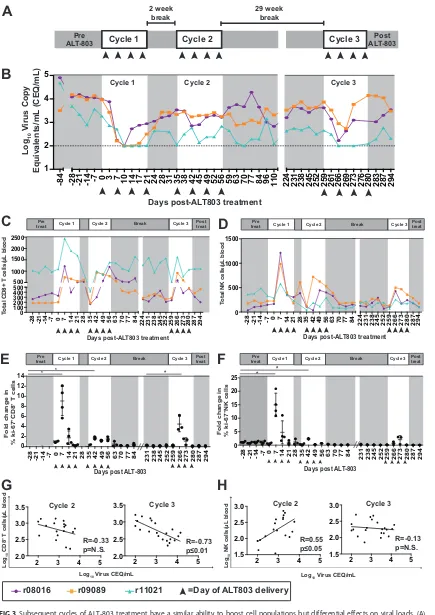
after a 29-week break (cycle 3) (Fig. 3G). There were no other differences between the
number of naive or memory subpopulations of CD8
⫹T cells or the cytotoxic or
cytokine-producing NK cells across the three treatment cycles (Fig. 4).
To determine if the increased numbers of peripheral CD8
⫹T cells and NK cells were
due to redistribution from tissues or proliferation in the blood, we measured changes
in the population of cells expressing the proliferation marker ki-67. Relative to
pre-treatment controls, CD8
⫹T cells and NK cells expressed significantly higher ki-67 levels
during the first cycle of ALT-803 (Fig. 3E and F), suggesting that these populations of
cells proliferated in the peripheral blood rather than redistributed from the tissues. This
increase was transient and consistent with previous findings that use other IL-15
agonists in macaques (11, 25). ki-67 expression was markedly attenuated during the
second cycle of ALT-803 for both cell populations, whereas transient upregulation of
ki-67 was restored for CD8
⫹T cells but not for NK cells for the third cycle of ALT-803
treatment.
No significant changes in peripheral CD4
ⴙT cells during ALT-803 treatment.
We explored the possibility that the number of CD4
⫹T cells changed during additional
cycles of ALT-803 treatment, thus altering the number of target cells for SIV replication.
-28 -21 -14 -7 0 7 14 21 28 35 0
100 200 300 400 500
Days post ALT-803 treatment
T
otal cells/μL
blood
CD8 CM (CD28+CD95+)
-28 -21 -14 -7 0 7 14 21 28 35 0
500 1000 1500 2000 2500
T
o
tal cells/μL
blood
CD8 EM (CD28-CD95+)
Days post ALT-803 treatment
-28 -21 -14 -7 0 7 14 21 28 35 0
100 200 300 400 500
Days post ALT-803 treatment CD8 Naїve (CD28+CD95-)
T
o
tal cells/μL
blood
-28 -21 -14 -7 0 7 14 21 28 35 0
200 400 600 800
r09089 r11021
r08054 r08016
CD4 CM (CD28+CD95+)
Days post ALT-803 treatment
T
otal cells/μL
blood
-28 -21 -14 -7 0 7 14 21 28 35 0
50 100 150
T
o
tal cells/μL
blood
Days post ALT-803 treatment CD4 EM (CD28-CD95+)
-28 -21 -14 -7 0 7 14 21 28 35 0
500 1000 1500 2000
T
o
tal cells/μL
blood
Days post ALT-803 treatment CD4 Naїve (CD28+CD95-)
-28 -21 -14 -7 0 7 14 21 28 35 0
250 500 750 1000
-28 -21 -14 -7 0 7 14 21 28 35 0
20 40 60
-28 -21 -14 -7 0 7 14 21 28 35 0
100 200 300 400
T
otal cells/μL
blood
T
o
tal cells/μL
blood
T
o
tal cells/μL
blood
Days post ALT-803 treatment Days post ALT-803 treatment
Days post ALT-803 treatment CD16+CD56- NK cells
CD16-CD56+ NK cells
CD16-CD56- NK cells
=Day of ALT803 delivery
A
B
C
D
E
F
G
H
I
FIG 2Assessment of memory CD4⫹and CD8⫹T cell populations and NK cell populations during cycle 1 of ALT-803 treatment. (A to F) Fresh PBMC were isolated from whole-blood samples and were stained as described in Materials and
Methods and Table 4, and central memory (CM; CD28⫹CD95⫹CCR7⫹) (A and D), effector memory (EM; CD28⫺CD95⫹
CCR7⫺) (B and E), and naive (CD28⫹CD95⫺CCR7⫹) (C and F) CD4⫹and CD8⫹T cells were defined from the CD3⫹CD4⫹
and CD3⫹CD8⫹parent populations, respectively. Total cell numbers were determined based on complete blood counts.
(G to I) Fresh PBMC were isolated as described for panels A to F and were stained as indicated in Materials and Methods
and Table 2. CD16⫹CD56⫺(G), CD56⫹CD16⫺(H), and CD16⫺CD56⫺(I) NK cells were defined from the CD3⫺CD8⫹
NKG2A⫹parent population. Total cell numbers were determined based on complete blood counts.
on November 6, 2019 by guest
http://jvi.asm.org/
[image:5.585.42.430.73.430.2]Log
10V
irus Copy
Equivalents/mL
(CEQ/mL)
Days post-ALT803 treatment
Tot
a
l CD8+ T c
e
lls
/μL blood
Tot
a
l NK c
e
lls
/μL blood
Days post-ALT803 treatment Days post-ALT803 treatment
r09089
r11021
r08016
=Day of ALT803 delivery
Log
10
CD8
+ T cells/μL
blood
Log10 Virus CEQ/mL
R=-0.33 p=N.S. R=-0.73 p≤0.01 R=0.55 p≤0.05 R=-0.13 p=N.S.
B
-8
4
-2
8
-2
1
-1
4 -7 0 3 7
10 14 17 21 24 28 31 35 38 42 45 49 52 56 59 63 70 77 84 96 110
224 231 238 245 252 259 261 266 269 273 276 280 283 287 294
1
2
3
4
5
-2 8 -2 1 -14 -7 0 7
14 21 28 35 42 49 56 63 70 77 84
224 231 238 245 252 259 266 273 280 287 294
0 100 200 300 400 500 500 1000 1500 2000 2500 -2 8 -2 1 -1 4
-7 0 7 14 21 28 35 42 49 56 63 70 77 84 224 231 238 245 252 259 266 273 280 287 294 0
500 1000 1500
Cycle 2 Cycle 3
C
Pre
ALT-803
Cycle 1
Cycle 2
Cycle 3
Post ALT-803 2 week break 29 week breakA
Cycle 2 Cycle 3 Cycle 1 Cycle 2 Cycle 3
D
Fold change in
% ki-67
+CD8 + T cells
Fold change in % ki-67 +NK cells
* * * * *
Days post ALT-803 Days post ALT-803
-2 8 -2 1 -1 4
-7 0 7 14 21 28 35 42 49 56 63 70 77 84 231 238 245 252 259 266 273 280 287 294
0 2 4 6 8 10 12 14 -2 8 -2 1 -1
4 -7 0 7 14 21 28 35 42 49 56 63 70 77 84
231 238 245 252 259 266 273 280 287 0 5 10 15 20 25 294 Pre
treat Cycle 1 Cycle 2 Break Cycle 3 Post treat
Pre
treat Cycle 1 Cycle 2 Break Cycle 3 Post treat
Pre
treat Cycle 1 Cycle 2 Break Cycle 3 Post treat Pre
treat Cycle 1 Cycle 2 Break Cycle 3 Post treat Log 10 NK cells/μL blood
Log10 Virus CEQ/mL
E
F
G
H
2 3 4 5 2.0
2.5 3.0 3.5
2 3 4 5 2.0
2.5 3.0 3.5
2 3 4 5 1.5
2.0 2.5 3.0
2 3 4 5 1.5
2.0 2.5 3.0
FIG 3Subsequent cycles of ALT-803 treatment have a similar ability to boost cell populations but differential effects on viral loads. (A)
Schematic of ALT-803 treatment. Days of ALT-803 delivery are indicated with arrowheads. (B) Plasma viral loads (log10virus copy
equivalents/ml) determined at each time point. (C and D) Total CD8⫹cells (C) or NK cells (D) present in PBMC were determined as
indicated in Materials and Methods and Fig. 1. Total CD8⫹T cells or NK cells perl of blood were calculated based on complete blood
counts. (E and F) The ki-67⫹subpopulations of CD8⫹T cells (CD3⫹CD8⫹NKG2A⫺) (E) or NK cells (CD3⫺CD8⫹NKG2A⫹) (F) from PBMC
(Continued on next page)
February 2018 Volume 92 Issue 3 e01748-17 jvi.asm.org 6
on November 6, 2019 by guest
http://jvi.asm.org/
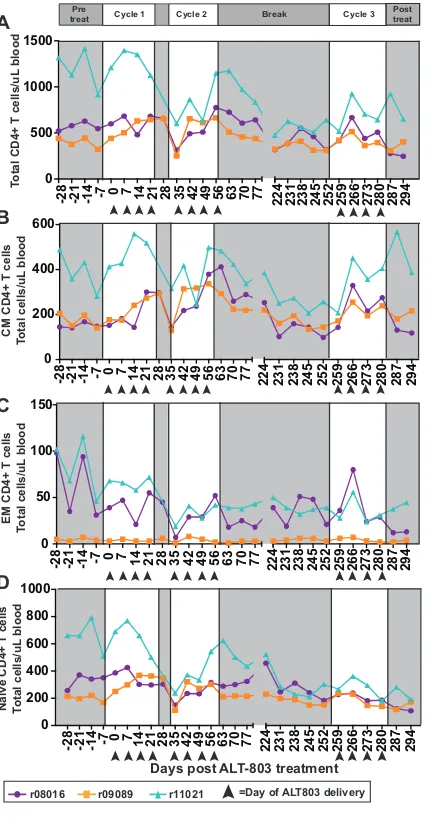
[image:6.585.42.477.69.684.2]No significant changes were observed in total CD4
⫹T cells throughout the study (Fig.
5A). When we examined subpopulations of CD4
⫹T cells, we found no significant
changes in central memory (Fig. 5B), effector memory (Fig. 5C), or naive (Fig. 5D) CD4
⫹T cell subpopulations during treatment with ALT-803.
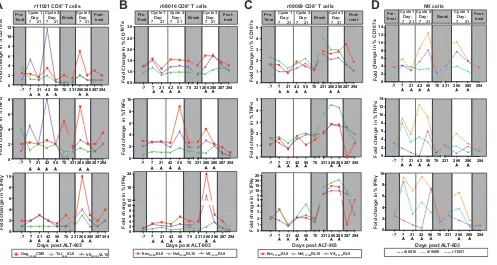
Ex vivo
virus-specific CD8
ⴙT cell and NK cell function do not correlate with
ALT-803-dependent virus suppression.
Both CD8
⫹T cells and NK cells play key roles
in control of SIV replication (26–28). Therefore, we wanted to determine if virus-specific
CD8
⫹T cells exhibited an ALT-803-dependent increase in their capacity to produce the
cytokines gamma interferon (IFN-
␥
) and tumor necrosis factor alpha (TNF-
␣
) as well as
increased surface expression of CD107a as a marker of degranulation. We performed
peripheral blood mononuclear cell (PBMC) intracellular cytokine staining (ICS) assays at
several time points after ALT-803 treatment in the presence or absence of SIV peptides
FIG 3Legend (Continued)
were stained according to Table 2. The fold change in ki-67 relative to the pretreatment level was calculated for each time point. Student’s
unpairedttest analysis was performed as indicated in Materials and Methods; significance relative to all pretreatment time points (*,Pⱕ
0.05;**,Pⱕ0.01) is shown. (G and H) Pearson correlation coefficients (R) were calculated as indicated in Materials and Methods to
determine the relationship between plasma viral loads (log10CEQ/ml) and log10CD8⫹T cells/l plasma (G) or log10NK cells/l plasma
(H) during ALT-803 cycle 2 (left) and cycle 3 (right). N.S., not significant.
-2
8
-2
1
-1
4 -7 0 7 14 21 28 35 42 49 56 63 70 77
224 231 238 245 252 259 266 273 280 287 294
0 100 200 300 400
-2
8
-2
1
-1
4 -7 0 7 14 21 28 35 42 49 56 63 70 77 224 231 238 245 252 259 266 273 280 287 294
0 100 200 300 400 500 500 1000 1500 2000 2500
-2
8
-2
1
-1
4 -7 0 7 14 21 28 35 42 49 56 63 70 77 224 231 238 245 252 259 266 273 280 287 294
0 50 100 150 200
-2
8
-2
1
-1
4
-7 0 7 14 21 28 35 42 49 56 63 70 77
224 231 238 245 252 259 266 273 280 287 294
0 250 500 750 1000
-2
8
-2
1
-1
4 -7 0 7
14 21 28 35 42 49 56 63 70 77 224 231 238 245 252 259 266 273 280 287 294
0 20 40 60 80
-2
8
-2
1
-1
4 -7 0 7 14 21 28 35 42 49 56 63 70 77
224 231 238 245 252 259 266 273 280 287 294
0 50 100 150 200 250
CM CD8+ T cells
T
o
tal cells/uL
blood
EM CD8+ T cells
T
o
tal cells/uL
blood
Naїve CD8+ T cells To
tal cells/uL
blood
CD16+CD56- NK cells T
o
tal cells/uL
blood
CD56+CD16- NK cells T
o
tal cells/uL
blood
CD16-CD56- NK cells To
tal cells/uL
blood
r09089 r11021
r08016 =Day of ALT-803 delivery
Days post ALT-803 treatment Days post ALT-803 treatment
A
B
C
D
E
F
FIG 4Assessment of memory CD8⫹T cell populations and NK cell populations during cycles 1 to 3 of ALT-803 treatment. (A to C) Fresh PBMC
were isolated from whole-blood samples and were stained as described in Materials and Methods and Table 4, and central memory (CM; CD28⫹
CD95⫹CCR7⫹) (A), effector memory (EM; CD28⫺CD95⫹CCR7⫺) (B), and naive (CD28⫹CD95⫺CCR7⫹) (C) CD8⫹T cells were defined from the
CD3⫹CD8⫹parent population. Total cell numbers were determined based on complete blood counts. (D to F) Fresh PBMC were isolated as
described for panels A to C and were stained as indicated in Materials and Methods and Table 2. CD16⫹CD56⫺(D), CD56⫹CD16⫺(E), and CD16⫺
CD56⫺(F) NK cell populations were defined from the CD3⫺CD8⫹NKG2A⫹parent population. Total cell numbers were determined based on
complete blood counts.
on November 6, 2019 by guest
http://jvi.asm.org/
[image:7.585.43.501.77.429.2]known to be presented by either
Mamu-B
*
08
(Env
573–581KL9, Nef
137–146RL10, and
Vif
123–131RL9 [29–31]) or
Mamu-A
*
01
(Gag
181–189CM9, Tat
28 –35SL8, and Vif
100 –109VL10
[32, 33]). The percentages of CD107a, TNF-
␣
, and IFN-
␥
⫹CD8
⫹T cells were measured
and normalized to a no-peptide control for each time point. We saw no consistent
evidence of increased CD8
⫹T cell function during cycle 1, when there was the greatest
virus suppression (Fig. 6A to C). We observed occasional increases in CD8
⫹T cell
function in individual animals that coincided with each ALT-803 treatment cycle (i.e.,
upregulation of CD107a in animal r11021 at day 7 compared to pretreatment for
Vif
100 –109VL10 peptide); however, no statistically significant common trend was
ob-served in cytokine or degranulation marker upregulation among all animals (data not
shown). These data suggest that there was no clear correlation between
in vivo
virus
suppression and the function of the peripheral CD8
⫹T cells specific for the peptides
that we tested. It is possible that CD8
⫹T cells targeting entirely different peptides
exhibited ALT-803-dependent increased function or that CD8
⫹T cells in the tissues
were more effective, but we were unable to explore these possibilities in this study.
-2
8
-2
1
-1
4 -7 0 7 14 21 28 35 42 49 56 63 70 77
224 231 238 245 252 259 266 273 280 287 294
0 200 400 600
-2
8
-2
1
-1
4 -7 0 7 14 21 28 35 42 49 56 63 70 77
224 231 238 245 252 259 266 273 280 287 294
0 50 100 150
-2
8
-2
1
-1
4 -7 0 7 14 21 28 35 42 49 56 63 70 77
224 231 238 245 252 259 266 273 280 287 294
0 200 400 600 800 1000
CM CD4+ T cells
T
o
tal cells/uL
blood
EM CD4+ T cells
T
o
tal cells/uL
blood
Naїve CD4+ T cells To
tal cells/uL
blood
Days post ALT-803 treatment
B
-2
8
-2
1
-1
4 -7 0 7 14 21 28 35 42 49 56 63 70 77
224 231 238 245 252 259 266 273 280 287 294
0 500 1000 1500
T
o
tal CD4+ T cells/uL
blood
A
C
D
r09089 r11021
r08016 =Day of ALT803 delivery Pre
treat Cycle 1 Cycle 2 Break Cycle 3 Post treat
FIG 5CD4⫹T cell populations are minimally altered during ALT-803 treatment. (A to D) Peripheral blood
samples were stained as indicated in Table 4. Total CD4⫹T cells (A), central memory (CM) CD4⫹T cells
(CD28⫹CD95⫹CCR7⫹) (B), effector memory CD4⫹T cells (CD28⫺CD95⫹CCR7⫺) (C), and naive CD4⫹T
cells (CD28⫹CD95⫺CCR7⫹) (D) in the peripheral blood were determined as indicated in Materials and
Methods and calculated based on complete blood counts.
February 2018 Volume 92 Issue 3 e01748-17 jvi.asm.org 8
on November 6, 2019 by guest
http://jvi.asm.org/
[image:8.585.98.316.70.480.2]We also measured ALT-803 enhancement of NK cell function at the same time points
using a method described previously (34) (Fig. 6D). Although ALT-803 appeared to
transiently increase the function of NK cells, there was no statistically significant
correlation between NK cell activity and virus suppression across the three cycles of
ALT-803 treatment.
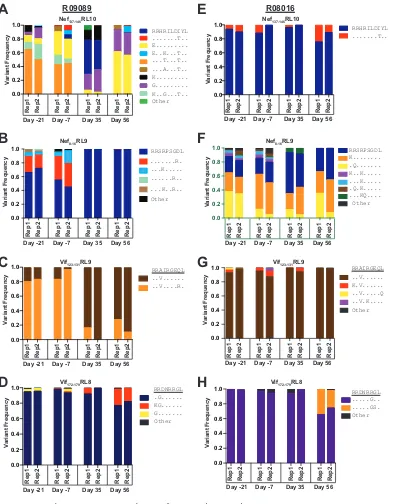
The amino acid composition of a subset of CD8
ⴙT cell epitopes is altered by
ALT-803 treatment.
We wanted to determine if ALT-803-dependent expansion of
CD8
⫹T cells preceded changes in the sequences of the replicating virus population. We
deep sequenced virus populations in duplicate from two of the
Mamu-B
*
08
⫹animals
at two time points before and two time points after treatment with ALT-803. We
quantified the frequency of different amino acid sequences of epitopes that are
restricted by
Mamu-B
*
08
.
For animal r09089, we found that the composition of amino acid sequences in the
epitopes Nef
137–146RL10 (Fig. 7A), Nef
8 –16RL9 (Fig. 7B), and Vif
123–131RL9 (Fig. 7C) were
different before and after ALT-803 treatment. For animal r08016, there were
fluctua-tions in the frequencies of variants in Nef
8 –16RL9 (Fig. 7F), and we detected a new
variant in the Vif
172–179RL8 epitope (Fig. 7H) on day 56. The other epitopes for this
animal displayed no dramatic changes (Fig. 7E and G). Unfortunately, we cannot
determine if these changes in the virus populations were a consequence of latent virus
reactivation or selection of new virus populations, but it does indicate that perturbing
the homeostasis of the CD8
⫹T cell population corresponded to an effect on the
sequences of the replicating virus population.
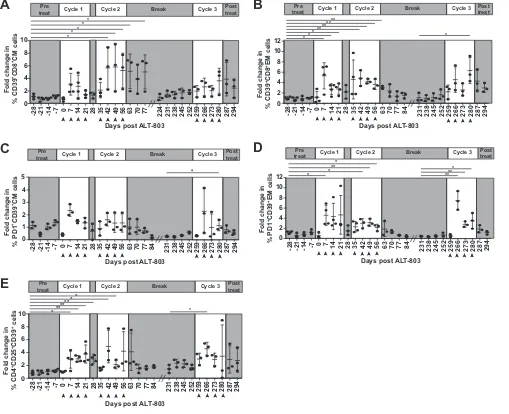
ALT-803 promotes upregulation of inhibitory markers CD39 and PD-1 on CD8
ⴙT cells and the development of regulatory CD4 T cells.
We next wanted to
deter-mine if there were changes in the phenotypes of CD8
⫹T cell and NK cell populations
Fold Change in % CD107a
Fold change in %TNFα
Fold change in %
IF
Nγ
Days post ALT-803
A
B
r08016 r09089 r11021 -7 7 21 42 56 70 231 266 280 294 0 2 4 6 8 10 12 14
-7 7 21 42 56 70 231266 280 294 0 2 4 6 8 10
-7 7 21 42 56 70 231 266 280 294 0 2 4 6 8 10 12 14 -7 7 21 4256 70 231 266 280 287 294
0 2 4 6 8 10 12
-7 7 21 42 56 70 231 266 280 287 294 0
2 4 6 8
-7 7 21 42 56 70 231 266 280 287 294 0 2 4 6 8 10
-7 7 21 42 56 70 231 266 280 287 294 0.5 1.0 1.5 2.0 2.5 3.0
-7 7 21 42 56 70 231 266 280 287 294 0 2 4 6 8 10
-7 7 21 42 56 70 231 266 280 287 294 0 2 4 6 8 10 12 18 24
-7 7 21 42 56 70 231 266 280 287 294 0 1 2 3 4 5
-7 7 21 42 56 70 231 266 280 287 294 0 1 2 3 4 5
-7 7 21 42 56 70 231 266 280 287 294 0 1 2 3 4 5 5 10 15 20 25
Gag181-189CM9 Tat28-35SL8 Vif100-109VL10 Env573-581KL9 Nef137-146RL10 Vif123-131RL9
Fold Change in % CD107a
Fold change in %TNFα
Fold change in %
IF Nγ Pre-Treat Cycle 1 Day: 7 21 Cycle 2 Day: 7 21 Break Cycle 3 Day: 7 21 Post-treat
r11021 CD8+ T cells
Pre-Treat Cycle 1 Day: 7 21 Cycle 2 Day: 7 21 Break
Cycle 3 Day: 7 21
Post-treat
r08016 CD8+ T cells
Days post ALT-803
Pre-Treat Cycle 1 Day: 7 21 Cycle 2 Day: 7 21 Break Cycle 3 Day: 7 21 Post-treat
r09089 CD8+ T cells
F
old C
h
a
n
ge in % C
D107a
Fold change in %TNFα
Fold change in %
IF
Nγ
Days post ALT-803
Pre-Treat Cycle 1 Day: 7 21 Cycle 2 Day: 7 21
Break Cycle 3Day: 7 21
Post-treat
Days post ALT-803
Fold Change in % CD
107a
Fold change in %TNFα
Fold change in %
IF
Nγ
C
D
NK cellsEnv573-581KL9 Nef137-146RL10 Vif123-131RL9
FIG 6CD8⫹T cell responsiveness to peptide in ICS assays is similar in all three cycles of ALT-803 treatment. (A to C) Frozen PBMC were rested overnight, and
ICS assays were performed as described in Materials and Methods using the indicated A*01-restricted (Gag181–189CM9, Tat28 –35SL8, and Vif100 –109VL10; animal
r11021) (A) or B*08-restricted (Env573–581KL9, Nef137–146RL10, Vif123–131RL9; animals r08016 and r09089) (B and C) peptides or a no-peptide control. Cells were
stained as shown in Table 6, and live CD8⫹T cells were defined as CD3⫹CD8⫹CD4⫺. Within the CD8⫹T cell gate, the percentages of CD107a⫹(top), TNF-␣⫹
(middle), and IFN-␥⫹(bottom) were determined individually. The data then were normalized to the no-peptide control for each individual time point. (D) Fresh
PBMC were used to perform ICS assays as indicated in Materials and Methods. Cells were stained with antibodies according to Table 3. NK cells were defined
as CD3⫺CD8⫹NKG2A⫹. The percentages of CD107a⫹(top), TNF-␣⫹(middle), and IFN-␥⫹(bottom) cells were determined and normalized to a control sample
(no. 721.221 cells).
on November 6, 2019 by guest
http://jvi.asm.org/
[image:9.585.47.544.73.338.2]that may have had an effect on their
in vivo
function. We measured activation (HLA-DR,
CD25, and CD69) and inhibitory/exhaustion (CD39 and PD-1) markers present on CD4
⫹and CD8
⫹T cell memory populations and NK populations throughout all three ALT-803
treatment cycles by flow cytometry.
We detected notable changes in the expression of CD39 on CD8
⫹T cells during the
course of treatment. CD39 is an ectonucleotidase that hydrolyzes extracellular ATP (35),
and CD4
⫹and CD8
⫹T cells expressing CD39 can inhibit cytokine production from
[image:10.585.43.440.70.574.2]Day -21 V a ri a nt Fr e que nc y E... G... RRHRILDIYL K... Other
Rep1 Rep2 Rep1 Rep2 Rep1 Rep2 Rep1 Rep2 0.0 0.2 0.4 0.6 0.8 1.0
Day -7 Day 35 Day 56
0.0 0.2 0.4 0.6 0.8 1.0 V ari an t F req u en cy RRHRILDIYL ...T.. Day -21
Rep1 Rep2 Rep1 Rep2 Rep1 Rep2 Rep1 Rep2 Day -7 Day 35 Day 56
0.0 0.2 0.4 0.6 0.8 1.0 ...K..R.. Other Day -21
Rep1 Rep2 Rep1 Rep2 Rep1 Rep2 Rep1 Rep2 Day -7 Day 35 Day 56
0.0 0.2 0.4 0.6 0.8 1.0 Day -21
Rep1 Rep2 Rep1 Rep2 Rep1 Rep2 Rep1 Rep2 Day -7 Day 35 Day 56
0.0 0.2 0.4 0.6 0.8 1.0 Day -21
Rep1 Rep2 Rep1 Rep2 Rep1 Rep2 Rep1 Rep2 Day -7 Day 35 Day 56 0.0 0.2 0.4 0.6 0.8 1.0 Day -21
Rep1 Rep2 Rep1 Rep2 Rep1 Rep2 Rep1 Rep2 Day -7 Day 35 Day 56
0.0 0.2 0.4 0.6 0.8 1.0 Day -21
Rep1 Rep2 Rep1 Rep2 Rep1 Rep2 Rep1 Rep2 Day -7 Day 35 Day 56 0.0 0.2 0.4 0.6 0.8 1.0 Day -21
Rep1 Rep2 Rep1 Rep2 Rep1 Rep2 Rep1 Rep2 Day -7 Day 35 Day 56
V ari an t F req u en c y V ari an t F req u en cy V a ri an t F req u en cy V a ri an t F req u e n cy V ari an t F req u e n c y V ari an t F req u e n c y RRAIRGEQL ..V... ..V....R. RRSRPSGDL ...R. ...K... ...R.. RRDNRRGL .G... KG... G... Other RRDNRRGL ...G.. ...GS. Other RRAIRGEQL ..V... K.V... ..V...Q Other ..V.K.... RRSRPSGDL K... .Q... K..K... ...K... .Q.K... ...KQ.... Other ...T.. K..G...T.. E..K...T.. ...T...T.. ...A...T..
Nef137-146RL10 Nef137-146RL10
R09089 R08016
H
G
F
E
A
B
C
D
Nef8-16RL9 Nef8-16RL9
Vif123-131RL9 Vif123-131RL9
Vif172-179RL8 Vif172-179RL8
FIG 7Distinct viral variants appear in severalMamu-B*08-restricted epitopes during ALT-803 treatment. (A) Deep-sequencing analysis was performed, as described in Materials and Methods, on plasma samples from animals r09089 and r08016. The time
points shown are relative to the first ALT-803 treatment. Viral variant frequencies were determined for Nef137–146RL10 (A and
E), Nef8 –16RL9 (B and F), Vif123–131RL9 (C and G), and Vif172–179RL8 (D and H). Amino acid variation relative to the wild-type
sequence for each epitope is indicated by letters; amino acids that were the same as those of the wild-type sequence are shown as dots.
February 2018 Volume 92 Issue 3 e01748-17 jvi.asm.org 10
on November 6, 2019 by guest
http://jvi.asm.org/
CD39-negative T cells (36–38). High surface expression of CD39 has been linked to
terminal exhaustion of CD8
⫹T cells in chronic HIV infection (39). We found that CD39
⫹central memory CD8
⫹T cells increased most prominently during the second cycle of
ALT-803, whereas effector memory CD8
⫹T cells increased over the baseline during
each cycle of ALT-803 treatment (Fig. 8A and B). While no significant changes were
observed in overall PD-1 expression in either effector memory or central memory CD8
⫹T cells (data not shown), we did not find many changes in CD39/PD-1 double-positive
cells in the central memory CD8
⫹T cell subpopulations (Fig. 8C); we found significant
increases in the effector memory CD8
⫹T cell populations that coexpressed both CD39
and PD-1 (Fig. 8D). This double-positive population was statistically significant during
the second cycle of ALT-803 treatment, coincident with reduced effect of ALT-803 on
viral loads (Fig. 3B). The expression of these markers alone is not necessarily a hallmark
*** ****
**
*
Fold change in
% CD4
+CD25 +CD39 + cells
Fold change in
% CD39
+CD8 +CM cells
Fold change in
% CD39
+CD8 +EM cells
Fold change in
% PD1
+CD39 +CM cells
Fold change in
% PD1
+CD39 +EM cells *
* * * *
*
** ***
**** **
*
*** *
* ****
*
Days post ALT-803 Days post ALT-803
Days post ALT-803 Days post ALT-803
Days post ALT-803
-2
8
-2
1
-1
4 -7 0 7 14 21 28 35 42 49 56 63 70 77 84
231 238 245 252 259 266 273 280 287 0
2 4 6 8 10
-2
8
-2
1
-1
4 -7 0 7 14 21 28 35 42 49 56 63 70 77
224 231 238 245 252 259 266 273 280 287 294 0
2 4 6 8 10
-2
8
-2
1
-1
4 -7 0 7
14 21 28 35 42 49 56 63 70 77 84 231 238 245 252 259 266 273 280 287 0
2 4 6 8 10 12
-2
8
-2
1
-1
4
-7 0 7 14 21 28 35 42 49 56 63 70 77 84 231 238 245 252 259 266 273 280 287 0
2 4 6 8 10 12
-2
8
-2
1
-1
4 -7 0 7 14 21 28 35 42 49 56 63 70 77 84
231 238 245 252 259 266 273 280 287 0
1 2 3 4 5
294
294 294
294
A
B
C
D
E
Pre
treat Cycle 1 Cycle 2 Break Cycle 3 Post treat
Pre
treat Cycle 1 Cycle 2 Break Cycle 3 Post treat
Pre
treat Cycle 1 Cycle 2 Break Cycle 3 Post treat
Pre
treat Cycle 1 Cycle 2 Break Cycle 3 Post treat Pre
treat Cycle 1 Cycle 2 Break Cycle 3 Post treat
FIG 8ALT-803 increases CD39⫹CD8⫹effector memory and central memory T cells and regulatory T cells (T
regs) (A and B) CD39⫹cells were determined for the
parent central memory (CM; CD3⫹CD8⫹CD28⫹CD95⫹CCR7⫹) and effector memory (EM; CD3⫹CD8⫹CD28⫹CD95⫹CCR7⫺) CD8⫹T cell populations as
described in Materials and Methods and Table 4. The fold change in CD39 expression was determined relative to the average of the pretreatment time points.
Student’s unpairedttest analysis was performed as described in Materials and Methods; significance relative to all pretreatment time points (*,Pⱕ0.05;**,
Pⱕ0.01) is shown. (C and D) PD-1⫹cell levels were determined for each of the CD39⫹CM and EM CD8⫹T cell parent populations. The fold changes in PD-1⫹
CD39⫹for CM and EM CD8⫹T cells were calculated as described for panels A and B. Statistics were performed as described for panels A and B. (E) T
regswere
defined as CD45⫹CD3⫹CD4⫹cells that were both CD25 and CD39 positive. The fold change in T
regswas determined as described for panels A to D. Statistics
were performed as indicated for panels A and B.
on November 6, 2019 by guest
http://jvi.asm.org/
[image:11.585.41.550.75.489.2]of immune exhaustion (40). Furthermore, we did not measure peptide-specific
stimu-lation from this double-positive popustimu-lation of cells; therefore, the CD39
⫹PD-1
⫹cells
cannot definitively be declared exhausted. However, these data suggest that
continu-ous ALT-803 treatment does lead to an increase in a population of CD8
⫹T cells that
express regulatory markers and inhibit
in vivo
cytokine production.
We additionally observed increases in CD39
⫹CD25
⫹CD4
⫹T cells in all three cycles
of treatment (Fig. 8E). The coexpression of CD39 with CD25 on CD4
⫹or CD8
⫹T cells
is indicative of a T regulatory (Treg) phenotype (36, 41, 42). Thus, continuous ALT-803
treatment boosted the frequencies of regulatory T cells.
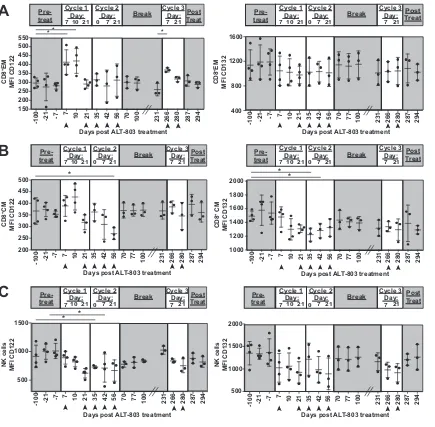
Surface expression of the IL-15 receptor declines during the second cycle of
ALT-803 treatment.
ALT-803-dependent cell activation requires that the modified
IL-15 of the ALT-803 molecule interacts with the IL-15/IL-2

(CD122) and the common
␥
C (CD132) receptors present on target cells. Modulation of the surface expression of
these receptors has been observed in other
in vivo
IL-15 treatment models (25). To
determine if ALT-803 modulated surface expression of the IL-15 receptor, we used flow
cytometry to measure the mean fluorescence intensity (MFI) of these two receptors
during treatment. We found a significant increase in surface expression of CD122 (as
indicated by MFI) on CD8
⫹EM T cells at days 7 and 10 after the first ALT-803 treatment
(Fig. 9A, left). However, the surface expression of CD122 returned to pretreatment levels
with continued ALT-803 treatment. We found that the surface expression of CD122 did
not increase during the second phase of treatment but once again transiently increased
during the first 7 days of the third cycle of ALT-803 treatment (Fig. 9A, left). We did not
observe any significant changes in the expression of CD132 during ALT-803 treatment
in the CD8
⫹EM T cell population (Fig. 9A, right).
In contrast, we found that CD8
⫹CM T cells exhibited a transient decline in the surface
expression of both CD122 (Fig. 9B, left) and CD132 (Fig. 9B, right) during the second phase
of ALT-803 treatment. In addition, NK cells exhibited a decline in the expression of CD122
during the second phase of ALT-803 treatment (Fig. 9C).
Overall, the changes in the expression of these receptors are consistent with the
hypothesis that memory CD8
⫹T cells and NK cells initially respond to ALT-803 but then
surface expression of the receptor declines, likely translating to reduced responsiveness
of these cell populations over time.
DISCUSSION
In this study, we show that treatment of SIV
⫹animals with the IL-15 superagonist
ALT-803 can suppress virus replication to undetectable levels in the absence of ART. We
selected four SIV
⫹rhesus macaques who had been infected for more than 1.5 years and
who had plasma viremia ranging from 10
3to 10
4copies/ml. Within the first 2 weeks
after the initial treatment with ALT-803, SIV plasma viremia reached undetectable levels
in all four animals. Virus suppression was coincident with increased peripheral CD8
⫹T
cell and NK cell counts. Virus suppression, however, was only transient. Even with ongoing
ALT-803 treatment, plasma viremia rebounded. Remarkably, ALT-803-dependent virus
suppression was partially restored in the three animals that resumed ALT-803 treatment
after a break of 29 weeks. These data together suggest that the host immune response
can be modulated by ALT-803 to control SIV replication in chronically infected
ma-caques, even without ART.
Unfortunately, the specific mechanism of virus suppression remains unknown. Our
data suggest that the expansion of immune cells in the peripheral blood played a key
role in this suppression. We found that the frequencies of CD8
⫹T cells and NK cells
were inversely correlated with plasma viremia during the treatment cycles when
animals responded to ALT-803. We did observe significant increases in the population
of ki-67
⫹CD8
⫹T cells and NK cells in the first cycle and then a significant increase in
ki-67
⫹CD8
⫹T cells during the third cycle of ALT-803 (Fig. 4), suggesting that increased
T cell proliferation in the blood was a factor in improving antiviral immunity. We also
measured the function of SIV-specific CD8
⫹T cells by intracellular cytokine assays, but
there was no correlation between increased epitope-specific cytokine production and
February 2018 Volume 92 Issue 3 e01748-17 jvi.asm.org 12
on November 6, 2019 by guest
http://jvi.asm.org/
suppression of plasma SIV viremia. Additional studies will need to be performed to
elucidate the immunological mechanism explaining how ALT-803 reduced viral loads in
the first and third treatment cycles, so that altered treatment regimens can be
identi-fied to sustain virus suppression for a longer period of time.
For an anti-HIV immunomodulatory therapeutic to be effective, it will need to
stimulate host immunity to continuously suppress viremia for a long period of time,
even though mechanisms exist to prevent overactivation of the host immune system.
We chose animals who were ART naive to assess whether immunomodulation, without
ART, could induce and maintain virus suppression in these specific animals. Not
surprisingly, suppression of virus replication was only transient, as these animals
employed mechanisms to prevent overstimulation. These mechanisms included
down-regulation of the IL-15 receptors (CD122 and CD132) on target cells. We found that
Days post ALT-803 treatment
CD8
+EM
MFI CD122
Days post ALT-803 treatment
Days post ALT-803 treatment
CD8
+CM
MFI CD122
Days post ALT-803 treatment
CD8
+ CM
MFI CD132
Days post ALT-803 treatment
NK cells
MFI CD122
Days post ALT-803 treatment * * * * * * * *
A
B
C
-100 -2 1 -7 710 21 35 42 56 70 100 231 266 280 287 294 150 200 250 300 350 400 450 500 550 -100 -2 1
-7 7 10 21 35 42 56 70 77
100 231 266 280 287 294 200 250 300 350 400 450 500 -100 -2
1 -7 7 10 21 35 42 56 70 77
100 231 266 280 287 294 500
1000 1500
-100 -2
1 -7 7 10 21 35 42 56 70 77
100 231 266 280 287 294 400
800 1200 1600
-100 -2 1 -7 7
10 21 35 42 56 70 77 100 231 266 280 287 294 1000 1200 1400 1600 1800 2000 -100 -2 1 -7 7
10 21 35 42 56 70 77 100 231 266 280 287 294 500 1000 1500 2000 Cycle 1 Day:
7 10 21
Cycle 2 Day:
0 7 21
Cycle 3 Day:
Pre-treat Break 7 21
Post Treat
Cycle 1 Day:
7 10 21
Cycle 2 Day:
0 7 21
Cycle 3 Day:
Pre-treat Break 7 21
Post Treat CD8 +EM MFI CD132 Cycle 1 Day:
7 10 21
Cycle 2 Day:
0 7 21
Cycle 3 Day:
Pre-treat Break 7 21
Post Treat
Cycle 1 Day:
7 10 21
Cycle 2 Day:
0 7 21
Cycle 3 Day:
Pre-treat Break 7 21
Post Treat
Cycle 1 Day:
7 10 21
Cycle 2 Day:
0 7 21
Cycle 3 Day:
Pre-treat Break 7 21
Post Treat
Cycle 1 Day:
7 10 21
Cycle 2 Day:
0 7 21
Cycle 3 Day:
Pre-treat Break 7 21
Post Treat
NK cells MFI CD132
FIG 9IL-15 receptors(CD122) and␥C (CD132) fluctuate with continued ALT-803 delivery. (A) Frozen PBMC were stained as described
in Table 5, and effector memory (EM) CD8⫹T cells were defined as CD3⫹CD8⫹CD28⫹CD95⫺CCR7⫺. From this population of cells, the
mean fluorescence intensity (MFI) was determined for CD122 (left) and CD132 (right). Student’s unpairedttests were performed as
described in Materials and Methods; statistically significant events (*,Pⱕ0.05;**,Pⱕ0.01) are marked. (B) Frozen PBMC were stained
as described for panel A, and central memory CD8⫹T cells were defined as CD3⫹CD8⫹CD28⫹CD95⫹CCR7⫹. The MFI then was
determined for CD122 (left) and CD132 (right) for this parent population for the indicated times. Statistics were performed as indicated
for panel A. (C) NK cells were defined as CD3⫺CD8⫹NKG2A⫹. CD122 (left) and CD132 (right) MFI are shown. Statistics were performed
as indicated for panel A.
on November 6, 2019 by guest
http://jvi.asm.org/
[image:13.585.43.478.69.496.2]CD122 expression on effector memory cells increased during the first treatment cycle
(Fig. 9A), but then the expression of both CD122 and CD132 on effector and central
memory CD8
⫹T cells declined as viral loads rebounded (Fig. 9A and B). Expression of
CD122 was restored by the third cycle of treatment. These data indicate that (i)
downregulation of CD122 and CD132 occurs during continuous ALT-803 treatment,
thereby reducing the efficacy of the agent, and (ii) IL-15 responsiveness can be restored
after a sufficient recovery period.
We observed increased expression of PD-1 and CD39 on CD8
⫹T cells as an
additional mechanism to prevent overstimulation of the host immune response.
En-hanced expression of these markers was particularly noticeable during the second cycle
of ALT-803, when there was no suppression of viremia. While this was only
observa-tional, it suggests that with continuous ALT-803 treatment, particularly during chronic
SIV infection, these cell populations have decreased
in vivo
cytokine production. One
caveat is that increased expression of PD-1 and CD39 was observed coincident with the
decline in viremia during the first treatment cycle (Fig. 3B and 8C and D). It is possible
that expression of PD-1 and CD39 was increased after the necessary immune response
brought about virus suppression. Perhaps more frequent characterization of these cell
populations during the first week of ALT-803 treatment in future studies will better
define the timeline of virus suppression and corresponding changes in cellular
pheno-types. It also is possible that the expression of PD-1 and CD39 on these populations of
CD8
⫹T cells was not indicative of exhaustion. Studies have suggested that PD-1 and
CD39 can be upregulated during early CD8
⫹T cell activation (43) and may not always
mark exhausted T cells (40). Our ICS data (Fig. 6) measured cytokine production from
the overall population of epitope-specific CD8
⫹T cells rather than the PD-1
⫹CD39
⫹subpopulation. Future work can elucidate the mechanism and timing of PD-1 and CD39
upregulation and whether