I hereby declare that I have read through this report entitle “Frequency Response Analysis on Solar Cells and found that it has comply the partial fulfilment for awarding the degree
of Bachelor of Electrical Engineering (Industrial Power)
Signature : ... Supervisor’s Name : Mohd Shahril Bin Ahmad Khiar
FREQUENCY RESPONSE ANALYSIS ON SOLAR CELL
AHMAD UZAIR BIN AHMAD SUHAIMI
A report submitted in partial fulfilment of the requirements for the degree of
Bachelor of Electrical Engineering (Industrial Power)
Faculty of Electrical Engineering
UNIVERSITI TEKNIKAL MALAYSIA MELAKA
iii
“I declare that this report entitle “Frequency Response Analysis on Solar Cell” is the result of my own research except as cited in the references. The report has not been accepted for
any degree and is not concurrently submitted in candidature of any other degree.
iv
ACKNOWLEDGEMENT
Assalamualaikum warahmatullahi taala wabarakatuh,
First and foremost, I would like to thank to Allah the Almighty for giving me the opportunity to complete my Final Year Project. I would like to thank my supervisor, En Mohd. Shahril Bin Ahmad Khiar for his kindness to accept me as one of the students under his supervision. His guidance, encouragement, critics and knowledge have deserved him to receive my biggest appreciation after all this while putting up much effort to see me succeed in completing this project
v
ABSTRACT
vi
ABSTRAK
vii
TABLE OF CONTENTS
CHAPTER TITLE PAGE
ACKNOWLEDGEMENT iv
ABSTRACT v
TABLE OF CONTENTS vii
LIST OF TABLES x
LIST OF FIGURES xi
LIST OF ABBREVIATIONS xiii
LIST OF APPENDICES xv
1 INTRODUCTION 1
1.1 Background 1
1.2 Motivation 2
1.3 Problem Statement 2
1.4 Objectives 3
1.5 Scope of Study 3
2 LITERATURE REVIEW 4
2.1 Introduction 4
2.2 Frequency Response Analysis (FRA) and
Earlier Researches 4
2.3 Principle of Frequency Response 5
2.4 Principle of Solar Cell 7
viii
2.5.1 Monocrystalline Silicon Solar Cells 9 2.5.2 Polycrystalline Silicon Solar Cells 10 2.6 Thin-Film Solar Cells (TFSC) 12 2.6.1 Amorphous Silicon (a-Si) Solar Cells 13 2.6.2 Cadmium Telluride (CdTe) Solar Cells 14 2.6.3 Copper Indium Gallium Selenide (CIS/CIGS) Solar
Cells 14
2.7 Understanding of Impedance in Solar Cell 15 2.7 Summary of Literature Review 19
3 METHODOLOGY 20
3.1 Introduction 20
3.2 Flow Chart of the Methodology 21 3.3Detailed Study of Frequency Response Analysis (FRA) and
Solar Cells 22
3.4 Design and Development of Experimental Setup 26 3.5 Setup Experiment Test and Data Caption 28 3.5.1 High Impedance Bridge 28
3.5.2 DC Bias Injector 29
3.5.3 Apparatus and Tools Used in Experiment 29 3.5.4 Design Set-Up of the Experiment 31 3.6 Device Configuration, Calibration and Obtaining the Results 32
3.7 Data Analysis 33
3.6 Summary of Methodology 34
4 RESULT AND DISCUSSION 35
4.1 Introduction 35
ix
5 CONCLUSION 46
5.1 Conclusion 46
5.2 Recommendation 47
REFERENCES 48
x
LIST OF TABLES
TABLE TITLE PAGE
xi
LIST OF FIGURES
FIGURE TITLE PAGE
2.1 Linear Transfer Function With Sine Wave Input 6
2.2 (a) Sinewave Input 6
(b) Steady State Sinewave Response 6 (c) Corresponding Vector Notation 6 2.3 Typical Solar Cell Structure 8 2.4 A Monocrystalline Silicon Solar Cell Wafer 10 2.5 Polycrystalline Solar Cells 11
2.6 Strong Ribbon Solar Cells 12
2.7 Amorphous Silicon Solar Cell 13 2.8 (a) Cadmium Telluride Solar Cells 14 (b) Copper Indium Gallium Selenide (CIS/CIGS) Solar Cell 14 2.9 Response of Solar Cell Using 5.6 V DC Bias 17 2.10 Equivalent Circuit Model of the Measured PV module 17 2.11 Real Part of the Various Impedance Responses 18 2.12 Imaginary Part of the Various Impedance Responses 18
3.1 Flowchart of the Project 21
3.2 Interface of Bode 100 Suite Version 2.41 SR1 22
3.3 Measurement Modes Panel 23
3.4 Calibration Toolbar 23
3.5 Frequency Sweep and Configuration Panel 24
3.6 Trace Panel 24
3.7 Plot Space for Graph Visualization 25
3.8 p-Si Solar Cell 26
xii
3.10 12 V GP Battery 26
3.11 4 x 1.5 V GP Battery 26 3.12 Dynamic Equivalent Circuit of Solar Cell 27 3.13 High Impedance Measurement Bridge 28 3.14 Picotest J2130A DC Bias Injector 29 3.15 Apparatus and Tools Used For Measurement and Data Collection
Process 30
3.16 Experimental Set-Up of Bode 100 and to Solar Cell (DUT) 31 3.17 Trace 1 and Trace 2 Settings 32 3.18 User Calibration Interfaces 32 4.1 Real and Imaginary Responses of mono-Si, 6 V DC Bias Applied 36 4.2 Real and Imaginary Responses of mono-Si, 12 V DC Bias Applied 36 4.3 Real and Imaginary Responses of p-Si, 6 V DC Bias Applied 37 4.4 Real and Imaginary Responses of p-Si, 12 V DC Bias Applied 37 4.5 Admittance of mono-Si, 6 V DC Bias 38 4.6 Admittance of mono- Si, 12 V DC Bias 38 4.7 Admittance of p- Si, 6 V DC Bias 38 4.8 Admittance of p- Si, 12 V DC Bias 38 4.9 All the Real Responses of the Impedance Obtained from
Experimental Procedure 39
4.10 All the Imaginary Responses of the Impedance Obtained from
Experimental Procedure 39
4.11 Equivalent Circuit of mono- Si Solar Cell with 12 V DC V Applied 42 4.12 Equivalent Circuit of p-Si Solar Cell with 12 V DC V Applied 42 4.13 of Real Part of Mono-Si vs. Poly-Si on 6 V DC Bias 44 4.14 Responses of Real Part of Mono-Si vs. Poly-Si on 12 V DC Bias 44
xiii
LIST OF ABBREVIATIONS
PV - Photovoltaic
FRA - Frequency Response Analyzer ECI - Electrochemical Interface DC - Direct current
AC - Alternating current DUT - Device under test
M - Mega
k - Kilo
m - Milli
n - Nano
Hz - Hertz
V - Volt
W - Watt
R - Resistor
L - Inductor
C - Capacitor
S - Siemens
F - Farad
H - Henry
f - Frequency
xiv
LIST OF SYMBOLS
Ω - Ohm
μ - Micro
xv
LIST OF APPENDICES
APPENDIX TITLE PAGE
A Equivalent Circuit of Mono-Si and P-Si Solar Cell with 6 V
DC Bias Applied 49
CHAPTER 1
INTRODUCTION
1.1 Background
Today, from powering a satellite and telescopes in space, to lighting up a solar-powered traffic light on a street; an application of solar energy has rapidly increased and growing over the time. Solar energy is among the renewable energy that important as an alternative to an extinction of fossil fuel generated-electricity like a coal, oil and nuclear energy. Moreover, solar energy is a clean form of energy and this will not give any harm to the environment. Solar energy is generated by a solar panel that is made up of solar cells or known as photovoltaic (PV) cells. It produces electricity by converting the solar light energy to electric energy.
It is very significant to comprehend PV cell characteristics in order to study the performance of PV cells. For application, this includes the basics and expansion of modules, effectiveness assessment and different approaches of measurement. The study of characteristic measurement will resolve information that one may diagnose and developing of material attribute in cell manufacture, to determine PV cell grades for cell manufacture, to validate of appropriate models and to calculate of module operation.
2
1.2 Motivation
Analyzing the solar cell to extract the impedances in it may not be easy to be completed. This project may contribute to an adequate learning of extracting fundamental characteristic and measurement from the solar cell to be analyzed. Frequency response analysis, injected certain range of frequency that reacted with the solar cell to give a response of the characteristic of the solar cell. In previous study of this analysis, there are several methods use to analyze the impedances of the solar cell. There are already recognized familiar methods to analyze the impedance on solar cell, such as Frequency Response Analyzer (FRA) using a technique of impedance and Electrochemical Interface (ECI). FRA using a Vector Network Analyzer – Bode 100 is the new and straightforward way for the condition monitoring technique performs over any devices such as transformer, coaxial cable and eddy-current testing.
1.3 Problem Statement
3
1.4 Objectives
i. To study the function of the FRA device with Frequency Response Analyzer Bode 100 on a solar cell.
ii.
To analyze an experimental test for FRA Network Analyzer Bode 100 to a solar cell.iii. To study the dynamic impedance of solar cell relationship between different types of solar cells and on different range of DC bias injected to solar cells.
1.5 Scope of Study
CHAPTER 2
LITERATURE REVIEW
2.1 Introduction
This chapter explains the related information in order to increase the significance of studying the project. Frequency Response Analysis (FRA) is studied based on its history of earlier use of the technique. Subsequently, this chapter explain about the principle of frequency response and principles of solar cell. Then, types of solar cell, crystalline silicon solar cells and thin-film solar cells is studied and explained clearly. Lastly, this chapter explain about the understanding of impedance in solar cell.
2.2 Frequency Response Analysis (FRA) and Earlier Researches
5
steps, through inserting a pulse into the transformer winding or by applying a sinusoidal wave to do a frequency sweep. The previous technique is called impulse response method and recently known as the swept frequency method. A graph of the amplitude against frequency is plotted from the result and it is used for comparison for the two sets of measurement. Vital changes like a modulation to the pattern of the curve, the development of new resonant frequencies or the withdrawal of current resonant frequencies and huge deviation of current resonant frequencies. FRA is a convinced and competent medium of finding a deficiency in transformer. The major importance of the method belongs in its capability to find faults but nowadays researchers have found various usage of FRA in other DUT. Among of it are solar cell impedance measurement, small signal transformer analysis, battery impedance measurement, equivalent circuit analysis of quartz crystals and low value impedance measurements. Instead of finding fault in DUT, frequency response analysis is used to find the impedance in solar cell for other means. Impedance in a solar cell is a critical specification to observe as it is symbolic to the aging and consequences of sustaining life period of the solar cell. As stated in [2], variations in this parameter deriving out of guideline shall be applied to evaluate the aging period or fault in the solar cell. Moreover, the study can use to create an adequate, decent, eminent power and small-scale switching power conditioner.
2.3 Principle of Frequency Response
6
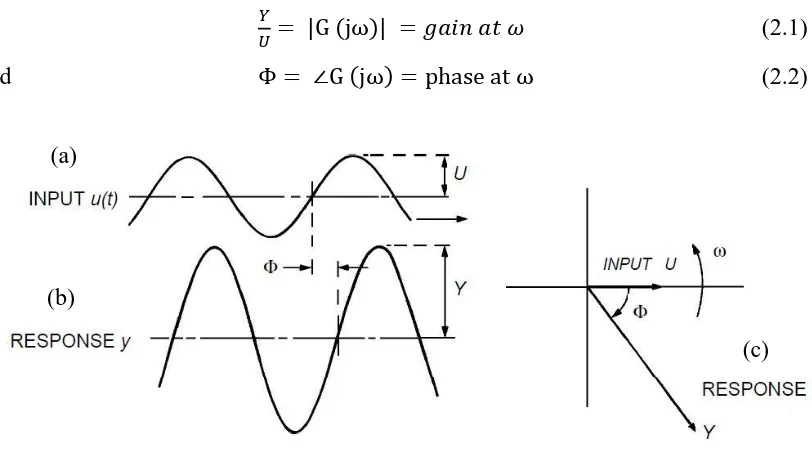
Figure 2.1: Linear Transfer Function with Sine Wave Input [3]
After transients due to earliest circumstances have disintegrated away, the output y(t) turn into a sine wave but with a different magnitude Y and relative phase Φ. The output
y(t) are factually related to the transfer function G(s) by magnitude and phase, at the
frequency (ω rad/s) of the input sinusoid.
(2.1)
[image:21.595.100.506.274.505.2]And (2.2)
Figure 2.2: (a) Sinewave Input. (B) Steady State Sinewave Response. (C) Corresponding Vector Notation [3]
By nature of the electrical device, in theory they have some resistance, inductance and some capacitance values. Accordingly, the complex RLC circuit is formed without exception in every of them. The label 'theoretical' imply several devices should have very little or no resistance correlated to their inductance and capacitance values over, several devices should have very little or no inductance correlated to their resistance and capacitance and over several devices should have very little or no capacitance correlated to their resistance and inductance but theoretically all of them can be analyzed as an RLC circuit notwithstanding may be R = 0, or L = 0 or C = 0. However, in nearly all cases the resistance, inductance and capacitance of equipment have values (non-zero).
u = U sin ωt G(s) y = Y sin (ωt + Φ)
(a)
(b)
7
Consequently, the majority of the electrical equipments can be viewed as an RLC circuit thus they give feedback to the frequencies injected and produce a unique indication.
2.4 Principles of Solar Cell
Solar or photovoltaic (PV) cells are comprised of materials that convert sunlight into electricity. PV technologies along with Concentrating Solar Thermal Plant (CSP) are sustainable energy technologies and are clean energy alternatives, as we are aware, most of the energy consumed today is non-renewable. Moreover, the energy is unclean such as the burning of the fossil fuels. PV cells consist of coatings of semiconductors for example, silicon. Energy is generated when photons of light from the sun collides a solar cell and are captivated inside the semiconductor material. This energizes the semiconductor’s electrons, result in the electrons to discharge, and produce an electric current [4]. The electricity created is direct current (DC) since the flows of charge is in one direction. One PV cell generates only one or two watts which is not a practical power for most usages. In order to boost power, PV cells are arranged together into what is called a module and packaged into a form which is more usually known as a solar panel. Solar panels that grouped are later called solar arrays [5].
2.4.1 Structure of a Solar Cell
A typical solar cell is a multi-coated unit composed of:
i. Cover glass. A transparent glass or plastic layer that supports exterior safety from the elements.
ii. Anti-reflective Coating. This element is invented to avoid the light that reaches the cell from rebound so that the peak energy is absorbed into the cell.
iii. Front Contact. Conducts the electric current.
iv. N-Type Semiconductor Layer. A thin layer of silicon, mixed with phosphorous using a method called doping to produce a better conductor.
v. P-Type Semiconductor Layer. A thin layer of silicon mixed or doped with boron to produce a better conductor.
8
Figure 2.3: Typical Solar Cell Structure [5]
9
2.5 Crystalline Silicon (c-Si)
Nearly 90% of the PV modules manufacturers around the world now are established on some variation of silicon [4]. As mentioned in [4], about 95% of all consignments of U.S. producers in the residential zone were c-Si panels in 2011. The fundamental characteristic is the purity of the silicon [5]. Silicon purity is when the silicon molecules are coordinated to perfection. The perfect the arrangement, the prominent the cell intend to be at converting solar energy (from the sunlight) into electricity (the photoelectric effect). The efficiency of PV cells is associated with purity. Besides efficiency, cost and space-efficiency are reason in choosing the PV cells. Crystalline silicon forms the basis of mono- and polycrystalline silicon solar cells:
2.5.1 Monocrystalline Silicon Solar Cells
![Figure 2.3: Typical Solar Cell Structure [5]](https://thumb-us.123doks.com/thumbv2/123dok_us/137654.14798/23.595.84.529.79.311/figure-typical-solar-cell-structure.webp)
