Visualization of HIV T Cell Virological
Synapses and Virus-Containing
Compartments by Three-Dimensional
Correlative Light and Electron
Microscopy
Lili Wang,
aEdward T. Eng,
cKenneth Law,
aRonald E. Gordon,
bWilliam J. Rice,
cBenjamin K. Chen
aDivision of Infectious Disease, Department of Medicine, Immunology Institute, Icahn School of Medicine at
Mount Sinai, New York, New York, USAa; Department of Pathology, Icahn School of Medicine at Mount Sinai,
New York, New York, USAb; Simons Electron Microscopy Center, New York Structural Biology Center, New York,
New York, USAc
ABSTRACT
Virological synapses (VS) are adhesive structures that form between
in-fected and uninin-fected cells to enhance the spread of HIV-1. During T cell VS
forma-tion, viral proteins are actively recruited to the site of cell-cell contact where the
vi-ral material is efficiently translocated to target cells into heterogeneous,
protease-resistant, antibody-inaccessible compartments. Using correlative light and electron
microscopy (CLEM), we define the membrane topography of the virus-containing
compartments (VCC) where HIV is found following VS-mediated transfer. Focused ion
beam scanning electron microscopy (FIB-SEM) and serial sectioning transmission
electron microscopy (SS-TEM) were used to better resolve the fluorescent
Gag-containing structures within the VCC. We found that small punctate fluorescent
sig-nals correlated with single viral particles in enclosed vesicular compartments or
surface-localized virus particles and that large fluorescent signals correlated with
membranous Gag-containing structures with unknown pathological function. CLEM
imaging revealed distinct pools of newly deposited viral proteins within endocytic
and nonendocytic compartments in VS target T cells.
IMPORTANCE
This study directly correlates individual virus-associated objects
ob-served in light microscopy with ultrastructural features seen by electron microscopy
in the HIV-1 virological synapse. This approach elucidates which infection-associated
ultrastructural features represent bona fide HIV protein complexes. We define the
morphology of some HIV cell-to-cell transfer intermediates as true endocytic
com-partments and resolve unique synapse-associated viral structures created by transfer
across virological synapses.
KEYWORDS
Gag, HIV-1, T cells, correlative light and electron microscopy, endosome,
focused ion beam electron microscopy, transmission electron microscopy, virological
synapses, virus dissemination
H
uman immunodeficiency virus type 1 (HIV-1) infects CD4
⫹T helper cells and
causes a progressive depletion of these cells critical for organizing the immune
response. Recent studies indicate that cell-to-cell infection plays an important role in
HIV-1 pathogenesis (1–5). Accumulating evidence supports the idea that HIV-1
cell-to-cell spread contributes to both productive infection (6–9) and CD4
⫹T cell depletion
(10).
In vitro
studies indicate that HIV infection is enhanced by the formation of
adhesive contacts between immune cells called virological synapses (VS) (11, 12).
During VS formation HIV-1 Env protein is displayed on the surface of the infected cell
Received17 August 2016Accepted31 October 2016
Accepted manuscript posted online9 November 2016
CitationWang L, Eng ET, Law K, Gordon RE, Rice WJ, Chen BK. 2017. Visualization of HIV T cell virological synapses and virus-containing compartments by three-dimensional correlative light and electron microscopy. J Virol 91:e01605-16. https://doi.org/10.1128/ JVI.01605-16.
EditorWesley I. Sundquist, University of Utah
Copyright© 2017 American Society for Microbiology. All Rights Reserved.
Address correspondence to Benjamin K. Chen, [email protected].
crossm
on November 7, 2019 by guest
http://jvi.asm.org/
and can initiate cell-cell adhesions by binding to CD4 on the surface of the uninfected
T cell (8). After stable adhesion is established, the viral structural protein Gag is
subsequently recruited to the site of cell contact in an actin-dependent manner (7, 8,
13). Live imaging studies of VS formation have revealed that the recruitment of Gag
occurs after the formation of the Env-dependent, stable cell-cell adhesions (8).
Inter-nalization of viruses into the target cell through VS has been described as an endocytic
process (6, 14–17) although some studies indicate that the process of viral entry occurs
at the cell-cell junction (18). The extent to which endocytic pathways contribute to
infection by cell-free HIV-1 has also been a subject of much debate (19–21). Live
imaging of HIV-1 that expresses a fluorescently tagged structural protein, Gag, shows
that during cell-to-cell transmission, target cells acquire large quantities of viral antigen
into heterogeneous, punctate intracellular compartments (8). Treatment of cells with a
CXCR4 coreceptor binding antagonist, AMD-3100, does not block synapse formation or
transfer of HIV across the synapse but does increase the levels of Gag observed in target
cells (14). This increase in Gag in target cells may be driven by the enhanced stability
of transferred virus, increased endocytosis of virus, or both. The virus in this target cell
compartment resists trypsin digestion and requires cell permeabilization to be stained
with anti-Env antibodies, indicating that the virus resides in a protected compartment
(22). During VS-mediated infection, the maturation of virus particles has been proposed
to play a role in activating viral membrane fusion in the target cell (14). This model
suggests that the fusion process occurs only after the transferred virus particles have
matured to become infectious.
Using fluorescence microscopy of cells infected with fluorescent HIV, we have
visualized the formation of VS in live- or fixed-cell preparations to document the
trafficking of viral proteins during VS formation (8). However, membrane topology and
details of the viral structures and cellular compartments that contain the virus are
limited by the resolution of conventional light microscopy, which is about 300 to 400
nm. Electron microscopy can improve the resolution to 0.2 to 10 nm and enables one
to visualize electron-dense assemblies of the core structural protein, Gag, as well as the
membranous compartments that may support the internalization and entry of the
virus. Focused ion beam scanning electron microscopy (FIB-SEM) is a three-dimensional
(3D) electron microscopy method that in recent years has been applied to the study of
virological synapses (23–27). FIB-SEM provides nanometer-resolution images that can
define viral structures and the cellular membranes that may enclose them within
compartments. Electron microscopy studies of HIV-infected macrophages have
re-vealed that these cells can sequester virus particles in membranous conduits that are
contiguous with the plasma membrane (24). These compartments, when observed in
two dimensions (2D), initially were interpreted as enclosed cytoplasmic vesicles, but
with 3D imaging these were later found to be connected to the cell surface. FIB-SEM
studies examining cell-cell contacts between HIV-carrying dendritic cells and
unin-fected T cells revealed that dendritic cells can encase the T cells in membranous sheets
that create extensive areas of membrane contact between the two cells (28). Clusters
of HIV-infected and uninfected T cells have been examined with FIB-SEM but without
a clear demarcation of where viral assemblies are localized (25). A major challenge to
interpreting electron micrographs is correlating molecular structures with electron
density. Additionally, when HIV virological synapses are imaged by electron
micros-copy, it is difficult to distinguish cell contacts between infected and uninfected cells in
pelleted cells from bona fide virological synapses that have recruited viral proteins
concentrated at the cell-cell junction. To address these challenges, we have taken an
approach using 3D correlative light and electron microscopy (CLEM) to image relevant,
virus-related structures with greater accuracy. 3D CLEM allowed us to visualize
Gag-associated structures that were formed during HIV-1 cell-to-cell transfer between
infected and uninfected T cells. 3D FIB-SEM reconstructions of cells engaged in
viro-logical synapse enabled mapping of the boundaries of all membrane compartments
visualized. In addition, some compartments and viral structures were also resolved at
higher resolution using serial section transmission electron microscopy (SS-TEM).
on November 7, 2019 by guest
http://jvi.asm.org/
In this study, we provide electron microscopy evidence that, in contrast to
inter-nalized virus in macrophages, individual virus particles interinter-nalized through T cell-to-T
cell synapses are transferred into enclosed endocytic compartments. Membranous
structures larger than single virus particles also contribute to cell-to-cell transfer of
large amounts of viral antigen. These data provide an ultrastructural picture of the
major structures that are associated with HIV Gag during virological synapse-mediated
infection.
RESULTS
Two types of virus-containing compartments (VCC) are observed during HIV-1
T cell-to-T cell spread.
The transfer of HIV between infected and uninfected T cells
through virological synapses can be quantified and characterized morphologically
using molecular clones that express fluorescent Gag, HIV Gag-interdomain green
fluorescent protein (iGFP). However, the exact process by which the viral material is
transferred between cells remains unclear. To examine the Gag-associated structures
associated with VS-mediated transmission, we imaged primary CD4
⫹target cells that
harbor transferred viral material from Jurkat donor T cells expressing HIV Gag-iGFP by
laser scanning confocal microscopy (LSCM). Consistent with the findings of previous
studies (11), abundant fluorescent Gag-iGFP puncta from infected donor cells were
transferred to target cells after a 3-h coculture. We observed that heterogeneous
puncta were transferred to target cells. Treatment of cells with a CXCR4 coreceptor
binding antagonist (AMD-3100) resulted in the greater accumulation of fluorescent
puncta in VS target cells (Fig. 1A and C). This increase was observed with both small and
large puncta (Fig. 1D). The transferred viral materials showed minimal colocalization
Untreated AMD-3100
0 5 10 15 20A
v
e
ra
g
e
N
o
. of
punc
ta
/
t
a
rg
e
t c
e
ll
Untreated Gag-iGFP LAMP1 Untreated AMD-3100 Small Puncta p=0.0054 Large Puncta p<0.0001 p=0.0005A
B
C
D
Untreated
0 10 20 30 40 50N
o
. of
punc
ta
/
t
a
rg
e
t c
e
ll
AMD-3100
AMD-3100E
LAMP-1 intensity
AMD-3100 Untreated
Untreated
AMD-3100
50 100 1504%
7%
Gag-iGFP DAPI 0FIG 1Virus-containing compartments following HIV-1 cell-to-cell spread. Following a 3-h coculture of HIV Gag-iGFP-expressing Jurkat cells and primary CD4 cells, primary CD4 target cells positive for transferred Gag-iGFP were sorted by flow cytometry and imaged with confocal microscopy. (A) Confocalzprojection of target cells obtained from untreated cocultures or from AMD-3100 treated samples. Bar, 5m. (B) Confocalzprojection of target cells with or without AMD-3100 treatment stained with anti-LAMP-1, a marker for lysosomes. Bar, 5m. (C) The number of transferred puncta on target cells with or without AMD-3100 treatment. (D) The number of small or large puncta on target cells with or without AMD-3100 treatment. (E) Segmented Gag puncta within target cells were analyzed for staining of the lysosomal marker LAMP-1.
on November 7, 2019 by guest
http://jvi.asm.org/
[image:3.585.43.400.71.358.2]with the lysosomal marker LAMP-1, indicating that the viruses were not predominantly
being targeted for lysosomal degradation (Fig. 1B and E). In single-particle imaging
studies we have previously found that Gag puncta within VS target cells could undergo
proteolytic maturation and engage in viral membrane fusion (14). From the above data,
we infer that viral puncta that are heterogeneous in size are found in target cells and
can be enhanced in number when viral fusion is blocked.
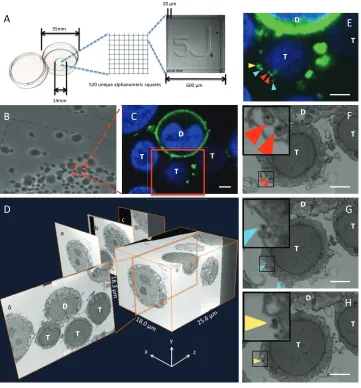
CLEM reveals structures associated with T cell virological synapses.
To examine
the structural organization of T cell-T cell interactions at virological synapses and the
nature of the virus-containing compartment, we imaged HIV-1 virological synapses
formed between Jurkat T cells expressing HIV-1 constructs carrying a fluorescently
tagged Gag (HIV-1 Gag-iGFP) and primary CD4 target T cells. A glass coverslip with a
grid-etched bottom facilitated unambiguous identification of cells engaged in VS and
of target cells carrying transferred viral material (Fig. 2A). A bright-field image localized
the cells on the alphanumeric grid (Fig. 2B), which provided a reference to identify an
infected cell engaged with three synapsed target cells (Fig. 2C). Transferred viral
material was detected as fluorescent Gag-iGFP puncta associated with the target cells.
The donor cell was larger in size and located in the center and showed prominent
localization of Gag at the plasma membrane (Fig. 2C). When cells were imaged by
FIB-SEM, budding figures on the donor cell correlated with the intense plasma
mem-brane fluorescence on this cell and were also observed at the cell-cell contact zones,
the virological synapse, where donor cell and target cell membranes were closely
apposed. We also observed transferred material in the target cell that was contained
within membrane compartments. A full-volume FIB-SEM image consisted of more than
1,200 continuous slices through the donor and conjugated target cells (Fig. 2D; see also
Video S1 in the supplemental material). Images parallel with the plane of the ion
abrasion (Fig. 2D, panels a, b, and c) were revisualized in the plane of the fluorescence
image (Fig. 2D, panel d).
In addition to large fluorescent puncta in the target cell (shown boxed in red in Fig.
2C), we observed many, diffraction-limited dots, consistent with the size of single virus
particles, and examined FIB-SEM sections for correlating structures. A selected series of
FIB-SEM slices was identified, and the volumes were scanned for small electron-dense
spots (Fig. 2E to H). Directionally stepping through the FIB-SEM volume, electron-dense
structures the size of single virus particles overlapped with corresponding fluorescent
puncta (shown in Fig. 2F, G, and H). A video of these continuous slices is presented in
Video S2. Meanwhile, large puncta (described further below) were predominantly
associated with membranous structures outside the cell.
Small fluorescent puncta are associated with electron-dense structures
indic-ative of single HIV-1 particles.
In previous live-imaging studies of virological synapses,
fast-moving Gag-containing clusters within the target cell have been documented (8,
14). These puncta moved at nearly 2
m/s away from the synaptic button (8). Given
that in other studies some viruses have been described as surfing on the surface of
susceptible target cells (29), it is important to determine whether puncta associated
with the target cell are enclosed within an intracellular endosome or located on the
outside of the cell or both. We examined the FIB-SEM images to define the boundaries
of the membrane compartments that were close to the plasma membrane.
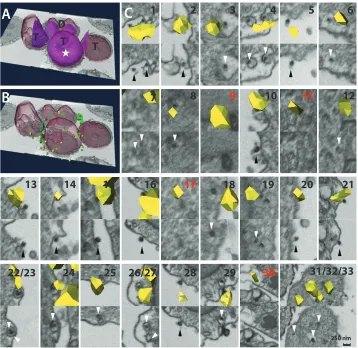
Registration of the light and electron microscopy images in two data sets allowed
us to correlate the presence of viral antigens in LSCM images with electron-dense
structures seen in FIB-SEM images. The two data sets from LSCM and FIB-SEM were
segmented separately to define 3D objects (Fig. 3A). Coregistered models of the 3D
objects of LSCM data and FIB-SEM data allowed us to correlate fluorescent signals with
nearby electron-dense structures. Larger, bright green patches were segmented into
large puncta and pseudocolored in green. Small, dim GFP puncta were pseudocolored
in yellow (Fig. 3B). Of the 33 small puncta associated with this target cell, 18 correlated
with particles in vesicles inside the cell, 11 correlated with particles attached to the
outer surface of the cell, and 4 were not obviously correlated with intracellular
on November 7, 2019 by guest
http://jvi.asm.org/
electron-dense structures (Fig. 3C and Table 1). The serial images surrounding each
correlated structure are highlighted in supplemental Video S3. Overall, the majority of
small puncta were found to localize with electron-dense structures with sizes similar to
the size of a single HIV-1 particle. Thirty-three percent of these virus particles were
attached to the outer surface of the plasma membrane, while 54.5% were fully enclosed
within endocytic compartments inside the target cell.
To examine how the inhibition of viral membrane fusion by the CXCR4 binding
antagonist AMD-3100 influences the distribution of viral material in the target cell, we
also imaged samples prepared in the absence of AMD-3100. Registration of the SEM
A
D
C
B
E
G
F
H
D
T
T
T
D
T
T
T
T D
D
D D
T T
T
T
T T T
FIG 2Experimental workflow used for CLEM of virological synapses. A coculture of fluorescent HIV Gag-iGFP-expressing Jurkat T cells and uninfected primary CD4 T cells was prepared for correlative imaging. A VS conjugate between an HIV-infected donor cell with several target cells was imaged by fluorescence microscopy and FIB-SEM. (A) A petri dish with an etched alphanumeric grid was used to localize cells for correlative studies. (B) Conjugates of infected and uninfected cells were identified by fluorescence and localized to the grid by bright-field imaging. (C) A laser scanning confocal image of an HIV Gag-iGFP-infected cell and target cells that contain Gag-iGFP-positive puncta is shown with its position on the grid indicated by the red box in panel B. (D) 3D volume representation of the FIB-SEM stacks of the cells imaged in panel C. The image dimensions were 18.0m by 18.3m by 25.6m. Representative transverse sections (subpanels a, b, and c) show three representative scanning surfaces from the sample. Thezaxis represents the scanning direction. Panel d shows an FIB-SEM plane that is parallel to the fluorescent scanning planes. (E) The fluorescence image of the area boxed in red in panel C with high contrast applied. The red, blue, and yellow arrows are fluorescent signals that correlate with electron-dense particles. The arrows demarcating fluorescent signals in the confocal image are identified on separate FIB-SEM planes using arrows of the same color to show correlated electron-dense structures in each plane. (F, G, and H) Individual scanning EM sections with single virus particles in thezdirection of the fluorescent photo shown in panel E. Bar, 2m. D, donor cell; T, target cell.
on November 7, 2019 by guest
http://jvi.asm.org/
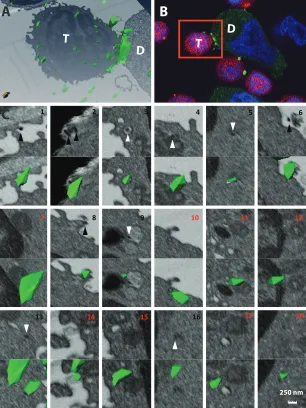
[image:5.585.43.404.76.464.2]data and the fluorescent data (Fig. 4A and B) revealed electron-dense structures for
many of the small puncta identified in the target cell (Fig. 4C). Of the 18 small puncta
associated with this target cell, 6 correlated with particles in vesicles inside the cell, 4
correlated with particles attached to the outer surface of the cell, and 8 were not
obviously correlated with intracellular electron-dense structures (Table 1). We observed
a lower frequency of correlation with electron-dense structures in the
AMD-3100-untreated sample than in the AMD-3100-treated sample. A fraction of the small puncta
9
10
11
12
17
18 19 20 21
A
B
C
250 nm
7
8
13 14 15 16
22/23 24 25
D
T
T
T
1
2
3
4
5
6
26/27
28
29
30
31/32/33
[image:6.585.42.400.70.418.2]FIG 3Correlation of FIB-SEM subcellular structures with LSCM fluorescent puncta in AMD-3100-treated cells. (A) Image registration was guided by alignment of bright GFP signals with prominent electron-dense structures. Landmark sets are placed correspondingly on segmented GFP signals of fluorescent data sets and segmented electron-dense structures of FIB-SEM data sets (not shown here); the center cell with strong GFP signals (marked by a white star) was chosen as the focus of alignment. Fluorescent nuclear surface, transparent red; FIB-SEM nuclear surface, solid purple. (B) The segmented fluorescent signals were classified as bright, high-volume signals and rendered in green and as small-volume, low-intensity puncta and rendered in yellow. (C) Small fluorescent puncta overlaid on FIB-SEM images reveal some correlated FIB-SEM structures. For a summary of results, see Table 1. Black-numbered photos show a correlated virus-like structure with a segmented fluorescent signal (yellow). In images labeled with a red number, no clear FIB-SEM structure was correlated with the fluorescent puncta. Virus-like structures inside the cell are marked with white arrowheads; virus-like structures outside the cell are marked with black arrowheads. The upper and lower panels of each photo show the intersection of fluorescent signal with the FIB-SEM slice with or without segmented yellow puncta. Bar, 250 nm. D, donor cell; T, target cell.
TABLE 1Summary of fluorescent signals in correlated samples
Sample type
No. of small puncta
Correlated with particles in vesicles inside cell
Correlated with particles outside the cell
Internal but not obviously
correlated with structures Total
Untreated 6 4 8 18
AMD-3100 treated 18 11 4 33
on November 7, 2019 by guest
http://jvi.asm.org/
[image:6.585.44.538.678.739.2](33%) were correlated with virus particles inside endosomes. These data support the
idea that endocytosis of single virus particles can be observed in both the presence and
absence of AMD-3100.
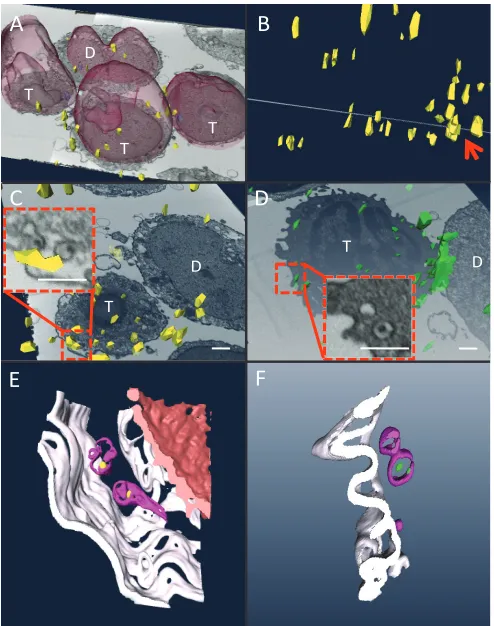
Using the segmentation and registration method described above, fluorescent
puncta that were correlated with virus-like particles could be identified by examining
the intersections of SEM slices with segmented yellow objects (Fig. 5A). Figure 2F and
3C, frame 4, show two views of the same FIB-SEM slice and reveal two virus-like
particles in separate vesicles in the cytoplasm. We next used the FIB-SEM image to mark
the boundaries of the cell membranes with respect to the virus-like particles in these
internal compartments. Fluorescent puncta (Fig. 5B) correlated with virus particle-like
1 2 3 4 5 6
7 8 9 10 11 12
13 14 15 16 17 18
A
C
D
B
250 nm
T
T
D
FIG 4Correlation of FIB-SEM subcellular structures with LSCM fluorescent puncta in a sample acquired in the absence of AMD-3100. (A) Registration of segmented Gag-iGFP signals from fluorescent data sets and FIB-SEM data sets. (B) The fluorescent image of an AMD-3100-untreated sample. The area boxed in red shows the same cells as those shown in panel A. (C) Small fluorescent puncta overlaid on an FIB-SEM image reveal some correlated FIB-SEM structures. For a summary of results, see Table 1. Black-numbered images show a putative correlated virus-like structure with a segmented fluorescent signal; images labeled with a red number show no clear FIB-SEM structure correlated with the fluorescent puncta. Virus-like structures inside the cell are marked with white arrowheads; virus-like structures outside the cell are marked with black arrowheads. The upper and lower panels of each photo show the intersection of fluorescent signal with the FIB-SEM slice with or without segmented puncta. Bar, 250 nm. D, donor cell; T, target cell.
on November 7, 2019 by guest
http://jvi.asm.org/
[image:7.585.53.359.74.482.2]structures (Fig. 5C) were further examined for their relationship with surrounding
cellular membranes. A 3D representation of these objects confirmed the internal
membrane-enclosed state of the virus-like particles within vesicles and indicated that
these do not communicate with the outside of the cell (Fig. 5E and Video S4). An
example of two endocytosed viruses from the AMD-3100-untreated sample (Fig. 5D)
and a 3D model of this sample are shown (Fig. 5F and Video S5). Of the two viruses
shown here, one is touching the membrane of an endosome and putatively appears to
be initiating fusion.
Serial section TEM improves resolution of transferred virus particles in target
cells.
CLEM imaging using FIB-SEM generates a continuous whole-cell correlative
model using light and electron microscopy data. However, because of the lower
resolution of SEM, the correlated electron-dense viral structures do not exhibit
well-defined classical virus morphology. We employed thin-section TEM imaging to obtain
higher resolution of these structures. Primary CD4
⫹target T cells carrying internalized
virus particles were flow sorted after acquisition of fluorescent virus from HIV
Gag-iGFP-expressing cells. Target cells were flow sorted and mounted onto a gridded cover
glass. Confocal imaging was used to identify a target cell and its cell-associated
A
B
C
D
D
T
T
T
T
T
D
D
2.0 µm
2.2 µm
0.9 µm
F
E
FIG 5Correlation of small fluorescent HIV Gag-containing puncta with electron-dense virus-like particles within enclosed membrane compartments. (A) FIB-SEM photo showing one donor cell, labeled D, and three target cells, labeled T. Reconstructed nuclei are shown in transparent red, and small GFP puncta are shown in segmented yellow. The target cell in the middle with segmented yellow signals is the same cell shown in Fig. 3. (B) 3D side view of an FIB-SEM section and segmented small GFP puncta. A red arrow indicates the plane of intersection of this FIB-SEM section with the 3D representation of the segmented puncta. (C) Front view of the section illustrated in panel B with location of the registered small GFP puncta. A red square marks the enlarged area magnified in the inset. Bar, 1m. (D) A section from the AMD-3100-untreated sample in shown in Fig. 4A. A red square marks the area magnified in the inset. Bar, 1m. (E) A volume around the intersection area as shown in panel C is segmented to highlight 3D membrane structures that contain virus-like particles. (F) A volume around the intersection area as shown in panel D is segmented to highlight 3D membrane structures that contain virus-like particles. For panels E and F, plasma membrane is shown in white, nuclear membrane is in red, intracellular vesicles are shown in magenta), and virus particles are shown in yellow (panel E) and green (panel F).
on November 7, 2019 by guest
http://jvi.asm.org/
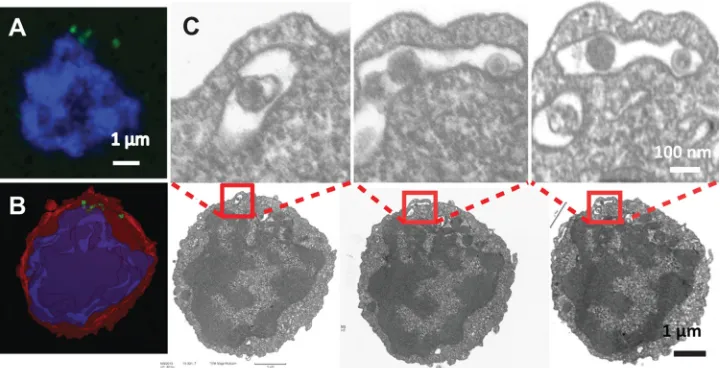
[image:8.585.83.330.71.384.2]Gag-iGFP puncta (Fig. 6A). Nine continuous 50-nm serial sections were segmented to
model the plasma membrane, nucleus, and transferred virus particles. The
segmenta-tion analysis revealed that some transferred virus particles were clearly within an
internal membrane compartment close to the plasma membrane (Fig. 6B and Video S6).
Sections through the virus particles revealed viral membranes and putative cores (Fig.
6C). The SS-TEM study yielded images showing a prototypical virus morphology that
correlated with fluorescent HIV-1 Gag-containing puncta.
Large fluorescent Gag puncta are associated with large, membranous
electron-dense structures.
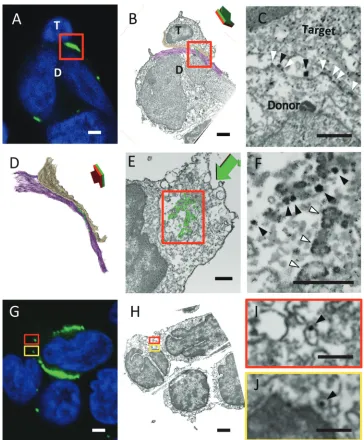
In the target cell analyzed for small puncta, shown in Fig. 3, we also
observed large puncta associated with the target cell (Fig. 7A). Compartments
associ-ated with larger fluorescent puncta on the target cells correlassoci-ated with electron-dense
membranous structures (Fig. 7B). These correlated electron-dense structures were
heterogeneous in size and generally much larger than single HIV-1 particles. HIV-1
cone-like dense cores were notably absent. These larger fluorescent structures
some-times appeared as supersized immature HIV-1 particles with an electron-dense Gag
lattice underneath the limiting membrane. These large prominent features could be
directly seen by TEM and were used to facilitate image registration (Fig. 7C and D). All
of the large puncta were found outside the boundaries of the target cell plasma
membrane. Similar large puncta were also observed in TEM studies with viruses
expressing wild-type Gag, indicating that these structures were not induced by the GFP
insertion into Gag in the HIV Gag-iGFP virus (Fig. 7I to K). Additionally, higher-resolution
TEM serial sections revealed that large puncta were closely associated with the target
cell membrane (Fig. 7E to H). Large membranous puncta were tightly attached to the
surface of the target cell, forming a membrane-enclosed patch or tube with an
amorphous shape, as shown in Fig. 7H. An electron-dense Gag lattice was visible
beneath the membrane contour of these large puncta.
HIV cell-to-cell transfer between primary CD4
ⴙT cells.
To assess whether the
structures observed using the Jurkat T cell line as HIV donor cells resemble those
observed when primary cells are used as both donors and target cells, we performed
correlative imaging on synapses formed between infected and uninfected primary
CD4
⫹T cells. When infected primary T cells are allowed to form VS, live fluorescent
imaging can capture both small and large puncta transferring from cell to cell (Video
S7). We acquired FIB-SEM images from two independent primary cell VS generated
FIG 6TEM serial sections reveal that small puncta transferred to target cells represent individual HIV-1 particles. (A) Fluorescence image of the selected target cell with transferred GFP signals. Blue, nucleus. (B) 3D model of the same target cell with small puncta, as determined from TEM serial sections. Green, virus particles; red, plasma membrane; blue, nucleus. (C) Three serial TEM sections of the target cell corresponding to the fluorescence image plane illustrated in panel A. Red squares indicate the area enlarged in the upper panel showing intracellular vesicles with virus particles.on November 7, 2019 by guest
http://jvi.asm.org/
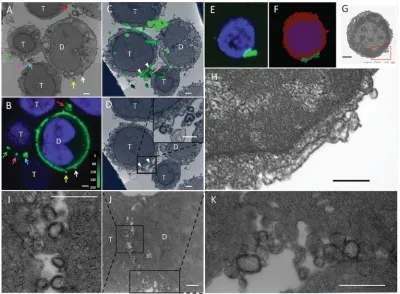
[image:9.585.42.402.74.258.2]from two independent donor T cell sources. CLEM images of a VS between primary T
cells showed a close apposition of membranes and nascent viral buds at the cell-cell
interface. The VS donor cell plasma membrane exhibited a high concentration of
budding crescent forms (Fig. 8A to D). Free virus particles and large membranous
Gag-containing structures were also observed in the interface between the donor and
target cells (Fig. 8C and F). Examination of the cell-cell interface at the center of the VS
revealed a concentration of virus-like particles surrounded by tightly apposed donor
and target cell membranes (Fig. 8E and F). In another primary-to-primary T cell VS
example, one donor cell formed synapses with three target cells, and virus particles
were found within target cell endosomes (Fig. 8G to J).
DISCUSSION
HIV-1 virological synapses between T cells can direct the translocation of large
amounts of viral antigen from donor to target cell in a process that facilitates infection
(11). In live-imaging studies, fluorescent particles, from diffraction-limited spots to large
micrometer-sized aggregates, have been observed to move from cell to cell (8). Here,
we characterized the states of Gag transferred into virological synapse-engaged
pri-mary T cells. Previous 3D electron microscopy studies of virological synapses have
examined infected cells and their cell-cell contacts (18, 25, 30). Here, we employed
CLEM methods to explore HIV-1 cell-to-cell spread through virological synapses
corre-FIG 7Large puncta transferred to target cells correlate with electron-dense membranous structures that are larger than viral particles. (A) FIB-SEM photo showing one donor cell (large cell marked with D) and three conjugated target cells (smaller cells marked with T). (B) Fluorescent image of the same cells as shown in panel A. Colored arrows highlight large fluorescent puncta (panel B) and corresponding membranous structures (panel A). (C) Scanning EM section overlaid with a 3D view of segmented large fluorescent GFP puncta. The cells are the same as in those in panels A and B but shown at a tilted angle. White triangles show the intersection of reconstituted large puncta and the scanning EM section. (D) The same FIB-SEM view as that of panel C but without the 3D view of the Gag puncta. Membranous structures at the intersection are highlighted with white arrowheads. (E) Fluorescent image showing one sorted target cell with transferred large GFP puncta (green) and the nucleus, indicated with DAPI stain (blue). (F) 3D model of a target cell with large puncta based on TEM serial sections. Green, virus particles; red, plasma membrane; blue, nucleus. (G) A TEM slice corresponding to images in panels E and F. (H) Enlargement of the area boxed in red in panel G. (I to K) TEM photos from a wild-type NL4-3 sample with large membranous structures between a donor cell (marked with D) and a target cell (marked with T). Bar, 1m.
on November 7, 2019 by guest
http://jvi.asm.org/
[image:10.585.40.440.71.365.2]lating fluorescent viral antigens with electron-dense structures. Localization of
fluores-cent protein-tagged HIV Gag identified bona fide donor cell-target cell conjugates and
characterized the various structural forms of Gag that are transferred from cell to cell.
From our previous live-imaging studies, a model was proposed for VS-mediated
infection in which the virion maturation process occurred within target cell-associated
FIG 8CLEM shows the structure of a primary T cell-to-primary T cell virological synapse. Confocal fluorescence image (A) and FIB-SEM slice (B) show a VS formed between an activated primary CD4⫹T cell (marked with D) andtarget primary CD4⫹T cell (marked with T). Areas boxed in red highlight the VS interface. The plasma membranes associated with VS were segmented and are displayed in pink (donor side) and bronze (target side). The electron-dense structures associated with Gag lattice were segmented and are displayed in green. (C) Enlarged SEM view of the red-boxed area in panel B shows budding viral crescents (white arrowheads) and virus particles (black arrowheads). (D) A 3D model of the primary T cell-to-primary T cell VS from the segmented FIB SEM images. The arrow indicates the orientation of the model. (E) A view of the VS area from the target cell side is depicted. The arrow shows the orientation of the viewing angle. Green indicates the segmented, Gag-related structures at the VS just above this specific FIB-SEM slice. (F) The enlarged view of the area boxed in red in panel E, which includes most of the segmented green structure. Black arrowheads indicate virus particles, and white arrowheads indicate large puncta with budding, crescent-shaped forms. A confocal fluorescence image (G) and FIB-SEM slice (H) show endocytosed viruses transferred from an activated primary CD4⫹T cell (donor) and a target primary CD4⫹T cell (target). (I and J) Enlarged view of the areas boxed in yellow and red in panels G and H, respectively. Black arrowheads indicate virus particles. Bar, 1m.
on November 7, 2019 by guest
http://jvi.asm.org/
[image:11.585.39.403.69.509.2]compartments (14). Trypsin-resistant compartments in T cells were previously reported
to contain Gag, Env, and Vpr and can be stained with anti-Env antibodies only when
cells are first permeabilized (11, 22). In our current study, similarly small, dimly
fluores-cent puncta within the target cell were found in several different states. Some viruses
were found within internal, enclosed membrane structures, which we presume were
endosomes. These observations indicate that some viruses are contained within
endo-somes; however, it remains uncertain which viral intermediates contribute most to
productive infection. These correlated electron-dense SEM structures were found to
have a diameter close to the diameters of HIV particles, which are distinct in
morphol-ogy from multivesicular bodies (MVB). In previous noncorrelated TEM photos of
viro-logical synapses, MVB with virus particle-like inclusions were observed (8); however, in
this study fluorescent Gag puncta were not found to localize to MVB structures.
In these correlative studies, we also observed large fluorescent puncta that
associ-ated with membranous electron-dense structures. In previous live-imaging studies,
large patches of fluorescent Gag have been observed to transfer from donor to target
cell across the VS (8). These electron-dense structures represent an extensive lattice of
Gag bound to membrane and are much larger than individual virus particles. While
these structures could be associated with the high levels of HIV expression when Jurkat
cells are used as donor cells, we do not believe that they are dependent upon the
GFP-tagged Gag as similar structures were observed using wild-type HIV that did not
carry the GFP fusion protein (Fig. 7I to K). These membranes are intimately attached to
the target cell and associated tightly enough to survive trypsinization and cell sorting
(Fig. 7E to H). These large membranous structures were also observed in primary T
cell-to-primary T cell cocultures (Fig. 8; see also Video S7 in the supplemental material).
Trogocytosis or cell-to-cell membrane transfer has been observed in immunological
synapses where T cells can capture membrane fragments from antigen-presenting cells
(31, 32). Considering the similarity between virological synapses and immunological
synapses, it is possible that the large membranous puncta in VS target cells are related
to trogocytosis. Whether these structures are present during natural HIV-1 cell-to-cell
transfer or what role they may play in HIV-1 cell-to-cell transmission will require further
exploration. It is possible that the membranous Gag-containing structures contain all
the viral materials required to form infectious viral particles. It is unknown whether
viruses could be formed from these structures and participate in infection. Furthermore,
additional studies are needed to understand how these structures may affect T cell
survival.
In our FIB-SEM studies we examined all the small puncta transferred to target cells,
recording their localization and noting correlated structures (Table 2). In addition to
obvious electron-dense structures described above, a minority of small fluorescent
puncta did not correlate with any highly electron dense structures. These small puncta
may represent Gag-containing structures in different states of viral entry that are not
well resolved from their surroundings. They could also represent endocytosed virus
particles that are destined for degradation (33). However, in our coculture system,
transferred puncta were not colocalized with the late endosome/lysosomal marker
LAMP-1, which indicates that most of the transferred viral material is not targeted to
lysosomes. This lack of localization with lysosomes is consistent with findings of
previous studies (6, 16).
[image:12.585.39.369.82.156.2]Whether endocytic pathways contribute to HIV productive infection has been
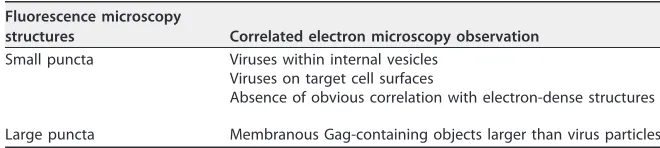
TABLE 2Classification of correlated structuresFluorescence microscopy
structures Correlated electron microscopy observation
Small puncta Viruses within internal vesicles Viruses on target cell surfaces
Absence of obvious correlation with electron-dense structures Large puncta Membranous Gag-containing objects larger than virus particles
on November 7, 2019 by guest
http://jvi.asm.org/
actively debated (19–21). During infection with cell-free HIV-1, entry has been reported
to occur without the requirement of endocytosis (19). However, during HIV-1 cell-to-cell
transmission, virus assembly and egress are highly concentrated at the VS, and
live-imaging studies show large and small puncta transferring into cellular compartments
within the target cell (8). When this observation is considered in conjunction with our
previous virus particle imaging studies where we have imaged fusion of individual virus
particles in VS target cells (14), we suggest that a fraction of these small puncta may
represent virus entering through internal endosomal compartments. It remains to be
rigorously determined whether the particles that fuse in the target cells are those that
are contained within the endosomes.
In addition to endocytosed viruses, some of the particles visualized by LSCM and
FIB-SEM were also present at the target cell surface. We also note as a possible
limitation of our fluorescence imaging that dimly fluorescent virus particles that fuse
close to the site of cell-cell contact may be obscured by the intense fluorescence of the
donor cell. Based on the observations above, it is still challenging to define exactly
which puncta progress to productive infection. However, our studies do provide the
first CLEM images that verify that transferred viruses are internalized into enclosed
internal compartments during the VS.
A 3D model of an FIB/SEM data set highlights two types of transferred HIV antigens
revealed in this study (Fig. 9). Large membranous and small virus-particle-sized puncta
are displayed. The use of CLEM unambiguously defines a number of virus-associated
structures formed in VS donor and target cells. Knowledge of these structures will help
us to develop and test models of viral transfer and infection during HIV-1 dissemination.
MATERIALS AND METHODS
Viral constructs, cells, and tissue culture.HIV-1 Gag-iGFP is a molecular clone based on pNL4-3 (34) that carries green fluorescent protein (GFP) inserted between the Gag MA and CA domains (22). The CD4 T-cell line Jurkat E6.1 (ATCC) was maintained in RPMI 1640 medium with 100 U/ml penicillin and 100 mg/ml streptomycin plus 10% fetal bovine serum (FBS). Cells were maintained at concentrations of less than 1⫻106cells/ml. Primary CD4 T cells were obtained from human peripheral blood buffy coats from deidentified blood donors through the New York Blood Center. CD4 T cells were isolated by negative selection with a Miltenyi CD4 T Cell Isolation Kit II (Miltenyi Biotec). Unactivated CD4 T cells were maintained in complete RPMI medium containing 50 U/ml interleukin-2 (IL-2) (AIDS Reagent Program [ARP]).
Coculture of HIV-1-infected T cells with uninfected T cells. HIV-1 proviral constructs were transduced into Jurkat cells using Amaxa nucleofection (Amaxa Biosystems) as previously described to generate HIV-expressing donor cells (11). Briefly, 5g of endotoxin-free HIV-1 proviral plasmids was
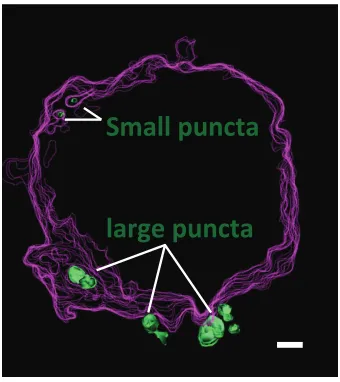
Small puncta
large puncta
FIG 9Model of a VS target cell containing both large and small puncta. Outlines of the plasma membrane (magenta) and internal membrane (green) compartments illustrate internal and external Gag-associated structures. A stack of 50 continuous FIB-SEM slices was used to create a 3D model using 3dmod software. Bar, 0.5m.
on November 7, 2019 by guest
http://jvi.asm.org/
[image:13.585.121.291.71.262.2]nucleofected into 6⫻106Jurkat cells using a Cell Line Nucleofector Kit V, program S-18. Twenty-four hours after nucleofection, viable Jurkat cells were purified by centrifugation on a Ficoll-Paque density gradient. Then the cells were washed with complete medium and placed at 37°C for coculture. For primary CD4⫹donor cells, freshly separated primary CD4⫹T cells were activated with
phytohemagglu-tinin (PHA) and IL-2 in the presence of feeder peripheral blood mononuclear cells (PBMC). Activated primary CD4⫹T cells were spinoculated with cell-free HIV-1 particles produced by 293T cells. Three days
after infection, live primary CD4⫹T cells were isolated by centrifugation through a Ficoll gradient and
washed before use as donor cells. Target cells were unactivated primary CD4 T cells thawed from a frozen state and resuspended in complete RPMI 1640 medium containing 50 U/ml IL-2. Donor and target cells were mixed at a 1:1 ratio and cocultured at 37°C for 3 h before transfer to coverslips for confocal imaging and FIB-SEM sample preparation. To examine the internal VCC in target cells, cells were treated with trypsin, fixed, and sorted with an Aria fluorescence-activated cell sorter (FACS). For Jurkat-to-primary CD4⫹cell HIV transfer studies, both untreated samples or samples treated with AMD-3100 (CXCR4
coreceptor binding antagonist) were prepared. Where inhibitors were used, donor and target cells were preincubated separately with equal volumes of inhibitors for 30 min at 37°C before mixing.
Fluorescence microscopy sample preparation.Transfected Jurkat cells (donor cells) were mixed with primary CD4 cells (target cells) in round-bottom 96-well-plates for 3 to 4 h as previously described (11). Cocultured donor and target cells were transferred onto polylysine-treated, gridded, glass-bottom dishes (P35G-2-14-C-GRID or P35G-2-14-CGRD; MatTek Corp., Ashland, MA). These dishes have a number 2 coverslip etched with an alphanumeric grid to enable cell relocation by light and electron microscopy (Fig. 2). Cells were allowed to adhere to the coverslip for 30 min at 37°C and were fixed with 4% paraformaldehyde (PFA) for at least 10 min at room temperature. For fluorescence imaging, cells were mounted with antifade mounting medium with 4=,6=-diamidino-2-phenylindole (DAPI) (catalog number H-1200; Vector Laboratories). To immunostain sorted target cells, cells were fixed in 2% PFA and resuspended in primary antibody solution (phosphate-buffered saline [PBS] with 5% fetal bovine serum [FBS], 0.02% NaN3, and 0.5% saponin [Sigma] with primary antibody [LAMP1 rabbit MAb9091; Cell Signaling Technology] at 1:200). The cells were incubated at room temperature for 1 h and washed. The cells were resuspended in corresponding secondary antibody (Alexa Fluor 546; Invitrogen) for 30 min and washed. Prolong Gold antifade reagent (Invitrogen) was used to seal the slides.
LSCM imaging.When cells were prepared for correlative imaging, they were maintained in non-hardening mounting medium H-1200. An inverted Leica SP5 DMI laser scanning confocal microscope (LSCM) was used to find cells of interest using a 40⫻objective. Bright-field and GFP single-plane images were acquired using a 10⫻objective to localize cells upon the alphanumeric grid (Fig. 2B). After the locations of the cells of interest relative to the grid were documented, both DAPI and GFP LSCMz-stack images were taken using a 63⫻objective (1.4 numerical aperture [NA]; oil). These 63⫻DAPI and GFP images were taken in 1,024- by 1,024-pixel mode and were scanned at a speed of 200 Hz with 4 times line averaging with 30 to 50z-steps. For normal slides, the images were taken directly using a 63⫻ objective with the same settings.
Electron microscopy sample preparation.After LSCM imaging, the approximate locations of the cells of interest relative to the grid were marked on the gridded-bottom glass using a marking pen. H-1200 mounting medium was washed with PBS, and the cells were fixed again with 3% glutaraldehyde in 0.1 M cacodylate buffer for 30 min. The buffer was changed to 1% tannic acid in 0.1 M cacodylate buffer for 1 h at room temperature and then to 1% osmium for 1 h and sealed, and the sample was placed at 4°C. The cells were dehydrated in increasing concentrations of ethanol (30%, 50%, and 70%), kept in 3% uranyl acetate and 70% ethanol for 12 h at 4°C, washed in 70% ethanol, and further dehydrated with increasing concentrations of ethanol (90%, 95%, and 100% twice). After dehydration, cells were infiltrated with sequential 3:1, 1:1, and 1:3 solutions of resin (Embed 812 kit; Electron Microscopy Sciences, Hatfield, PA) and 100% ethanol for 1 h separately at room temperature with the dishes sealed. A final infiltration of pure resin was carried out three times, with the dishes sealed at room temperature, and incubated for 1 h. Prior to solidification, a 1-cm-diameter open-ended embedding capsule (Electron Microscopy Sciences, Hatfield, PA) was filled with pure resin and used to encapsulate the cells. The resin was then polymerized in a vacuum oven at 65°C for 8 to 12 h to generate a block with grid marks imprinted on the capsule face. To detach the coverslip from the cell block, the polymerized sample was immersed in liquid nitrogen for 1 min, and the glass was removed from the block.
To examine the VCC by transmission electron microscopy, we enriched for target cells by flow sorting target cells that had become stably associated HIV Gag-iGFP. Sorted target cells were pelleted and embedded in epon, and the block was coarsely trimmed with a double-edged razor blade and further trimmed on an ultramicrotome (Leica Ultracut UCT) with a diamond trimming knife (DiATOME Ultra 45) to finely trim the block around the cell of interest. Serial ultrathin sections (50 nm) were cut from the block surface using an ultramicrotome. The serial sections coming off the block face were collected and transferred to a 2- by 0.5-mm carbon-reinforced single slot grid (G205-Cu; Electron Microscopy Sciences, Hatfield, PA). The sample was dried on the grid and transferred to staining mats for heavy metal staining. Grids were stained with 3% uranyl acetate for 40 min, washed, stained with lead citrate for 3 min, and washed and allowed to dry.
In preparation for FIB-SEM, specimens were mounted on stubs with double-sided, electrically conductive carbon tape. Silver paint (colloidal silver liquid; Electron Microscopy Sciences, Hatfield, PA) was applied to ensure electrical continuity of the specimen with the stub. The samples with the stub were put in a 60°C dryer to remove the solvent. The samples were coated with gold-palladium by a sputter coater (Denton Vacuum Desk V) in preparation for scanning electron microscopy (Helios NanoLab 650 DualBeam; FEI).
on November 7, 2019 by guest
http://jvi.asm.org/
Transmission electron microscopy. Cells were viewed at low magnification and low beam to identify the cell of interest based on the comparison of the cell morphology under the EM with the confocal GFP image. Serial sections of cells and organelles of interest were then imaged at magnifications of⫻10 to⫻30,000.
Focused ion beam scanning electron microscopy (FIB-SEM).The sample was imaged using the back-scattered electron (BSE) mode in an FEI Helios NanoLab 650 DualBeam SEM. Images were recorded after each round of ion beam milling using the SEM beam at 2 keV and 200 pA with a working distance of 4 mm. Automated data acquisition was guided by the Auto Slice and View G3 software, with an averagex-ypixel size of 2 to 3 nm andz-step size of 20 nm.
Processing of fluorescence and electron microscopy image stacks.For correlative analysis, raw FIB-SEM images were cropped and aligned using the image-processing programs in IMOD (UC Boulder). In particular, the stack of FIB-SEM images was aligned using IMOD’s xfalign and Midas programs. Images were denoised using a median filter and binned to produce isotropic voxels in thexandydirections with Amira software (Visage Imaging, Andover, MA). Further image analysis utilized ImageJ (NIH) to rescale 2D image stacks to a smaller size. For fluorescent stacks, features of interest were automatically selected with Amira using a thresholding tool. Corresponding features of interest on 2D electron microscopy stacks were selected by semiautomatic segmentation and refined manually using Amira to produce 3D visualizations and volume rendering. For 3D object registration, we transformed two 3D objects into one another by first setting landmarks on their surfaces and then defining a mapping between the landmark sets (35). Registration was realized by Amira’s landmark surface warp program. We placed landmarks on prominent, high-intensity Gag-iGFP fluorescent signals and structures with an electron-dense layer indicative of Gag-iGFP and executed a rigid landmark surface warp. Nuclei were aligned using the same warping method.
For normal slides, fluorescent image stacks were loaded to the image analysis software Imaris. Automated image segmentation based on GFP intensity was performed. Cell counting and numbering were processed by Fiji. The threshold to discriminate between large and small puncta was set at 0.4m3. The number of puncta associated with each cell was counted manually based on segmentation results. The intensity data of segmented Gag puncta in the red channel were exported and plotted for colocalization analysis.
SUPPLEMENTAL MATERIAL
Supplemental material for this article may be found at https://doi.org/10.1128/
JVI.01605-16.
TEXT S1, PDF file, 0.01 MB.
VIDEO S1, MOV file, 6.1 MB.
VIDEO S2, MOV file, 3.4 MB.
VIDEO S3, MOV file, 3.2 MB.
VIDEO S4, MOV file, 6.6 MB.
VIDEO S5, MOV file, 1.2 MB.
VIDEO S6, MOV file, 4.7 MB.
VIDEO S7, MOV file, 2.1 MB.
ACKNOWLEDGMENTS
TEM was performed at the Icahn School of Medicine at Mount Sinai (ISMMS)-Core
Pathology Electron Microscopy Facility. We thank Juan Jimenez and Lauren Pershon for
TEM sample serial sectioning. Confocal microscopy was performed at the
ISMMS-Microscopy Shared Resource Facility. We thank Rumana Huq and Lauren O’Rourke for
advice and support with confocal imaging.
This study was supported by a grant to B.K.C. from the NIH/NIGMS (GM113885). The
funders had no role in study design, data collection and interpretation, or the decision
to submit the work for publication.
REFERENCES
1. Law KM, Komarova NL, Yewdall AW, Lee RK, Herrera OL, Wodarz D, Chen BK. 2016. In vivo HIV-1 cell-to-cell transmission promotes multicopy micro-compartmentalized Infection. Cell Rep 15:2771–2783. https:// doi.org/10.1016/j.celrep.2016.05.059.
2. Murooka TT, Deruaz M, Marangoni F, Vrbanac VD, Seung E, von Andrian UH, Tager AM, Luster AD, Mempel TR. 2012. HIV-infected T cells are migratory vehicles for viral dissemination. Nature 490:283–287. https:// doi.org/10.1038/nature11398.
3. Sewald X, Ladinsky MS, Uchil PD, Beloor J, Pi R, Herrmann C, Motamedi N, Murooka TT, Brehm MA, Greiner DL, Shultz LD, Mempel TR, Bjorkman PJ, Kumar P, Mothes W. 2015. Retroviruses use CD169-mediated trans-infection of permissive lymphocytes to establish trans-infection. Science 350: 563–567. https://doi.org/10.1126/science.aab2749.
4. Agosto LM, Uchil PD, Mothes W. 2015. HIV cell-to-cell transmission: effects on pathogenesis and antiretroviral therapy. Trends Microbiol 23:289 –295. https://doi.org/10.1016/j.tim.2015.02.003.
5. Alvarez RA, Barria MI, Chen BK. 2014. Unique features of HIV-1 spread through T cell virological synapses. PLoS Pathog 10:e1004513. https:// doi.org/10.1371/journal.ppat.1004513.
6. Sloan RD, Kuhl BD, Mesplede T, Munch J, Donahue DA, Wainberg MA. 2013. Productive entry of HIV-1 during cell-to-cell transmission via dynamin-dependent endocytosis. J Virol 87:8110 – 8123. https://doi.org/ 10.1128/JVI.00815-13.
7. Jolly C, Kashefi K, Hollinshead M, Sattentau QJ. 2004. HIV-1 cell to cell transfer across an Env-induced, actin-dependent synapse. J Exp Med 199:283–293. https://doi.org/10.1084/jem.20030648.
on November 7, 2019 by guest
http://jvi.asm.org/
8. Hubner W, McNerney GP, Chen P, Dale BM, Gordon RE, Chuang FY, Li XD, Asmuth DM, Huser T, Chen BK. 2009. Quantitative 3D video microscopy of HIV transfer across T cell virological synapses. Science 323:1743–1747. https://doi.org/10.1126/science.1167525.
9. Sourisseau M, Sol-Foulon N, Porrot F, Blanchet F, Schwartz O. 2007. Inefficient human immunodeficiency virus replication in mobile lympho-cytes. J Virol 81:1000 –1012. https://doi.org/10.1128/JVI.01629-06. 10. Galloway NL, Doitsh G, Monroe KM, Yang Z, Munoz-Arias I, Levy DN,
Greene WC. 2015. Cell-to-cell transmission of HIV-1 is required to trigger pyroptotic death of lymphoid tissue-derived CD4 T cells. Cell Rep 12: 1555–1563. https://doi.org/10.1016/j.celrep.2015.08.011.
11. Chen P, Hubner W, Spinelli MA, Chen BK. 2007. Predominant mode of human immunodeficiency virus transfer between T cells is mediated by sustained Env-dependent neutralization-resistant virological synapses. J Virol 81:12582–12595. https://doi.org/10.1128/JVI.00381-07.
12. Sherer NM, Lehmann MJ, Jimenez-Soto LF, Horensavitz C, Pypaert M, Mothes W. 2007. Retroviruses can establish filopodial bridges for effi-cient cell-to-cell transmission. Nat Cell Biol 9:310 –315. https://doi.org/ 10.1038/ncb1544.
13. Jolly C, Mitar I, Sattentau QJ. 2007. Requirement for an intact T-cell actin and tubulin cytoskeleton for efficient assembly and spread of human immunodeficiency virus type 1. J Virol 81:5547–5560. https://doi.org/ 10.1128/JVI.01469-06.
14. Dale BM, McNerney GP, Thompson DL, Hubner W, de Los Reyes K, Chuang FY, Huser T, Chen BK. 2011. Cell-to-cell transfer of HIV-1 via virological synapses leads to endosomal virion maturation that activates viral membrane fusion. Cell Host Microbe 10:551–562. https://doi.org/ 10.1016/j.chom.2011.10.015.
15. Blanco J, Bosch B, Fernandez-Figueras MT, Barretina J, Clotet B, Este JA. 2004. High level of coreceptor-independent HIV transfer induced by contacts between primary CD4 T cells. J Biol Chem 279:51305–51314. https://doi.org/10.1074/jbc.M408547200.
16. Bosch B, Grigorov B, Senserrich J, Clotet B, Darlix JL, Muriaux D, Este JA. 2008. A clathrin-dynamin-dependent endocytic pathway for the uptake of HIV-1 by direct T cell-T cell transmission. Antiviral Res 80:185–193. https://doi.org/10.1016/j.antiviral.2008.06.004.
17. Daecke J, Fackler OT, Dittmar MT, Krausslich HG. 2005. Involvement of clathrin-mediated endocytosis in human immunodeficiency virus type 1 entry. J Virol 79:1581–1594. https://doi.org/10.1128/JVI.79.3.1581 -1594.2005.
18. Martin N, Welsch S, Jolly C, Briggs JA, Vaux D, Sattentau QJ. 2010. Virological synapse-mediated spread of human immunodeficiency virus type 1 between T cells is sensitive to entry inhibition. J Virol 84: 3516 –3527. https://doi.org/10.1128/JVI.02651-09.
19. Herold N, Anders-Osswein M, Glass B, Eckhardt M, Muller B, Krausslich HG. 2014. HIV-1 entry in SupT1-R5, CEM-ss, and primary CD4⫹T cells
occurs at the plasma membrane and does not require endocytosis. J Virol 88:13956 –13970. https://doi.org/10.1128/JVI.01543-14.
20. Herold N, Muller B, Krausslich HG. 2015. Reply to “Can HIV-1 entry sites be deduced by comparing bulk endocytosis to functional readouts for viral fusion?” J Virol 89:2986 –2987. https://doi.org/10.1128/JVI.03376-14. 21. Marin M, Melikyan GB. 2015. Can HIV-1 entry sites be deduced by comparing bulk endocytosis to functional readouts for viral fusion? J Virol 89:2985. https://doi.org/10.1128/JVI.03352-14.
22. Hubner W, Chen P, Del Portillo A, Liu Y, Gordon RE, Chen BK. 2007. Sequence of human immunodeficiency virus type 1 (HIV-1) Gag local-ization and oligomerlocal-ization monitored with live confocal imaging of a replication-competent, fluorescently tagged HIV-1. J Virol 81: 12596 –12607. https://doi.org/10.1128/JVI.01088-07.
23. Drobne D. 2013. 3D imaging of cells and tissues by focused ion beam/ scanning electron microscopy (FIB/SEM). Methods Mol Biol 950:275–292. https://doi.org/10.1007/978-1-62703-137-0_16.
24. Bennett AE, Narayan K, Shi D, Hartnell LM, Gousset K, He H, Lowekamp BC, Yoo TS, Bliss D, Freed EO, Subramaniam S. 2009. Ion-abrasion scanning electron microscopy reveals surface-connected tubular con-duits in HIV-infected macrophages. PLoS Pathog 5:e1000591. https:// doi.org/10.1371/journal.ppat.1000591.
25. Do T, Murphy G, Earl LA, Del Prete GQ, Grandinetti G, Li GH, Estes JD, Rao P, Trubey CM, Thomas J, Spector J, Bliss D, Nath A, Lifson JD, Subrama-niam S. 2014. Three-dimensional imaging of HIV-1 virological synapses reveals membrane architectures involved in virus transmission. J Virol 88:10327–10339. https://doi.org/10.1128/JVI.00788-14.
26. Heymann JA, Shi D, Kim S, Bliss D, Milne JL, Subramaniam S. 2009. 3D imaging of mammalian cells with ion-abrasion scanning electron mi-croscopy. J Struct Biol 166:1–7. https://doi.org/10.1016/j.jsb.2008.11.005. 27. Murphy GE, Narayan K, Lowekamp BC, Hartnell LM, Heymann JA, Fu J, Subramaniam S. 2011. Correlative 3D imaging of whole mammalian cells with light and electron microscopy. J Struct Biol 176:268 –278. https:// doi.org/10.1016/j.jsb.2011.08.013.
28. Felts RL, Narayan K, Estes JD, Shi D, Trubey CM, Fu J, Hartnell LM, Ruthel GT, Schneider DK, Nagashima K, Bess JW, Jr, Bavari S, Lowekamp BC, Bliss D, Lifson JD, Subramaniam S. 2010. 3D visualization of HIV transfer at the virological synapse between dendritic cells and T cells. Proc Natl Acad Sci U S A 107:13336 –13341. https://doi.org/10.1073/pnas.1003040107. 29. Lehmann MJ, Sherer NM, Marks CB, Pypaert M, Mothes W. 2005.
Actin-and myosin-driven movement of viruses along filopodia precedes their entry into cells. J Cell Biol 170:317–325. https://doi.org/10.1083/ jcb.200503059.
30. Jolly C, Welsch S, Michor S, Sattentau QJ. 2011. The regulated secretory pathway in CD4⫹T cells contributes to human immunodeficiency virus
type-1 cell-to-cell spread at the virological synapse. PLoS Pathog 7:e1002226. https://doi.org/10.1371/journal.ppat.1002226.
31. Huang JF, Yang Y, Sepulveda H, Shi W, Hwang I, Peterson PA, Jackson MR, Sprent J, Cai Z. 1999. TCR-mediated internalization of peptide-MHC complexes acquired by T cells. Science 286:952–954. https://doi.org/ 10.1126/science.286.5441.952.
32. Joly E, Hudrisier D. 2003. What is trogocytosis and what is its purpose? Nat Immunol 4:815. https://doi.org/10.1038/ni0903-815.
33. Grewe C, Beck A, Gelderblom HR. 1990. HIV: early virus-cell interactions. J Acquir Immune Defic Syndr 3:965–974.
34. Adachi A, Gendelman HE, Koenig S, Folks T, Willey R, Rabson A, Martin MA. 1986. Production of acquired immunodeficiency syndrome-associated retrovirus in human and nonhuman cells transfected with an infectious molecular clone. J Virol 59:284 –291.
35. Visage Imaging. 1999 –2011. Amira 5 user’s guide. Visage Imaging, Ber-lin, Germany.
on November 7, 2019 by guest
http://jvi.asm.org/