City, University of London Institutional Repository
Citation
: Tyler, C. W., Elsaid, A.M., Likova, L.T., Gill, N. and Nicholas, S.C. (2012).
Analysis of human vergence dynamics. JOURNAL OF VISION, 12(11), doi:10.1167/12.11.21
This is the accepted version of the paper.
This version of the publication may differ from the final published
version.
Permanent repository link:
http://openaccess.city.ac.uk/5877/Link to published version
: http://dx.doi.org/10.1167/12.11.21
Copyright and reuse:
City Research Online aims to make research
outputs of City, University of London available to a wider audience.
Copyright and Moral Rights remain with the author(s) and/or copyright
holders. URLs from City Research Online may be freely distributed and
linked to.
City Research Online: http://openaccess.city.ac.uk/ [email protected]
Analysis of Human Vergence Dynamics
Christopher W. Tyler
Smith-Kettlewell Eye Research Institute, San Francisco, CA, USAAnas M. Elsaid
Smith-Kettlewell Eye Research Institute, San Francisco, CA, USALora T. Likova
Smith-Kettlewell Eye Research Institute, San Francisco, CA, USANavdeep Gill
Smith-Kettlewell Eye Research Institute, San Francisco, CA, USASpero C. Nicholas
Smith-Kettlewell Eye Research Institute, San Francisco, Ca, USADisparity vergence is commonly viewed as being controlled by at least two mechanisms, an open-loop vergence-specific burst mechanism analogous to the ballistic drive of saccades, and a closed-loop feedback mechanism controlled by the disparity error. We show that human vergence dynamics for disparity jumps of a large textured field have a typical time course consistent with predominant control by the open-loop vergence-specific burst mechanism, although various subgroups of the population show radically different vergence behaviors. Some individuals show markedly slow divergence responses, others slow convergence responses, others slow responses in both vergence directions, implying that the two vergence directions have separate control mechanisms. The faster time courses usually had time-symmetric velocity waveforms implying open-loop burst control, while the slow response usually had time-asymmetric velocity waveforms implying closed-loop feedback control. A further type of behavior in a distinct subpopulation is a compound anomalous divergence response consisting of an initial convergence movement followed by a large corrective divergence movement with time courses implying closed-loop feedback control. The closed-loop response for slow responses to disparity steps exhibited pronounced oscillations in the velocity trace, implying the involvement of a sampled-data system with a rate of about 3 samples/s. This analysis of the variety of human vergence responses thus contributes substantially to the understanding of the oculomotor control mechanisms underlying the generation of vergence movements.
Keywords: oculomotor dynamics vergence binocular eye movements convergence divergence anomaly
Introduction
Vergence control
The present study focuses on the issue of binocular ver-gence movements and the analysis of their control mecha-nisms when driven by large-field changes in disparity. Disparity vergence is commonly viewed as being con-trolled by at least two mechanisms, an open-loop ver-gence-specific burst mechanism analogous to the ballistic drive of saccades, and a closed-loop feedback mechanism controlled by the disparity error (Krishnan & Stark, 1977; Semmlow et al., 1986, 1993; Hung, et al., 1986; Erkelens,
2011). The time course of the vergence-specific burst is an order of magnitude slower than the saccadic time course for the same amplitude of motion of each eye.
The existence of a burst component of disparity ver-gence movements, though initially contentious (Robinson,
an effective proxy for the firing rate of the underlying mo-torneurons.
The presence of the closed-loop component of dispari-ty vergence control is consistent with the idea that the ver-gence waveform beyond the peak velocity should approx-imate the form of an exponential decay function, due to the proportional reduction in the error signal as the eye approaches the target positions (Robinson, 1975; Zee, FitzGerald & Optican, 1992). There are many cases in which the data approximate such an exponential decay. (Here we use the term “exponential” in the qualitative sense of a continuously decreasing velocity as the eyes asymptote to the final position, without attempting to as-sess how well it conforms to a mathematical exponential of the form e-x).
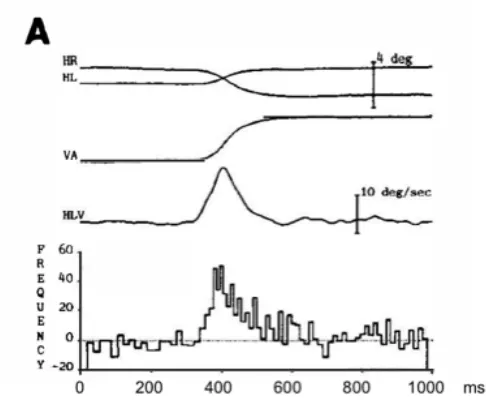
Fig. 1. Monkey vergence response reproduced from Gamlin & Mays (1992), showing the right and left horizontal eye position traces (HR, HL), the difference trace of vergence amplitude (VA), the corresponding vergence velocity trace (HLV) and the con-comitant change in firing rate of a midbrain medial rectus motor neuron recorded in the oculomotor nucleus during the move-ment. Note the similarity between the waveform of the velocity trace and motor neuron firing burst, which both have relatively long durations of about 200 ms.
The presence of two processes feeding into the motorneu-rons is further implied by the ‘dual mode theory’ of Hung, Semmlow & Ciuffreda (1986) and Semmlow & Yuan (2002), based on an independent components analysis of the variations in the disparity vergence responses, imply-ing that vergence movements consist of a rapid transient
component and a slower sustained component. However, it should be noted the assumption of independent compo-nents analysis is that the compocompo-nents are invariant in tem-poral waveform (varying only in their relative ampli-tudes), although it is well known that vergence move-ments have variability of their temporal parameters, which could give a spurious result of an initial transient compo-nent under the incorrect assumption of temporal invari-ance. The independent components analysis is therefore not by itself convincing evidence of a separate transient component to disparity vergence.
Recent work on the optimal control theory of saccadic dynamics suggests that the saccadic waveform is tuned to jointly minimize the duration and accuracy of each sac-cade (Harris & Wolpert, 1998; 2006; Tanaka, Krakauer & Qian, 2006; Xu-Wilson et al., 2009). At least for small saccades, this theory predicts a time-symmetric velocity function for the saccadic waveform, approximating a half-cosine waveform. Based on the empirical results of the dual-mode theory, we take this to be the signature of the transient component.
If valid, this ‘dual mode’ analysis implies that the open-loop component of vergence movements would have the same waveform structure as a saccade, although far slower in time course. This concept suggests that the waveform of open-loop component should be time-symmetrical (in the sense that the waveform velocity, or temporal derivative of the waveform, has symmetrical rise and fall times). This symmetric form is driven by a (slow) burst of activity in the oculomotor neurons driving the vergence movement and is formally distinguishable from the exponential concept of the closed-loop component, which implies a time-asymmetrical waveform as the feed-back progressively reduces the error to zero. We will use this difference in time-symmetry of the two components as a key to their relative predominance in our subject pop-ulations.
Types of vergence dynamics
In terms of peak velocity, it is well established that there is a ‘main sequence’ function of peak velocity vs. amplitude for disparity vergence eye movements, very similar to that for saccades (Rashbass & Westheimer, 1961; Hung et al.,
1994; Erkelens et al., 1989). The summary data of the latter study show a roughly linear increase in vergence velocity with amplitude up to about 2°, with a progressive saturation of the curve for larger amplitudes. For refer-ence, the slope of the linear portion is about 7°/s.
[image:3.612.42.285.280.483.2]matching time-functions in opposite directions in the two eyes (Collewijn, Erkelens & Steinman, 1995). Instead there is often reported to be an asymmetrical saccade in one eye (even when the target motion is perfectly symmet-rical), which may be seen as the vergence system employ-ing a biased strategy to achieve a faster acquisition of the vergence target (Coubard & Kapoula, 2008).
The third well-known disparity vergence behavior is seen for the situation of asymmetrical vergence to a later-ally off-center target, in which case a uniocular saccade is typically used to bring the eyes to the average position required by the target endpoint, with a slow convergence movement (which should have the exponential waveform) to complete the motion (Collewijn, Erkelens & Steinman,
1995). In particular, Horng et al. (1998) reported that the initial open-loop component of disparity vergence could be much reduced or absent in the divergence direction, although this conclusion was based on recordings from only two subjects, and other studies have not reported such a convergence/divergence imbalance.
Two kinds of disparity vergence movement are ex-cluded from this account. One is the case of symmetrical vergence saccades with the normal saccadic time course but in opposite directions in the two eyes. This form of saccadic eye movement is considered to be specifically prohibited in the conventional account, although the ex-plicit mechanism of the prohibition is obscure.
Vergence latencies
This account of the vergence dynamics would be incom-plete without a consideration of the vergence latencies, which are generally included as a free parameter in the cited models of vergence control. It is noteworthy that the vergence latencies are quite similar to those of saccades, at around 200 ms. Any differences reported in the literature are likely to be attributable to sampling differences be-tween the subject groups and the details of the method used to specify the time of onset of the respective move-ments. On this view, the latency for the initiation of both saccades and vergences is attributable to cortical pro-cessing of the sensory stimulation providing the impetus for the eye movements, i.e., the computational processes specifying the required amplitude and direction of the movements and the decision to initiate the movements (since they are essentially voluntary in character and can be suppressed if necessary). Once initiated, the control for the activation is passed to the oculomotor control systems of the brainstem and cerebellum, which evidently treat the two kinds of oculomotor requests very differently, but it is
likely that the cortical processing is basically similar in the two cases.
Rationale
Based on the foregoing overview, the main goal of the present paper is to reassess the status of symmetrical ver-gence movements and the extent to which they are achieved either by the open-loop (burst) or the closed-loop (exponential) component of the neural control system. This reassessment will be achieved by evaluation of the temporal asymmetry of the vergence velocity profiles around the peak velocity for a large number of subjects. The exponential decay form of the closed-loop model would have a highly asymmetric profile, while the open-loop burst model should be close to symmetric (similar to that for typical saccades; Harris & Wolpert, 1998). The temporal asymmetry criterion is thus a good indicator of the underlying mechanism of vergence control, and is quantified in the form of a temporal asymmetry index (see Methods).
A further goal of the paper is to evaluate the form of the vergence dynamics to full-field targets. In the world, when an object moves toward or away from the eyes, or when we move through the world, large regions of texture typically stimulate the retina. However, many oculomotor studies use only small targets to stimulate the vergence system. Here we evaluate the disparity vergence compo-nent of such large field stimulation, showing that anoma-lous forms of vergence eye movements are in fact encoun-tered at an unexpectedly high frequency.
Methods
Recruitment
This study involved a recruited base of 68 participants (59% female) from a non-academic population via a social media website for the normative study of oculomotor dy-namics, passing the exclusion criterion of having no clini-cal history of brain or ocular abnormalities, including traumatic brain injury events. All recruitment and experi-mental procedures in this study adhered to the Declaration of Helsinki.
The participants met the criteria of letter acuity of 20/40 or better in both eyes (Bailey-Lovie chart, mean LE denominator – 23 ± 5, mean RE denominator – 24 ± 6), and of passing a random-dot stereopsis test at a disparity of 4 arcmin. The ages ranged from 19 – 60 (mean – 36 ±
Oculomotor procedures
Binocular eye movements were recorded with the Vis-agraph III binocular infrared limbal eye tracker, which has a sampling rate of 60 Hz and a typical noise level of ~4 arcmin standard deviation in each eye for live human re-cordings (as assessed from the variability during fixation periods in the most stable participants). This assessment provides a net vergence noise level of ~3 arcmin after the four-point elliptical (third-order) smoothing applied to the eye movement traces. Of course, the measured variability would also take into account the physiological variation in the fixation capability and oculomotor stability of each participant, so would typically be much larger than the irreducible measurement error, but we note that many par-ticipants achieved calibrated mean standard errors of the repeated vergence signals close to the estimated optimal level of about 3 arcmin (see Figs. 3-11).
Horizontal position calibration series
To calibrate the linearity of the recorded position function, a 0.4º cross-hair monocular fixation target underwent two randomized sets of horizontal position shifts over the range from –16 to 16º for each eye, with button presses indicating when fixation was accurate at each position. The full set of points was fitted with a third-order poly-nomial to provide a linear calibration of the horizontal position separately for each eye.
Rapid horizontal disparity vergence jumps
Binocular eye movements are recorded while the 30 x 30º noise field incorporating a 1º central fixation target un-derwent 2º horizontal square-wave disparity changes eve-ry 2-3 s, with random jitter over 1 s from a uniform distri-bution to avoid predictability of the onset time. The mini-mum interval of 2 s allows comfortable completion of re-peated normal vergence movements.
Oculomotor time series analysis
The vergence (left-eye minus right-eye) signal waveform were extracted from a period around the times of the in-stantaneous transitions of the stimulus in a window from 1 second prior to the transition to 2.5 seconds after the tran-sition. The sets of converging eye movement transitions were analyzed separately from diverging eye movements. Each event response was re-zeroed by removing the mean value over the 100 ms preceding the transition. Non-representative individual responses were excluded from the analysis by iteratively removing responses whose mean squared error over time from the mean across non-excluded responses was beyond 2 standard deviations of
the mean error. (In no case were more than 3 responses excluded under this procedure.)
The average non-excluded vergence signal was nu-merically differentiated to derive the vergence velocity signal for each direction of eye movement for each sub-ject. To account for noise and drift, the full duration of the vergence movements was defined as the time from the last crossing of 5% of the peak velocity prior to the time of the peak to the first crossing of 10% of the peak velocity after the peak. (The limits are asymmetric because the onset variance was smaller than the offset variance as a conse-quent of the respective distances from the zeroing region.) The portions of the velocity traces beyond these limits are blocked out to focus the presentation on the degree of symmetry during the primary vergence movements.
Temporal Asymmetry
Temporal asymmetry of the velocity trace was defined by computing the ratio of the post-peak area minus the pre-peak area to the total area of the vergence interval defined from the velocity trace. In principle, this temporal asym-metry index has a value of 0 for a time-symmetric wave-form and a value of 1 for a pure exponential wavewave-form. In practice, the smoothing applied to the waveform reduces the maximum value for the pure exponential response af-ter the filaf-tering of the waveforms, so we defined a
Nor-malized Temporal Asymmetry Index (γ) as the ratio of
the empirical temporal asymmetry index to the theoretical temporal asymmetry index for a filtered exponential de-cay. (Note that a waveform with an asymmetry sharper
than the exponential form could have γ > 1.0). The Tem
Statistical Analysis
The statistical analyses were performed by t tests. Unless otherwise noted, significant results are reported at level of p < 0.01. Results reported as non-significant did not pass the criterion of p < 0.05.
Group Categorization Analysis
2 4 6 8 10 12
C
o
n
ve
rg
e
n
ce
F
re
q
u
e
n
cy 451 ms 945 ms
0 2 4 6 8 10 12
D
ive
rg
e
n
ce
F
re
q
u
e
n
cy
0 1 2 3
Duration (s) 451 ms 945 ms
0 5 10 15
20 331 576 1996
46 144 706
µ (ms)
σ (ms)
C
o
mb
in
e
d
V
e
rg
e
n
ce
F
re
q
u
e
n
[image:6.612.42.289.84.424.2]cy
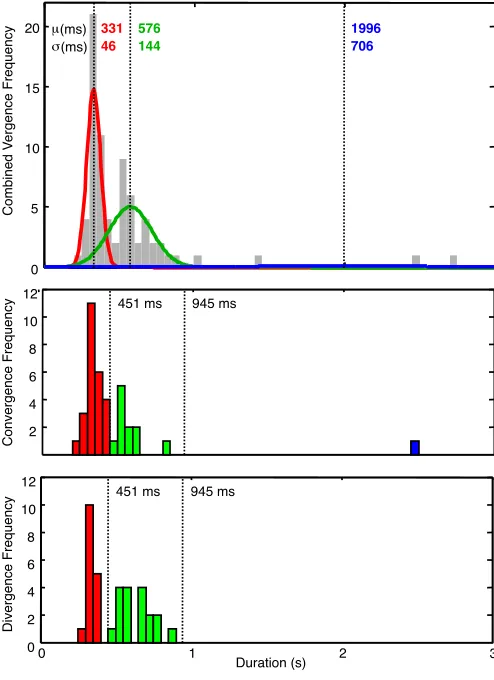
Fig. 2. Top panel: Gaussian Mixture Model cluster analysis of all well-formed vergence response durations, showing the fit for the optimal 3-Gaussian case (red, green and blue curves), with re-spective mean ±σ parameters. Center panel: Distribution of
convergence duration clusters with cluster boundaries at 451 and 945 ms. Bottom panel: Distribution of divergence duration clusters, similarly.
The next step was to group all the vergence durations (convergence or divergence) into a single group and apply a Gaussian mixture cluster routine to determine the opti-mal number of Gaussian clusters to categorize the dura-tions. The optimization error was specified according to the Bayesian Information Criterion (Schwartz, 1978) over fits from 1 to 12 Gaussians, which reached a minimum with three-Gaussian model. The three Gaussians best fit-ting the distribution are shown in Fig. 2. (Note that the blue curve for the long-duration fit is close to the duration axis.) The cluster boundaries between adjacent distribu-tions were determined from the upper 1% cutoffs of each Gaussian, which occurred at 451 and 945 ms, defining three duration ranges: typical, mid and slow vergence du-rations (T, M and S, respectively). These boundaries were then applied separately to the convergence and divergence duration distributions, respectively, to form nine dual-criterion categories in principle.
A final category (ACD) that will be specified in detail in Results had divergence responses that did not pass the initial screen because they began by consistently converg-ing prior to initiatconverg-ing the divergence movement (Anoma-lous Compound Divergence). This behavior implied that the divergence latency failed the screening criterion of < 500 ms, although the divergence velocities once initiated were within or close to the typical range of ~10°/s.
Results
Disparity vergence dynamics
Before analyzing the results in detail, the quantitative in-dices of median latency, duration, peak velocity and tem-poral asymmetry, together with their ± standard errors of the means (SEM) are presented in tabular form in Table I. The proportion of subjects falling into each category is tabulated in the first row of the table.
Table I: Vergence Dynamics Parameters for the Vergence Groupings
N"(%)
Convergence Median SEM Median SEM Median SEM Median SEM Median SEM Median SEM Median SEM Median SEM Median SEM Median"latency"(ms) 252 27 252 37 275 40 198 25 144 52 300 33 233 14 Peak"Velocity"(deg/s) 9.5 1.5 10.3 2.8 8.1 1.4 7.3 1.6 6.0 1.1 8.1 1.1 10.2 1.2
Duration"(ms) 333 12 330 18 341 17 538 25 585 17 316 47 317 33
Templ"Asymm 0.17 0.18 0.09 0.06 0.16 0.32 0.27 0.11 0.64 0.26 K0.77 0.12 K0.84 0.15
Divergence
Median"latency"(ms) 283 32 317 35 283 32 200 54 211 43 266 95 650 110 133 18 Peak"Velocity"(deg/s) K9.6 1.5 K9.1 1.9 K7.9 1.5 K5.0 1.3 K5.9 4.4 K3.8 0.2 K10.3 2.9 5.5 1.0 Duration"(ms) 337 10 317 12 317 10 700 25 567 23 1433 516 554 59 483 45 Templ"Asymm 0.16 0.05 K0.06 0.06 0.16 0.05 0.01 0.57 K0.20 0.16 0.67 0.24 1.07 0.18 K0.91 0.22
22 28 10 12 10 22
MID-DIV-(ONLY) VERGENCE SLOW-
TYPICAL-CONV-(ONLY) (DIV)ACD--- (CONV)
ACD---6 18 (18)
TYPICAL-CONV-(ALL) TYPICAL-DIV-(ALL) TYPICAL-BOTH
32
TYPICAL-DIV-(ONLY) MID-BOTH MID-CONV-(ONLY)
62
[image:6.612.37.579.581.705.2]6
Typical convergence/divergence responses
The ‘typical’ response group is defined as those individu-als with vergence movements in the short-duration range, up to about 450 ms in duration, for both the convergence and divergence directions. Examples of convergence movements for six individuals from the typical conver-gence/divergence group are shown in Fig. 3. For conver-gence responses in this typical group, the median latency
was 252 ± 37 ms, a typical peak velocity of 10.3 ± 2.8 °/s, and median total duration of 330 ± 18 ms, none of which are significantly different from the values for the larger group of typical convergence responses. Also, the velocity values are not significantly different from the correspond-ing velocity on the vergence main sequence summarized by Hung et al. (1994).
Convergence
0 1 2 3 4 5
L
E-R
E
Po
si
ti
o
n
(d
e
g
)
-0.5 0 0.5 1 1.5 2
0 5 10
Asymmetry = 0.05
11.52 deg/s 324 ms
L
E-R
E
V
e
lo
ci
ty
(d
e
g
/s)
Time (s)
-0.5 0 0.5 1 1.5 2
Asymmetry = 0.05
8.81 deg/s 350 ms
Time (s)
-0.5 0 0.5 1 1.5 2
Asymmetry = -0.01
7.47 deg/s 333 ms
[image:7.612.104.510.190.454.2]Time (s)
Fig. 3. Upper plots: Examples of typical mean convergence responses for three individuals (green curves, each averaged over 10-12 responses). Black line indicates the stimulus disparity change event. Gray dotted lines show the estimated amplitude and duration of each vergence movements. Cyan region represents the ± 1 SEM range of the variability over the 10-12 repeats for each trace. The star
marks the point of peak velocity. Lower plots: Corresponding velocity profiles for the same average responses (color curve), together with the time-inverted velocity profile (light gray curve) aligned with the peak of each response to illustrate its degree of temporal asymmetry, quantified above each velocity panel. Note the high degree of symmetry (near-zero asymmetry) of these typical examples. Duration and peak velocity values are estimated from the velocity trace as described in Methods.
Typical divergence responses
In the group of individuals with typical response dynamics for both convergence and divergence movements, typical divergence responses had the following characteristics: latency of 317 ± 37 ms, typical peak velocity of -9.1 ± 1.9
°/s, and a total duration of 317 ± 12 ms. Examples are shown in Fig. 4. These values indicate that none of the
dynamic parameters for the typical divergence response are significantly different from those for the convergence movements. These parameters are again different by an order of magnitude from those of typical saccades (see
7
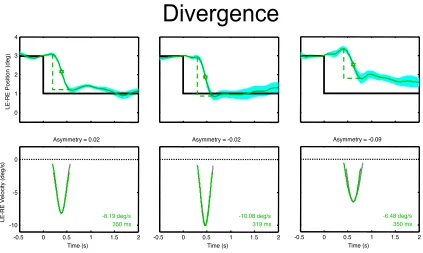
Divergence
0 1 2 3 4 L E-R E Po si ti o n (d e g )-0.5 0 0.5 1 1.5 2
-10 -5 0
Asymmetry = 0.02
-8.19 deg/s 350 ms Time (s) L E-R E V e lo ci ty (d e g /s)
-0.5 0 0.5 1 1.5 2
Asymmetry = -0.02
-10.08 deg/s 319 ms
Time (s)
-0.5 0 0.5 1 1.5 2
Asymmetry = -0.09
-6.48 deg/s 350 ms
[image:8.612.94.517.61.314.2]Time (s)
Fig. 4. Examples of typical mean divergence responses and velocity traces for the same sample of typical subjects and plotted with the same conventions as Fig. 3. Note the high degree of symmetry (near-zero asymmetry) of these typical examples of divergence.
Temporal Asymmetry
Across the group of typical subjects, the Normalized Temporal Asymmetry Index for the group (62%) of typi-cal convergence response rates had the value of γ = 0.17 ±
0.18, not significantly greater than zero. Because this su-perordinate grouping has some heterogeneity, we may
evaluate the asymmetry for the smaller group with typical responses in both directions, for which the asymmetry had the tighter range of γ = 0.09 ± 0.06, again not significantly different from zero. We may conclude that, for this wide-field texture stimulus at the disparity convergence ampli-tude of 2°, there is no significant positive temporal asym-metry in the convergence response.
0 0.5 1 1.5 2
0 1 2 3 4 5
0 0.5 1 1.5 2
-15 -10 -5 0
γ = 0.34
Time (s)
0 0.5 1 1.5 2
0 1 2 3 4 5
0 0.5 1 1.5 2
0 5 10
γ = -0.57
Time (s)
0 0.5 1 1.5 2
0 1 2 3 4
0 0.5 1 1.5 2
0 5 10 15
γ = -0.08
Time (s)
0 0.5 1 1.5 2
0 1 2 3 4
0 0.5 1 1.5 2
-10 -5 0
γ = 0.75
Time (s)
0 0.5 1 1.5 2
0 1 2 3 4 L E-R E Po si tio n (d e g )
0 0.5 1 1.5 2
0 5 10
γ = 0.34
L E-R E V e lo ci ty (d e g /s) Time (s)
0 0.5 1 1.5 2
0 1 2 3 4
0 0.5 1 1.5 2
-10 -5 0
γ = 0.47
Time (s)
A
B
C
Fig. 5. Examples of typical mean vergence responses and velocity traces for responses showing temporal asymmetries, plotted with the same conventions as Fig. 3. A: Convergence/divergence example from the Mid Both category. B: Convergence/divergence example from the Slow Divergence Only category. C: Divergence example from the Anomalous Compound Divergence category, analyzing the
[image:8.612.35.575.468.661.2]8 The Normalized Temporal Asymmetry Index was similar for the divergence responses of the superordinate group with typical divergence response rates. The net asymmetry was again small, at γ = 0.16 ± 0.05, though significantly positive in this group. For the smaller group with typical responses in both vergence directions, the divergence asymmetry was, however, not significantly different from zero, γ = -0.06 ± 0.06. Thus it seems that, in the fully typical individuals of the Typical Both group, divergence responses do not inherently have a different temporal form from convergence responses (Horng et al.,
1998), although convergence/divergence differences will become apparent as the less typical groupings are ana-lyzed.
To introduce the properties of the temporal asym-metry, we have to anticipate somewhat the grouping re-sults, so refer to the relevant sections for full details of those responses. The first case (Fig. 5A) is an example of strong asymmetry for both convergence and divergence, from the Mid Both vergence response category (see Table I). The range of the analysis is described in Methods. Note the separation between the forward time (green curves)
and reverse time (gray curves) plots of the velocity plots, defining the waveform asymmetry. The second case (Fig.
5B) is from the group of slow divergence responses with typical convergence responses. Note the tight overlap of the convergence velocity traces in contrast to the strong temporal asymmetry of the divergence traces. The pro-nounced oscillations of the slow velocity signals are typi-cal of the slow response group, and are considered in de-tail below. The third quartet of panels (Fig. 5C) is a typical case from the Anomalous Compound Divergence group, in which the divergence response is reliably preceded by an inappropriate convergence movement. Rather than ana-lyzing the responses to the convergence and divergence stimuli (as in the previous panels), here we analyze the convergence and divergence components of the pound divergence movements. While the divergence com-ponent has a positive temporal asymmetry similar to the other cases, the convergence component shows a strongly
negative value of temporal asymmetry, implying a more
gradual onset than offset time-course. The interpretation of these asymmetry features is left to the discussion.
Typical Saccades
A. Leftward
B. Rightward
-0.5 0 0.5 1 1.5 2 -20
-10 0 10 20
Po
si
ti
o
n
(d
e
g
)
Time (s)
-0.5 0 0.5 1 1.5 2 -20
-10 0 10 20
Po
si
ti
o
n
(d
e
g
)
Time (s)
-0.5 0 0.5 1 1.5 2 Time (s)
-0.5 0 0.5 1 1.5 2 Time (s)
-0.5 0 0.5 1 1.5 2 -0.5 0 0.5 1 1.5 2
Time (s)
[image:9.612.119.481.336.608.2]Time (s)
Fig. 6. Average position and velocity traces for leftward (upper panels) and rightward (lower panels) saccades averaged over 12 re-peats for the subjects of Figs. 3 and 4, showing the similar latencies and much faster time courses in relation to the vergence respons-es. The SEM as a function of time is shown as the pink shaded region around the tracrespons-es. The fact that this error region is barely visible reveals the high consistency of the saccadic performance, including the corrective saccade following the main saccade in most cases.
Vergence/saccadic interactions
Before considering the role of vergence/saccadic interac-tions, we include here an analysis of the saccadic
9 of primary (straightahead) position, with a temporal delay randomized over a flat distribution between 2s and 3s. The average saccades over 12 repeats show the typical laten-cies, similar to those of the typical vergence group (316 ± 68 ms), and typical saccadic durations of about 80 ms (see Bahill et al., 1975a).
We note that many subjects exhibit a habitual pattern of a slight saccadic undershoot followed by a corrective saccade, with an almost invariant pattern across the 12 repeats (shown as the barely-visible pink penumbra
around the purple time courses in Fig. 6). The timing of the corrective saccade was 173 ± 33 ms with a peak veloc-ity of 38°/s, similar to the values found in the original studies of this phenomenon (Becker & Fuchs, 1969; Becker, 1972). This information is included to provide reassurance that the saccadic dynamics recorded under the present conditions are, as expected, very different from the vergence dynamics (about 4 times shorter duration, even though their amplitude was ~10 times larger in each eye).
Individual vergence step response
0 10 20 30 40 50 60
-1 0 1 2 3
Time (sec)
Eye
p
o
si
ti
o
n
(d
e
g
[image:10.612.47.578.199.379.2])
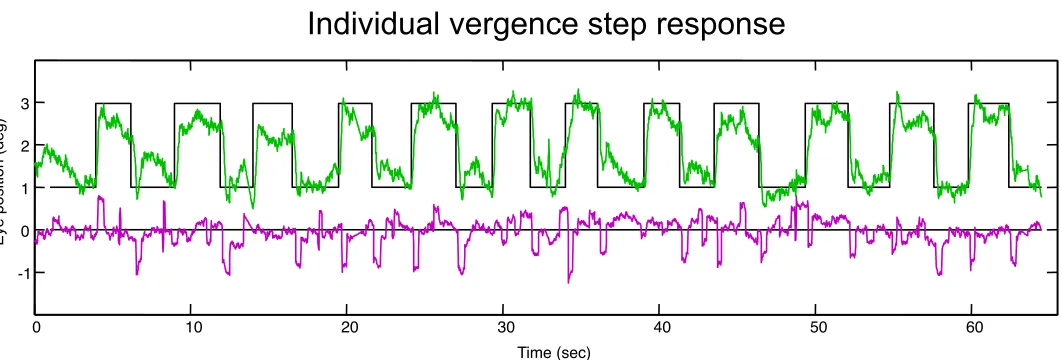
Fig. 7. Example of the saccades occurring during a vergence stimulation series of 1-3° vergence jumps over 12 irregular cycles (black
line). The vergence signal of the difference in position between the two eyes (green curve) shows an approximate match to the stimu-lus disparity with a delay of a few hundred milliseconds. The mean position of the two eyes over time (magenta curve) shows general stability around the mean stimulus position (zero disparity) overlaid with microsaccades of less than 1° amplitude, which often occur at or after the completion of the vergence responses.
In general, saccadic activity should not be expected to be a strong component of the symmetrical vergence response. In practice, the typical case is shown in Fig. 7, where symmetrical vergence is accompanied by self-corrective microsaccades that often have a boxcar form with a sac-cade following the vergence movement and a correction a few hundred milliseconds later. They represent the sub-jects’ saccadic refixations within the 1.25° fixation target. The saccades in Fig. 7 are conjunctive (lower trace), aver-aging out to a level that is undetectable relative to the pre-vailing noise level in the raw vergence difference wave-form (upper trace). In this example, the saccades are main-ly to the right for both convergence and divergence movements, but there was no consistent pattern across subjects. As can be seen in the averaged vergence re-sponses of Figs. 3 and 4, there is no evidence of a con-sistent saccadic component contributing to the vergence responses; the vergence durations are of the order of 320 ms (see Table I), with no hint of a coordinated saccadic jump anywhere along the averaged vergence waveforms (Figs. 3 & 4).
Midrate vergence responses
As indicated in Fig. 2, about 1/3 of the sample had vergence responses of up to twice the duration of the typi-cal rate in one or both vergence directions. According to the cluster analysis, these responses formed a distinct cate-gory with median durations of ~450 - ~950 ms, some for convergence, some for divergence and some for both. Of those with midrate vergences in both directions (12% of the sample; see Fig. 8), the median durations were 538 ± 25 ms and 700 ± 25 ms for convergence and divergence, re-spectively, significantly longer than for the typical vergence cases. The peak velocities were significantly lower than for the typical groups, at 7.3 ± 1.6 °/s and 5.0 ± 1.3 °/s, as
might be expected from the significantly longer durations. The median latencies, on the other hand, were at the low end of the typical range, at 198 ± 25 ms and 200 ± 54 ms,
10
than for the Mid-Rate Both group (or for the Typical group), and ii) that the divergence duration for the Midrate Divergence group was significantly shorter than for the
Mid-Rate Both group (though significantly longer than typ-ical) (see Table I).
Mid-rate Convergence/Divergence Responses
A. Convergence
B. Divergence
0 1 2 3 4 5 2.38 deg 217 ms Subject #20 LE -R E P os it ion (deg)-0.5 0 0.5 1 1.5 2 0
5 10
Asymmetry = 0.08
11.52 deg/s 367 ms LE -R E V el oc it y ( deg/ s ) Time (s) 2.10 deg 250 ms Subject #21
-0.5 0 0.5 1 1.5 2 Asymmetry = -0.11
10.49 deg/s 367 ms Time (s) 1.97 deg 233 ms Subject #22
-0.5 0 0.5 1 1.5 2 Asymmetry = 0.07
8.81 deg/s 383 ms Time (s) 1.56 deg 250 ms Subject #26
-0.5 0 0.5 1 1.5 2 Asymmetry = 0.07
7.37 deg/s 483 ms Time (s) 1.67 deg 272 ms Subject #2
-0.5 0 0.5 1 1.5 2 Asymmetry = 0.01
7.47 deg/s 395 ms Time (s) 1.82 deg 240 ms Subject #39
-0.5 0 0.5 1 1.5 2 Asymmetry = 0.21
7.50 deg/s 610 ms Time (s) 0 1 2 3 4 L E-R E Po si ti o n (d e g ) 0 1 2 3 4 5 2.38 deg 217 ms Subject #20 LE -R E P os it ion (deg)
-0.5 0 0.5 1 1.5 2 0
5 10
Asymmetry = 0.08
11.52 deg/s 367 ms LE -R E V el oc it y ( deg/ s ) Time (s) 2.10 deg 250 ms Subject #21
-0.5 0 0.5 1 1.5 2 Asymmetry = -0.11
10.49 deg/s 367 ms Time (s) 1.97 deg 233 ms Subject #22
-0.5 0 0.5 1 1.5 2 Asymmetry = 0.07
8.81 deg/s 383 ms Time (s) 1.56 deg 250 ms Subject #26
-0.5 0 0.5 1 1.5 2 Asymmetry = 0.07
7.37 deg/s 483 ms Time (s) 1.67 deg 272 ms Subject #2
-0.5 0 0.5 1 1.5 2 Asymmetry = 0.01
7.47 deg/s 395 ms Time (s) 1.82 deg 240 ms Subject #39
-0.5 0 0.5 1 1.5 2 Asymmetry = 0.21
[image:11.612.104.488.145.432.2]7.50 deg/s 610 ms Time (s) L E-R E Po si ti o n (d e g ) 0 1 2 3 4
Fig. 8. Examples of typical mid-rate convergence responses and velocity traces plotted with the same conventions as Fig. 3.
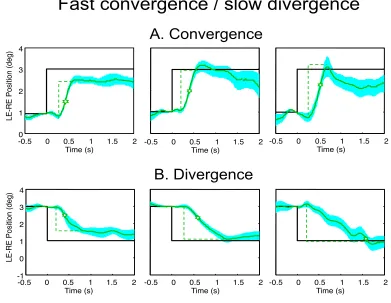
Fast convergence / slow divergence
A subgroup of four individuals of this sample of non-TBI and non-strabismic individuals had much slower ver-gence responses (duration > 945 ms) in either the conver-gence or diverconver-gence direction, although none of the sam-ple had such slow responses in both directions. Since only one was a slow convergence case, that one does not quali-fy as a group, so we will only consider the group statistics for the slow divergence group (Fig. 9). The convergence responses all fell in the typical range with a median laten-cy of 300 ± 33 ms, a total duration of 316 ± 47 ms, and a typical peak velocity of 8.1 ± 1.1 °/s, all of which are similar to those of the typical group. The divergence
re-sponses had much slower rere-sponses of -3.8 ± 0.2 °/s with correspondingly longer durations of 1433 ± 516 ms, but typical latencies of 266 ± 95 ms.
11
Fast convergence / slow divergence
A. Convergence
-0.5 0 0.5 1 1.5 2 Time (s)
-0.5 0 0.5 1 1.5 2 Time (s)
-1 0 1 2 3 4
L
E-R
E
Po
si
tio
n
(d
e
g
)
-0.5 0 0.5 1 1.5 2 Time (s)
-0.5 0 0.5 1 1.5 2 Time (s)
-0.5 0 0.5 1 1.5 2 Time (s)
0 1 2 3 4
L
E-R
E
Po
si
tio
n
(d
e
g
)
-0.5 0 0.5 1 1.5 2 Time (s)
[image:12.612.113.504.74.377.2]B. Divergence
Fig. 9. Examples of vergence movements from three individuals with typical convergence responses but slow divergence movements, plotted with the same conventions as Fig. 3. The vergence movements are repeatable to within a standard error of a few arc min.
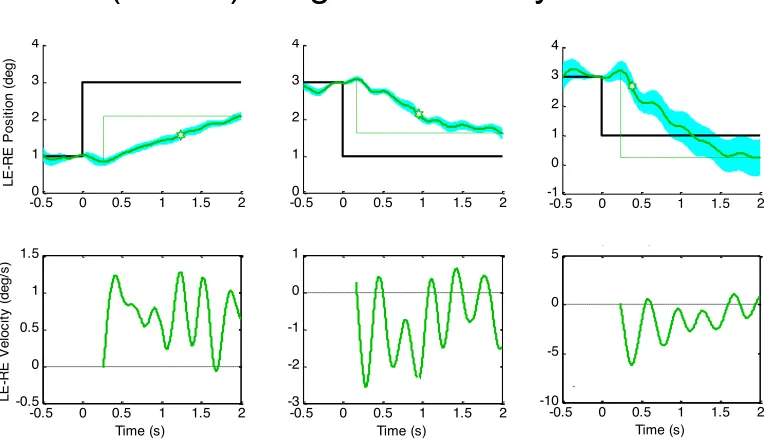
Slow vergence oscillations
To provide further insight into the nature of the con-trol mechanism for slow vergence movements, we select-ed all the responses conforming to the character of domi-nance by the closed-loop feedback vergence control sys-tem, defined as those with a duration longer than 1 s and a temporal asymmetry index γ > 0.5. To take a detailed look at these responses, a sample of three of them are plotted in
Fig. 10, together with their velocity profiles. Although characterized earlier by the temporal asymmetry analysis
12
Slow (0.3 Hz) Vergence Velocity Oscillations
-0.50 0 0.5 1 1.5 2 1
2 3 4
DoD027, DoD027 R-2
LE -R E P os it ion (deg)
-0.5 0 0.5 1 1.5 2 -0.5
0 0.5 1 1.5
Asymmetry index = -0.19
LE -R E V el oc it y ( deg/ s ) Time (s)
-0.50 0 0.5 1 1.5 2 1
2 3 4
-0.5 0 0.5 1 1.5 2 -3
-2 -1 0 1
Asymmetry index = 0.78
Time (s)
-0.5 0 0.5 1 1.5 2
-1 0 1 2 3 4
DoD044, DoD044 R-8
LE -R E P os it ion (deg)
-0.5 0 0.5 1 1.5 2
-2 0 2 4 6
Asymmetry index = -0.01
4.77 deg/s LE -R E V el oc it y ( deg/ s ) Time (s)
-0.5 0 0.5 1 1.5 2
-1 0 1 2 3 4
-0.5 0 0.5 1 1.5 2
-10 -5 0 5
Asymmetry index = 0.62
-6.19 deg/s
Time (s) -0.50 0 0.5 1 1.5 2
1 2 3 4
DoD011, DoD0011 R-6
LE -R E P os it ion (deg)
-0.5 0 0.5 1 1.5 2
-1 0 1 2 3
Asymmetry index = 0.70
1.98 deg/s LE -R E V el oc it y ( deg/ s ) Time (s)
-0.50 0 0.5 1 1.5 2 1 2 3 4 -1.57 deg 133 ms
-0.5 0 0.5 1 1.5 2
-8 -6 -4 -2 0
Asymmetry index = -0.24
-6.36 deg/s
417 ms 249 ms
[image:13.612.112.498.80.300.2]Time (s)
Fig. 10. Assemblage of the mean vergence amplitude (upper plots) and velocity (lower plots) waveforms for a sample of vergence re-sponses meeting the criteria of a duration > 1 and an asymmetry index > 0.5. Note pronounced oscillations in the vergence velocity plots (colored curves). Other conventions as in Fig. 3.
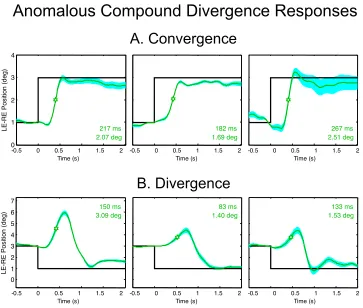
Anomalous compound divergence response
A substantial subgroup of nine individuals from this study (with no strabismus or reported TBI) showed a profound inability to make prompt disparity-driven divergence movements. Instead, the divergences were preceded by an initial convergence movement before the required diver-gence could take place. A raw 60 s verdiver-gence record of the 12 repeats of the convergence/divergence cycles for one such subject is shown in Fig. 11. Note that, on this 60 s time scale, a saccade appears as an almost-vertical line in the trace, of which only three are visible (at 17, 36, and 52 s). The time courses of the anomalous vergence
move-ments (the 2 s spike after each divergence stimulus) were non-saccadic, with typical vergence dynamics (compare
Figs. 4 & 5).
Averages of convergence and divergence responses over 12 events (see Methods) are plotted for three such subjects in Fig. 12. The upper panels show that the con-vergence movements were within the typical range, with average latencies of 233 ± 14 ms, average durations of 317 ± 33 ms, and average velocities of 10.2 ± 1.2 °/s, none of which are significantly different from the typical val-ues. The one parameter that did differ from the typical value was the temporal asymmetry of γ = -0.84 ± 0.15.
Individual Anomalous Compound Divergence Response Series
0 10 20 30 40 50 60
Time (sec) 1 3 5 V e rg e n ce a n g le (d e g ) -1
[image:13.612.40.565.533.679.2]7 LE - RE
13 Only when this convergence movement was complet-ed did the eyes begin a divergence movement, usually immediately but in one case after about a second’s delay. In most cases, the divergence movement was longer than the normal divergence movement (554 ± 59 ms), suffi-cient to correct for the initial convergence to bring the eyes close to the required vergence posture at the typical
vergence velocity (10.3 ± 2.9 °/s). These divergence movements had the largest values for temporal asymmetry of any vergence movement (γ = 1.07 ± 0.10) indicating that they were on average close to the exponential form, implying that the open-loop burst mechanism for diver-gence was inactivated in these individuals.
Anomalous Compound Divergence Responses
A. Convergence
B. Divergence
0 1 2 3 4 5 6 7 3.09 deg 150 ms L E-R E Po si ti o n (d e g) 1.40 deg83 ms 1.53 deg133 ms
0 1 2 3 4 5 2.38 deg 217 ms Subject #20 LE -R E P os it ion (deg)
-0.5 0 0.5 1 1.5 2 0
5 10
Asymmetry = 0.08
11.52 deg/s 367 ms LE -R E V el oc it y ( deg/ s ) Time (s) 2.10 deg 250 ms Subject #21
-0.5 0 0.5 1 1.5 2 Asymmetry = -0.11
10.49 deg/s 367 ms Time (s) 1.97 deg 233 ms Subject #22
-0.5 0 0.5 1 1.5 2 Asymmetry = 0.07
8.81 deg/s 383 ms Time (s) 1.56 deg 250 ms Subject #26
-0.5 0 0.5 1 1.5 2 Asymmetry = 0.07
7.37 deg/s 483 ms Time (s) 1.67 deg 272 ms Subject #2
-0.5 0 0.5 1 1.5 2 Asymmetry = 0.01
7.47 deg/s 395 ms Time (s) 1.82 deg 240 ms Subject #39
-0.5 0 0.5 1 1.5 2 Asymmetry = 0.21
7.50 deg/s 610 ms Time (s) 0 1 2 3 4 2.07 deg 217 ms L E-R E Po si ti o n (d e g ) 1.69 deg 182 ms 2.51 deg 267 ms 0 1 2 3 4 5 2.38 deg 217 ms Subject #20 LE -R E P os it ion (deg)
-0.5 0 0.5 1 1.5 2 0
5 10
Asymmetry = 0.08
11.52 deg/s 367 ms LE -R E V el oc it y ( deg/ s ) Time (s) 2.10 deg 250 ms Subject #21
-0.5 0 0.5 1 1.5 2 Asymmetry = -0.11
10.49 deg/s 367 ms Time (s) 1.97 deg 233 ms Subject #22
-0.5 0 0.5 1 1.5 2 Asymmetry = 0.07
8.81 deg/s 383 ms Time (s) 1.56 deg 250 ms Subject #26
-0.5 0 0.5 1 1.5 2 Asymmetry = 0.07
7.37 deg/s 483 ms Time (s) 1.67 deg 272 ms Subject #2
-0.5 0 0.5 1 1.5 2 Asymmetry = 0.01
7.47 deg/s 395 ms Time (s) 1.82 deg 240 ms Subject #39
-0.5 0 0.5 1 1.5 2 Asymmetry = 0.21
7.50 deg/s 610 ms
Time (s)
Fig. 12. Averaged convergence and divergence movements (green curves) from three individuals with anomalous compound diver-gence behavior (plotted with the same conventions as Fig. 3). A: examples of typical average converdiver-gence responses. B: Average divergence movements for the same three individuals. Note the low error across the repeated examples of the divergence movements, implying a non-adapting stereotypical behavior.
Discussion
As expected, the parameters of the typical vergence dy-namics were clearly distinct from those of the saccadic system. If we consider the main sequence parameters for a saccade of the size of the present vergence movements (1°
in each eye), it should have an expected duration of 20 ms and a velocity of 40 °/s [ i.e., (200°/s at 5°)/5 ] (Bahill et al., 1975a), while the typical vergence responses had the total duration of about 330 ms and a typical peak velocity in each eye of about 5 °/s for both the convergence and divergence directions (making a total vergence velocity of about 10 °/s). Thus, the vergence impetus is an order of
magnitude less efficient than the saccadic, requiring a neu-ral drive of about 20 times longer duration.1
1
We note that the extreme values of up to an average of about
70 °/s (35 °/s in each eye) for the maximum vergence velocities
reported by Erkelens et al. (1989) were obtained for large ver-gence angles under full cue conditions. In terms of the ‘main sequence’ concept, these velocities were again about a factor of 20 lower than the maximum reported saccadic velocities of
600-800 °/s, and had durations of the order of a factor of 10 longer,
[image:14.612.121.484.169.477.2]14 We may expect the total energy needed to move each eye during the vergence movement to match that of sac-cadic eye movements. Accordingly, Gamlin & Mays (1992) found that medial rectus motorneurons in the mid-brain had about the same integrated firing rate for saccadic and vergence movements of the same amplitude (4°). In-terestingly, if we divide the saccadic velocity by the dura-tion factor of 1/20 between saccades and vergences, this total energy hypothesis predicts a peak vergence velocity of 40/20 or 2°/s, which is within a factor of 2 of the meas-ured velocity. Since these motorneurons are the final common pathway for vergence and saccadic movement control, it makes sense that they should approximately adhere to the principle of the same total energy for a given eye movement, corresponding to the same total number of motorneuron spikes, despite the order of magnitude differ-ence in the durations of the eye movements. The factor of 2 discrepancy for vergence relative to versional move-ments has been validated in direct muscle force measure-ments by Miller, Davison & Gamlin (2011).
This analysis leaves unanswered the question of why the duration of vergence movements should be so much longer than that of saccades. Presumably, it is not evolu-tionarily adaptive, because the slowness of vergence movements leaves significant time for diplopia to become evident, which constitutes an undesirable failure of object coherency whenever large vergence movements are made. Instead, the slowness may derive from the physiology of the vergence control pathway, which is routed through the cerebellum rather than having a direct cortical/brainstem drive (Gamlin, 1999,2002). Perhaps there is something in the integrative nature of cerebellar processing that requires a longer integration time than is available through the di-rect drive.
A key factor determining the slowness of vergence movements may well be the inhibitory cross-coupling
via inhibitory burst neurons (Strassman et al, 1986) be-tween the pairs of brainstem nuclei that control the ipsilat-eral motor neuron activation for both the latipsilat-eral and medi-al rectus muscles (in the abducens and oculomotor nuclei, respectively). Presumably, this mechanism has evolved to inhibit the contralateral motor neurons to the correspond-ing muscle type in order to maximize the conjugate (paral-lel) pairing of the muscle activations required for sac-cades. Based on the relative durations of vergence and saccades, the specific proposal to account for the vergence dynamics would be that this contralateral inhibition is 90% effective or more, reducing the drive to the eye mus-cles for the symmetric activation of vergence movements to 10% or less of the level for the conjugate activation of saccades. As a result, the vergence system has to generate the drive for more than 10 times longer duration to achieve the same amplitude of symmetric vergence
movements as conjugate saccades, in accord with the equivalence of the time-integrated signals reported by Gamlin & Mays (1992).
Waveform asymmetry analysis
This study introduces an index of temporal asymmetry that assesses the time-symmetry of the vergence velocity trace. This Normalized Temporal Asymmetry Index (symbolized as γ) was designed to evaluate interpreting the temporal symmetry results in terms of the dual-mode model reviewed in the Introduction, consisting of an
open-loop burst component driving disparity vergence
movements and a closed-loop vergence tracking compo-nent corresponding to the step-response minimization of the error signal generated by the disparity step. The closed-loop response to a step change in the tonic ver-gence signal is expected to conform to an exponential time course (Robinson, 1975; Zee, FitzGerald & Optican,
1992), while the open-loop response should have a more symmetric form derived from an open-loop burst mecha-nism (Gamlin & Mays, 1992). This model generates a Normalized Temporal Asymmetry Index value of γ = 0.6 – 0.9 for the exponential time course of closed-loop ver-gence eye movements. (The full asymmetry of γ = 1.0 would correspond to a pure exponential waveform, but there is always some smoothing of the onset rise time that reduces the index below 1.0.)
The neural signals of saccadic burst neurons, on the other hand, are not exponential in form but are largely symmetrical in time in the amplitude range of most ver-gence movements (Becker & Fuchs, 1969; Becker, 1972; Bahill, Clark & Stark, 1975; Harris & Wolpert, 1998;
2006; Tanaka, Krakauer & Qian, 2006; Xu-Wilson et al.,
2009). Thus, although in principle saccades could have the exponential form characteristic of a closed-loop continu-ous feedback system, in practice they approximate the time-symmetric form of a fully ballistic drive for ampli-tudes within the vergence range of up to about 10°. Since the velocity/time function of an eye movement is a rea-sonable proxy for the underlying motor neuron burst that drives it (Fig. 1), we may operationalize the symmetry of the velocity/time plot as an indicator of the degree of in-volvement of a neural burst of activation in the generation of any given eye movement. Based on the weight of the evidence, then, we will take perfect symmetry (γ = 0) as implying that the eye movement is entirely driven by a neural burst, while large asymmetries of γ > 0.5 will be assumed to imply a strong dominance by the closed-loop step response.
diver-15 gence movements, under the present stimulation condi-tions of a widefield texture stimulus at a vergence ampli-tude of 2°, may be taken as suggesting that the typical vergence system response may be driven by an open-loop burst mechanism comparable to that of the saccadic sys-tem, although weaker by an order of magnitude (as indi-cated by the respective durations of about 400 ms vs 20 ms, respectively, for typical vergence and saccadic movements at this amplitude; cf. Figs. 3, 4 & 6). A similar result can be seen in the large vergence movements of Erkelens et al. (1989). This analysis through the Normal-ized Temporal Asymmetry Index thus tends to validate the dual-mode model not only for typical convergence but also for typical divergence responses (Table I). Atypical forms with high positive and even high negative symme-tries are encountered in some of the groups, but in the typ-ical range defined by durations < 450 ms, the temporal asymmetry remains close to zero, similar to that of the typical convergence responses. Thus, we infer that the optimal divergence response is not fundamentally differ-ent in control dynamics from the convergence response – both are well described by the dual-mode theory of a combination of fast open-loop and more accurate closed-loop control mechanisms.
Latencies
Before discussing the detailed properties of each of the other subgroups, a general comment on the latencies is in order. For the four groups with typical response behavior, the latencies had similar values, of 252 and 317, 275 and 283, for the pairings of convergence and divergence movements, respectively (see Table I). Similarly the mid-rate latencies, though shorter (at 198 and 200, 144 and 211 ms, respectively), failed to exceed the statistical criteria for significant differences. Thus, the atypical groups did not show any tendency to have significantly longer laten-cies than the typical vergence group, all being between about 150 and 320 ms, with SEMs of 25-50 ms. Similar results are evident for the Slow Divergence group. This relative invariance in the latencies gives assurance that the atypical groups were not suffering from the kinds of gen-eral neurological problems or impaired cortical decision-making capabilities that affect saccadic latencies, suggest-ing instead that the slowsuggest-ing and anomalous behavior in theses cases was specific to their vergence control mecha-nisms once the movement was triggered.
Slow divergence with typical convergence
move-ments
A significant subgroup of the participants had slow diver-gence dynamics in conjunction with typical converdiver-gence dynamics. One subject had the reverse combination: typi-cal divergence dynamics combined with slow convergence
dynamics. The same diversity was reported among the small group of four subjects studied by Erkelens et al, (1989), two having faster convergence and two having faster divergence for the extreme vergence movements studied there. The implication is clear, therefore, that the convergence and divergence dynamics are controlled by distinct brainstem mechanisms, either of which can show abnormalities while the other is within the normal range (in the sense that they form a large cluster with low varia-bility of the convergence dynamics, Fig. 2). The fact that, for the majority of the participants, the convergence mechanism is within a range defined as ‘normal’ implies that it is less susceptible to neurological disruption than the divergence mechanism (whether from developmental or idiopathic etiologies). The two vergence directions both appear to be capable of similar dynamics (i.e., when both are in the typical range), but differences in dynamics in the non-typical cases suggest that they have independent control mechanisms that are differentially susceptible to prevailing forms of disruption.
The high temporal asymmetry indices for the slow di-vergence movements suggest that they conform to the closed-loop feedback control, (in contrast to the close-to-zero values for the typical divergence movements, imply-ing open-loop control). Thus, the presence of two reliable forms of temporal asymmetry may be regarded as confir-mation of the presence of a distinct mechanism underlying the slow disparity vergence movement behavior. The asymmetric variety may represent the operation of the closed-loop feedback mechanism in cases where the open-loop mechanism fails to operate, for either ontogenetic or adventitious post-developmental reasons.
Curiously, the convergence responses in the Slow Di-vergence group exhibit the unexpected behavior of a nega-tive asymmetry, implying a gradual onset of the velocity profile rather than the gradual offset predicted by the closed-loop hypothesis. Similar behavior is seen below for the Anomalous Compound Divergence group and can be interpreted as a form of nonlinear neural recruitment, generating progressive acceleration of the movement to-ward the end of the response.
Oscillatory vergence behavior as indicative of a
sampled data system
16 (Rashbass & Westheimer, 1961). This process will repeat as long as the disparity-tracking target continues to move.
However, Rashbass & Westheimer (1961) also report-ed vergence oscillations in disparity vergence step re-sponses in one anomalous subject (although this anomaly was dismissed by Semmlow, Hung & Ciuffreda, 1986, as a lack of fusion or noise artifact). The original authors ar-gued that the oscillatory behavior typically seen in dispari-ty vergence tracking tasks was most likely an indication that disparity vergence control is a sampled-data system. 2
The disparity step task is a specific test of this sampled-data hypothesis, which predicts vergence oscillations as the residual error is resampled to see how much it has been reduced toward zero as the vergence movement pro-gresses, whereas the delayed feedback model predicts a
continuous reduction in the vergence error as long as the
residual disparity does not reach zero (and predicts oscilla-tions only during a continuous disparity tracking task). However, this sampled-data prediction is complicated by the presence of a dual-mode vergence system, since the open-loop step response is fast enough to bring the dispar-ity to zero within one sampling interval, implying that no oscillations would be expected in a disparity step task for normal vergence steps. Only when vergence behavior was governed by the closed-loop system would vergence oscil-lations be expected.
The implication of this analysis is that the anomalous subject reported by Rashbass & Westheimer (1961) could have had a weak or absent disparity-step vergence system, revealing the sampled-data mode of the closed-loop com-ponent during the extended vergence movement occurring in their step disparity task. We can test this in the present paradigm by looking at the velocity traces in cases where particular subjects had slow convergence or divergence movements (implying that their open-loop burst vergence system was weak or absent, and that they had to use the closed-loop feedback system to generate the responses to the step disparity stimulus).
2 Oscillatory responses are also characteristic of
under-damped second-order control systems. However, the fact that the vergence system shares the oculomotor plant with the sac-cadic system, and that the sacsac-cadic waveforms of the subjects in the slow vergence oscillation group did not, in fact, exhibit any evidence of oscillations during saccades for any of the subjects with slow vergence responses (data not shown), implies that the oscillatory behavior of the slow vergence responses is more likely attributable to the alternative hypothesis of a sampled-data behavior in the neural control system for vergence than to under-damping in the oculomotor plant.
Before analyzing the present data, we may consider the reported oscillatory vergence behavior by Sylvestre et al. (2002). Although these authors predict and confirm a form of oscillatory vergence behavior, they do so in the context of combined vergence and saccadic eye move-ments, in which vergence is very much the junior partner, with no vergence demand and amplitudes an order of magnitude smaller than the saccadic responses. Moreover, the oscillations are rapidly damped following the primary step response. This study provides only weak support for the vergence sample-data hypothesis, therefore. Finally, we note that the form of conjugate, saccadic oscillations described by Ramat et al. (2005) are not equivalent to the vergence oscillation we describe, both because the former are conjugate in the two eyes and because they are an or-der of magnitude faster, at around 30 Hz.
The amplitude and velocity plots for the slow re-sponses meeting the criteria for the missing open-loop vergence system (illustrated in Fig. 10) provide a strong test of the hypothesis that the residual vergence control system is a closed-loop sampled-data feedback system. If it were a continuous feedback system (with or without delay), the slow ramp of the vergence responses and the velocity traces should be close to pure exponential func-tions. In fact, the velocity traces of these slow responses reveal profound oscillations in the vergence behavior, as predicted by the sampled-data hypothesis.3 It seems that
the vergence error is sampled only intermittently to deter-mine whether to inject another burst of activation to fur-ther reduce the disparity error, at sampling rates of ~3 samples/s. Bearing in mind that these are averages of 12 responses each, to asynchronous stimulus events, it seems that the sampling is typically synchronized by the stimulus event, in order that the individual responses would have averaged to a clean trace. Thus, the oscillatory form of the disparity step responses for these slow-vergence subjects implies that the closed-loop disparity vergence system is indeed a type of sampled-data system predicted by Krish-nan & Stark (1977) and Hung (1998), as opposed to being
3
17 merely a delayed-feedback tracking system generating limiting cycles for the tracking behavior (although the presence of a significant feedback delay cannot be exclud-ed by this analysis).
It should be noted that this sampled-data analysis could only be performed effectively on the small group of very slow responses, since the typical and mid-rate re-sponses have only one or two cycles of oscillation to dis-tinguish from the primary response, which could not be done without quantitative model fitting of the response behavior.
Anomalous compound divergence response
In the present sample, a substantial subpopulation of about 18% of the subjects (with no strabismus on a cover test or reported history of TBI) showed an inability to make prompt divergence movements. Instead, the divergence stimulus evoked the compound response of an initial
con-vergence movement comparable to the response to the
convergence stimulus, followed by a larger divergence movement bringing the eyes approximately to the intend-ed target disparity despite having initially movintend-ed in the wrong direction (Figs. 11 & 12). We have not been able to identify any previous reports of this type of oculomotor anomaly. For example, nothing of this kind is mentioned in the NEI Classification of Eye Movement and Strabis-mus (CEMAS) Report (2001). Even in cases of strabismus and related oculomotor disorders (Kenyon, Ciuffreda & Stark, 1980) or TBI (Thiagarajan, Ciuffreda & Ludlam,
2011), no such behavior has been reported.
It is worth considering the timing of the anomalous convergence movement in detail. Note that the anomalous initial convergence dynamics were in the typical range for convergent disparity stimuli (~300 ms in duration), and that the individual responses were usually similar for all individual trials. This result makes clear that the anoma-lous convergence movement in the compound movement complexes was not a saccade of some kind (which should have had a duration of only about 20 ms for this ampli-tude), but was a genuine convergence movement.
Why should a divergence stimulus evoke an initially convergent eye movement? Two possible explanations suggest themselves: disparity-change uncertainty and an in verse priming strategy.
1. If disparity changes were occurring unpredictably, and if the convergence and divergence subsystems were in competition with each other but with convergence slightly predominating, it might be supposed that disparity change would tend to activate the dominant response direction in
both directions before the sign of disparity change was processed, hence activating a convergent response in both cases. Such a response would be appropriate for the con-vergence stimulus but would need correcting when the
stimulus was a divergent disparity. Thus, under this
dis-parity-change uncertainty hypothesis, the anomalous
convergence response to divergent stimuli would be a re-flection the initial uncertainty as to the direction of the disparity change. This hypothesis would also predict an appropriate direction for the convergence response, and is hence consistent with both directions of vergence behavior in these individuals.
However, although the timing of each stimulus event was jittered over a 1 s range in our paradigm, the sign
(and amplitude) of each disparity change (i.e., convergent or divergent) was perfectly predictable throughout the se-quence. Each convergence stimulus was followed by a divergence stimulus, and vice versa. Thus, on a cognitive level at least, the subject had every opportunity to gear up for a divergence response to each divergence stimulus. Of course, this does not necessarily imply that the directional information was available to the burst neurons generating the initial burst of activation to drive the fast onset of the divergence movement, but the system had the ~300 ms latency period before the movement took place to compute the sign of the disparity (which is about the length of the perceptual integration time for disparity processing; Tyler & Julesz, 1980; Tyler, 1983), so there is little reason to suppose that the disparity information would not have been available. The disparity-change uncertainty explana-tion thus seems relatively implausible.
2. The other hypothesis to account for these anoma-lous compound divergence movements is an ‘inverse priming’ strategy for divergence initiation. This hypothe-sis is based on the concept that there is some impediment to initiating a divergence movement, and that making a convergence movement primes the system to a state of readiness to be able to implement the required divergence movement. This priming mechanism could be similar to the priming of secondary express saccades (Fischer & Ramsperger, 1984; Takagi, Frohman & Zee, 1985; Fisch-er, Weber & Biscaldi, 1993; Coubard, Daunys & Kapoula,
2004; Van Koningsbruggen & Rafal, 2009). On this hy-pothesis, these anomalous compound divergence move-ments are manifesting some deficiency in the divergence system that derives in the ability to initiate divergence movements. Making the anomalous convergence move-ment would release the system from this initiation defect and allow the divergence mechanism to operate normally from that point onwards.