JOURNAL OFVIROLOGY,May1974, p.1110-1117
Copyright( 1974 American Society forMicrobiology Printed in U.S.A.Vol. 13, No.5
Transcription
Unit
Mapping
in
Bacteriophage T7
II.
Proportionality
of
Number
of
Gene Copies,
mRNA, and Gene Product
ALAN R. BRAUTIGAM AND WALTER SAUERBIERDepartment of Biophysics andGenetics, University of Colorado Medical Center, Denver,Colorado80220 Received for publication 24 January 1974
The effect of UV irradiation of bacteriophageT7oninvivo early RNA synthesis
has been studied by direct quantitation ofthe gene-specific RNA transcripts.
The results show that the earlyregion ofphageT7istranscribed from lefttoright
as asingle unit. Furthermore, geneinactivation, theUV sensitivity of synthesisof
gene-specificRNA, and the UV sensitivityofsynthesisofthecorresponding
pro-teins all followpseudofirst-order kinetics in multiply infected cells, demonstrat-ing a random statistical correlation between both transcriptional sampling of genecopies and translational sampling of the resultantRNA transcripts. In addi-tion, these simple kinetics imply an absence of positive feedback mechanisms compensating for the differential decline of individualearlygeneproducts in cells multiply infected withphage T7.
Recently
wepresented
aradiological method
for
locating the
promotor sites for the in vivotranscription
ofbacteriophage
T7 DNA byEscherichia coli RNA polymerase
(2). Thismethod
would appear
tobe
ofgeneralvalidity,
requiringonly that the RNA polymerase be
released
atthe
site ofUV
lesions
andthat
UVirradiation
not createartificial
promotor sites.These
requirements arefulfilled
in in vitro transcriptions (17)and
inthe four
in vivo systemswhich
wehave
recently
studied: T7
(2), T4(6),
E. coli
(seealso
ref.13), and mammalian
cells
(P. Hackett
and W.Sauerbier,
manuscript
in preparation).Application
ofthe
method
requires
a knowngenetic
mapand
a quantita-tive assay of atranscription
product
ofeach
gene.This
assaycould
inprinciple be either
a measureofthe
transcribed RNA itself
orprotein
translated
fromthis RNA.
Quantitation
ofeither
canbe achieved after resolution
by
poly-acrylamide
gel
electrophoresis.
Inthe first paper of this series
(2),
weapplied
this method
toanalysis
of in vivotranscription
oftheearly and
lateregions
ofphage
T7by
E. coli RNApolymerase.
Analysis
of the relative rates of gene-specificprotein
synthesis
versusUV
dosetothephage
wasutilizedtodeterminethe distance
of aparticular
gene from its promotor. We showed that in vivo theearly
region of T7istranscribed
fromasingle
promo-torlocatedatthe leftend of the genome(2).
Weassumed
proportionality
between the rate ofgene-specific
protein
synthesis
and the totalnumber
ofcopies
ofanygiven
geneavailable for
transcription
inthe infected
culture.
It wasargued that the results verified
allassumptions
which wereimplicit
inthe
assaymethods.
Because
weused
bacteria which
weremultiply
infected
by T7, the assumption of
proportional-ity ofnumber
ofactive genecopies
and
rate ofgene-specific protein
synthesis
wasnontrivial.
Identification
by
genenumber and
map posi-tion ofthe
mature,early
T7mRNAs
by
Sum-mers etal.
(22) allowed
us toreinvestigate the
mode
of in vivotranscription
ofthe
early
region
ofT7
by assaying
forthetranscription
products
themselves.
The
matureT7 mRNA's
arepro-duced
by
cleavage
ofthe
2.2 x 10⁶molecular
weight transcript
by RNase
III(4,
5).
Wereconfirm that there
isonly
one promotoruti-lized
inthe
in vivotranscription
ofthe
T7early
genesand
that,
even in aculture
ofmultiply
infected
cells,
there
is strictproportionality
between the number
ofDNA
copies
ofa particu-largene lostby
UVirradiation,
the reductionin the amount of RNAsynthesized
from these DNAcopies in agiventime,
and the amount of protein synthesized from this RNA within the sametimeperiod.
MATERIALS AND METHODS
Bacteriophageandbacterial strains. The
bacte-rial host uised in all experimentswas E. coli
B,1;
T7 am342 wasgenerouslyprovidedbyF.W.Studier(21).Am342 is anambermutantingene 1, theearlygene
codingfor T7 RNApolymerase.Itproducesaslightly shortened, nonfunctionalT7 RNApolymerase.
1110
on November 10, 2019 by guest
http://jvi.asm.org/
TRANSCRIPTION UNIT MAPPING IN PHAGET7
Bacteriophage lysates were prepared in M9 me-dium (1), using E. coli011' (su+) asthe host. Phage wereconcentratedby centrifugation and resuspended in M9 buffer.
Conditions ofinfection and labeling. E. coliB,sX was grown at 37C toa density of approximately 5 x 10⁸cells per mlinM9medium,whereupon 15 ml was irradiated with UVlight (254 nm)at anincident dose of 5,800erg/mm2,afterwhich the cellswereincubated foranadditional 5-min periodat37C. UV irradiation and allsubsequent operationswerecarriedoutindim yellow light to avoid photoreactivation. To 2-ml samples was added 2 x 10¹⁰ T7 am342phage which had been UV-irradiated at various doses. After a 1-min adsorption period, 5,6-[3H]uridine (Schwarz/ Mann; specific activity, 42 Ci/mmol was added to eachsample ofphage-infected cellsto afinal
concen-tration of 20 uCi/ml. After a 5-min labeling period, infected complexes were chilled, pelleted, washed once withcoldM9 buffer, and resuspendedin 0.4ml of3mMEDTA containing1%sodiumdodecyl sulfate and10%sucrose.Infected complexeswerethen lysed by heatingto 85C for2min.
UV irradiation of bacteriophage. A T7 am342 phage stock was diluted to a concentration of 101" phage/ml in M9 buffer, and a 4-ml volume was UV-irradiated with incident doses of 0, 40, 80, 160, and 320erg/mm2.
Gelelectrophoresis of RNA. The
lysed
3H-labeled samples frominfected complexes were loaded directlyonto 2.6% polyacrylamide disc gels (final concentra-tions were 2.6% acrylamide and 0.12% N,N'-methylene-bis-acrylamide prior to polymerization) containing no agarose. The procedure is that of Loening (11), except that plasticgel tubes, 8 mm in
diameter and 60 mm long, were substituted for the smallerglassones. Samples of50Mliters wereloaded
ontoeachgel and electrophoresed for 7 h at 70V(10 to
11mA/gel). Gels were sliced (1 mm) and digested at
50C in 0.5 ml of 30% H202 containing 1% concen-trated NH4OH.Thereafter, 10mlofKinard's scintil-lator (9) were added, and the slices were counted by liquid scintillation spectroscopy. RNA bands were identified from molecular weights given by Simon and Studier (19), by using mouse L cell 28S and 18S ribosomal RNA and E. coli 23S and 16S ribosomal RNAasinternal markers. The electrophoretic mobil-ityasmeasured on ourgels, whenplottedversus log-arithm of molecular weight, yields a single straight line for the fourT7 early RNA species and the four markers. Relative amounts of RNA were calculated
fromgel peaks by summing the 3Hcountsper minute contained in the peak (after appropriatebackground correction).
RESULTS
Effect of
UVirradiation
of T7 on early region RNA synthesis in vivo. In order to test in vivofor the sensitivity of gene-specific RNA production as a function of distance betweenthe
gene and itspromotor, we performed experi-ments ofthe following type. Samples of E. coliB0.1,
in which bacterial RNAsynthesis
wasgreatly
reducedby
UV irradiation prior
toinfection,
wereinfected with T7 am342 which
hadbeen
UV-irradiated
at aseries of
increasing
doses. RNAwaspulse-labeled with [3H ]uridine,and then isolated and
electrophoresed
on2.6%
polyacrylamide gels.
Typical gel electrophoresis
patterns
of RNAfor several UV doses are shown inFig.
1. Inlooking
atthese
patterns,it is
obvious that overall RNA
synthesis
decreases
with
increasing UV irradiation of the
phage;
however,
it isalso clear that the
rateof decline
ofRNA
synthesis with dose is
vastly different
from oneRNA
species
toanother. RNA
tran-scribed
from gene1.3, for
example, falls rapidly
with increasing UVdose, this
peak having
completely disappeared by
320erg/mm2,
whereas
that
from gene 0.7shows much less
sensitivity,
in spite of the similar size of these twoRNA
species.
Distonce from Origin
0
10 07 13 03 &t1 G Gene Number
FIG. 1. Polyacrylamide gel electrophoresis
pat-terns of T7early RNA from am342-infected E. coli
B,-,.
Infectingphage had been irradiatedat incidentUV doses of0, 160, and320erg/mm2 (seerighthand side of Fig.). RNAs were labeled with [3H]uridine present at 20
giCi/ml
final concentration in the medium (M-9) from 1 minto 6 min after infection. Directionof electrophoresisisfromlefttoright.RNAsare identified by gene number (bottom of figure); peak G is supposedly the larger of the two guanine triphosphate-initiated cleavageproducts transcribed from the beginning of the genome. The molecular weightsoftheT7early messengerRNAs are:gene 0.3, 208,000; gene 0.7, 598,000; gene 1, 975,000; gene 1.1, 208,000; and gene 1.3, 403,000(Table4of ref. 19). The ordinategives the 3Hcounts per minute in thegel fractions. Host RNA synthesis was reduced by UV irradiation prior to infection, and RNA from unin-fected bacteriashows aflat distribution of radioactiv-itynotexceeding 100 counts per minute (not shown).
VOL.13,1974
1111
on November 10, 2019 by guest
http://jvi.asm.org/
[image:2.494.244.434.284.461.2]BRAUTIGAM
A DSAUERBIERWhen
the amount of each RNA species as a [image:3.494.66.258.262.518.2]function
ofUVdose
wasquantitated
from suchgels, the
pattern, as shown in Fig. 2, ofdiffer-ential
reduction
ofearly
region RNA synthesis wasobtained
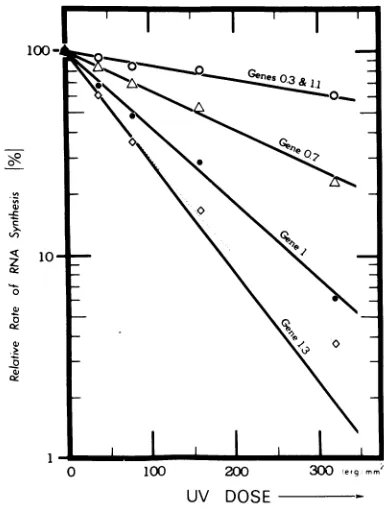
(Fig. 2). The curves are seen tofollow
simple
exponential
kinetics (seeDis-cussion).
If each gene were transcribed as a separate transcription unit, target theory would predict UVsensitivities
for each speciespro-portional
to gene size. Thiswould
imply that RNAproduction
from gene 1.0 should beap-proximately
three times more sensitive than that from gene 1.3; however, in actuality, it is gene 13transcription
which
is more sensitive (Fig. 2).Transcription map of the early region of T7
as
assayed
by direct quantitation of RNA.
Gees&
lo~~~~~~~~~~~~~~~~~~~~~~~~~~~~~~~~~~~~~~~~~
<^otl~~~~~~~~~~~~~~..
z~~~~~
0~~~~
0~~~~
0 100 200 300 lerg mm
UV DOSE
FIG. 2. Relativeratesofsynthesis of earlyT7 RNA species in
am342-infected
E. coliB,,
as afunction of
incident UV dose received by the phage prior toinfection. Points of the graph were obtained
by
calculating the relativeamountsof3HRNA, synthe-sizedduringa4-minpulse,
inpolyacrylamide
discgel
patterns such as the ones shown in
Fig.
1. TheabscissagivestheUV doseto theextracellular
phage;
theordinategives thenormalizedrateof synthesis
of
several early RNAs. Uppermost curve represents a composite of two
coelectrophoresing
RNAspecies.
Dashed line is the curve through theexperimental
pointsforthe RNA ofgene1.3; solid line shownfor
this RNA species represents the actual
exponential
decay ofthis RNA aftercorrecting
theexperimental
points (seeAppendixandFig.6).
Symbols: 0,
genes 0.3 + 1.1; A, gene 0.7;0,
gene1; 0 ,gene 1.3.The
exponential slope of theUV-inactivation
curve,K,
maybe
evaluated
fromFig.
2 foreach
RNA
speciesand these K
values
plotted
versusthe
physical
map.The
result (Fig.
3) is seen to againyield
astraight
line ofslope
similar tothat
found
previously
(2) when UVsensitivities
weredetermined
by measuringgene-specific
protein
synthesis. This implies the existence
of asingle
large transcriptionunit
forthe
early region ofT7,
with the
possible
exception that gene 0.3could
betranscribed
separately
(see ref. 2).DISCUSSION
Shapes of dose-effect
curves. When UV-irradiated DNA is transcribed by an RNApolymerase,
theprobability oftranscription
of a genewhich terminates
at length x' from the promotor is given by e-Kd,
where K is theexponential slope
oftheWTV-inactivation
curve and isproportional
to x', and d is the UV dose. Due to theaccumulation
ofshorter-length
RNAfragments with
increasing dose (see Appendix),this
simple exponential dependence
is notex-perimentally observable;
the curves expected areshown
in Fig. 6. The only RNA band whichwould
be appreciably
affected by thisaccumu-lation
ofRNA
fragments is thatcorresponding
to gene 1.3.The experimental
data shown inFig.
2 confirmthese
predictions.
Curves aresimple exponentials,
except that the pointscorresponding
tothe rate ofsynthesis
ofgene 1.3mRNA
describe
agradually
upward curvingline.
Cleavage by RNase III
of partial length
transcripts. The f'ull-length transcript of the
T7early
region iscleaved by RNase
III toyieldthe
matureearly
mRNAs (4, 5).It
isassumed
inthe consideration given
inthe
Appendix
thatRNA molecules need
notbe
full-length
tran-scripts
ofthe entire
early region
inorder
tobe
cleaved
by
RNaseIII.
This
assumption
iscer-tainly
correct,because the
UV sensitivity
ofproduction
ofall
T7early
RNA species shown
inFig.
2would have
tobe the
same,and the
curves would all have theexponential
slope found for gene 1.3, ifonly
full-length transcripts
could becleaved.
Therealso
is no indication in ourexperiments
(Fig. 2)
that therateofcleavage
isreduced.
Such an effect would have led to"shouldered"
dose-effect
curves.Comparative
evaluation of
genesurvival
using
protein
assays(2)
and
RNA assays.Comparison
of the presentresults
with thecorresponding
resultsobtained
fromanalysis
ofthe
differential
reduction ofindividual
early
gene
protein
synthesis
caused
by
UV irradiation ofT7(Fig.
1 of ref.2)
shows that theresults
obtained
by using
the two different assays are1112 J.VIROL.
on November 10, 2019 by guest
http://jvi.asm.org/
TRANSCRIPTION UNIr IAPPING IN PHAGE T7
very
similar. The relative order of UV
sensitiv-ity of
the
early
genesis the
sameby both
assays,and
curvesfor
genes0.7,
1.0, and 1.3
arenearly
identical, whereas that
forRNA
of genes 0.3 + 1.1 issomewhat
steeperthan the
curveobtained
by analysis of protein
of gene0.3,
aswould be
expected because this
curve represents acom-posite of
the
slopes
oftwoRNA
species
which
coelectrophorese.
In
comparing these
two setsofdata,
itshould
be
kept
inmind that conditions of host
irradia-tion
and label
period
were notidentical,
and the
pool kinetics for
the
twotypes oflabeled
precur-sors are
probably
different.
Nonetheless,
the
two
different
experimental
assaysyield
the
sameresults
(cf. Fig.
1of ref.
2with
Fig.
2ofthis
paper).The
transcriptional
mapof the T7
early
genes.
Values
forthe
exponential
slope,
K,
defined
as(lld)
ln(R0/R)
may be calculated foreach RNA
species
from the data ofFig.
2.Ro
representsthe
amountofRNA
synthesized
from
nonirradiated, and R
fromUV-irradiated
tem-plates
atdose
d.
According
totheory (see
Appendix),
aplot
of
these
slopes
versusthe
location of the
respective
genes onthe
physical
mapshould be linear for
any groupof
genestranscribed
fromthe
samepromotor,
with
inter-cept at or nearK
=0.
Figure
3shows
aplot
of
the K values determined from
Fig.
2 versusthe
physical
mapof
the
early
region of T7.
A
linear
relationship
is
seen to occur andnonspecific
depression
ofRNA
synthesis
by
UV
light
appears tobe
minor.Comparison of Fig.
3with the
analogous
graph obtained
by
analysis
of
the differential effect of UV irradiation
ofT7
onprotein
synthesis
(Fig.
2of ref.2) reveals that
the
twoarequite
similar. The
slope
ofthis line
corresponds
to onechain-terminating
hit per 1,000base pairs
per 630erg/mm2
forthe RNA
assay,whereas the
value found
forthe
protein
assay is1/1,000/560. Thus,
there
isgood
agree-mentbetween the
two assaymethods, the
difference
being
within
experimental
error.The
conclusion drawn from
Fig.
3 isthat the
early
region
ofT7
istranscribed
in vivo as asingle
large unit,
atleast under the experimental
conditions used here.
Proportionality
of number of gene
copies,
amount
of
mRNA,
and
amountof
gene prod-uct.Our assay for the reduction of synthesis ofgene-specific
RNA,
orgene-specificproteins
in alarge population
ofmultiply
infectedcells,
reveals
pseudofirst-order
loss ofgene expression as a function of UVdose
to theextracellular
phage.
We must, therefore, conclude thatwhenever transcription
of a gene is blocked on any of the multiple DNA copies per cell, theresult
is a reduction in synthesis of thecorre-I I I I I I I I
0 1000 3000 5000 7000 BasePoirs
FIG. 3. UV sensitivity of production of T7 early RNA species versus physical map positions ofearly RNAs (22, 5). The exponential slope for each RNA wascalculated from the data of Fig. 2 by using the equation K = (In R0/R)/d where R0 = rate of RNA synthesis at zero UV dose and R = rate of RNA synthesis atUV dose d. Because the uppermostcurve inFig. 2 corresponds to the sum of the RNA produced from genes 0.3 and 1.1, it is characteristic of the relative molar amounts of each. For a transcription unitof length L = 7,600 base pairs, a transcription rate of 50base pairs traversed per second, and a5-min labeling period, a simple calculation shows that (assuming stable RNA) there will be about twice as many RNA copies of gene 0.3 as of gene 1.1. The K value shownabove at the position of gene 0.3 has been obtainedfrom the uppermost curve of Fig. 2 by using this correction factor.
sponding RNA and protein. Thus, templates
for eithertranscription
ortranslation are utilized at randomwithin
thecell, and
measurements ofeither
process representthe differential loss
offunctional
genes onthe DNA
template.
There
is nocompensatory
mechanism either
onthe
tran-scriptional
orthe
translational level
to restorenormal
expression ofthose
genes,the
transcrip-tion
ofwhich had been blocked
on afraction
ofthe
co-infecting
genomes.The above considerations
areapplicable
to allearly
T7
genes.They
arealso
applicable
tomostT4 genes
(6),
except forthose which
are self-regulatory (16) or regulated by other T4 prod-ucts.Transcription mapping
ofself-regulatory
genes is facilitatedby
single infection. Of mostimportance
for application to systems where proteinshave
been mapped but RNA tran-scriptshave
not, is theagreement
found be-tween protein andRNA
assays.Comparison
withprevious
data on earlyregion transcription.
Our finding of a single1113
VOL.13,1974on November 10, 2019 by guest
http://jvi.asm.org/
[image:4.494.245.437.68.253.2]BRAUTIGAM
ANDSAUERBIER early transcription unit agrees with results ofothers. Milette et al. (14) found that a 2.2 x 10⁶ molecular weight RNA was transcribed from T7 DNA in vitro
by using highly purified
E.coli
RNA polymerase. Analysis by electron microscopy of the in vitro transcription com-plexby
Davisand
Hyman (3)revealed
a spe-cific initiation site for E. colipolymerase
nearthe left end
ofthe DNA, and
asimilar
conclu-sion is inferred fromthe observations
ofSchweiger
et al. on thesequential synthesis
ofearly
T7 proteins in vitro (18). Marrs andYanofsky
(12)argued
fromthe
time course ofearly transcription
that asingle
unit of about 6,000base
pairs must be present.Our result is also in
complete
agreement withthe
recentfindings
ofDunn and
Studier (5),
who haveshown that
RNase IIIcleaves the
in vitroearly region transcript
ofT7 DNA at fivespecific
sites toyield RNA species
which areessentially the
same asthose
observed
in vivo. Inaddition
(4),they studied
T7transcription
in vivoby
an RNaseIII-deficient
strain ofE. coli
(8).
In thisstrain,
2.2 x 10⁶ molecularweight
RNA
wasproduced
and cleaved
atthesamefivesites
by RNase
III in vitro.Our results
appeartoconflict, however,
withthose
ofMinkley and Pribnow (15),
whostudied
T7transcription
stimulated
by
dinucleotides
orindividual
purinetriphosphates
inthe
presence of a 17:1 ratio ofE.coli
polymerase
toDNA. Inthese
reactions, the
stimulating
nucleotide
was present at an excess of10- to200-fold
overotherribonucleoside
triphosphates, which
werekept
low (5
mM)
toinhibit
spontaneousinitiation.
They found that
initiationsoccurred
notonly
atthe
three sitescontained
inthe
early
promotor,but also
nearthe
beginning
of genes0.7,
1.0,
and 1.3,and
even at one siteoutside the
early
region.
Multiple binding
sites forE.
coli
po-lymerase
onT7
DNAhave been
reported
(7,
10,
20), and their
presence seems todepend
uponthe conditions
used. The
experimental
condi-tionsselected
by
Minkley
and
Pribnow
(15)
do notnecessarily reflect intracellular
conditions,
and theirconclusions are notnecessarily
appli-cable to in vivotranscriptions.
Recently, Young
and Smith(23)
haveana-lyzed
the end groups ofearly
T7 mRNAtran-scribed
in vivo andfind,
in addition to the knownearly
promotor,only
one othertriphos-phate-containing
species;
this is ofasizewhichimplies
an initiation site before gene1.0.They
fail to show theidentity
oftheir RNApeaks
onthe
gels
and to find adenosine triphosphate-labeled termini. More data areneeded
tocor-rectly interpret
their results.APPENDIX
Analysis of transcription of polycistronic RNA from UV-irradiated DNA templates. When DNA has been irradiated with
UV
light prior to transcrip-tion, premature termination of transcription at the site of UV lesions and release of the RNA polymerase occurs without reinitiation beyond the photoproduct (17). Such UV photoproducts can be formed at a large but finite number of discrete photosensitive sites (e.g., base pairs or intrastrand pyrimidine neighbors), andtheir distribution is assumed to be random. For irradiation of a large number of DNA molecules containing anidentical transcription unit of length L, the probability of transcription of a gene whose promotor distal terminus is at length x' from the promotorisgiven by the term0th,
of the Poisson dis-tribution. This may be written e-6x L where A is the UV dose in RNA chain-terminating hits per transcription unit of length L (or equivalently, the mean of the Poisson distribution). This is the prob-ability of the event that no RNA chain-terminating hit has occurred within the DNA segment beginningat the promotor and terminating at length x'. Thus, the number of transcripts of a specific gene decreases exponentially with UV dose. This implies that the exponential slopes, K, of UV-inactivation curves for a set of genes, transcribed by an RNA polymerase starting from the same promotor, will yield a straight line when plotted versus the physical map of the genomewhich will intercept at K= 0at the origin of
transcription (i.e., promotor or initiation site). The slope of these lines for different transcription units will be the same, provided that the composition of the DNA is invariant and that the units are all tran-scribed by the same polymerase or by polymerases which respond to UV lesions in an identical manner. Furthermore, we have to consider the possibility that the presence of UV-irradiated phage DNA might lead to a dose-dependent lowering of the rate of overall RNA synthesis, apart from the premature
termination of transcription considered above. We represent this effect by the term e-Cu, where C is a
constant. Theexperimentally measured relative fre-quency oftranscriptsof ageneterminatingatlength
x' from its promotorwould be lowerby this factor at anyUV dose M and would become
e-Ix'ILe-Cu = e- (X'/L}+C
The resultofthis isthat theplotofexponential slope
versusphysical mapwill stillbe linearand willbeof
thesameslope; however,theinterceptofthisline at
the originoftranscriptionwillbeatC andnot atK= 0.
Frequency distribution of truncated RNA mole-culesas afunction oflength.Wedefinethe
distribu-tion funcdistribu-tion
f,(x)
asthe relativefrequency ofRNA transcripts whichareoflengthx.ThetemplateDNAfrom which such a molecule was transcribed, there-fore,had aUVphotoproductatsitex+ 1, butnonein
the region from the promotor up to this site. This distribution function is readily derived from the frequency oftranscripts which are oflength x' (i.e.,
1114 J. VIROL.
on November 10, 2019 by guest
http://jvi.asm.org/
TRANSCRIPTIONUNITMAPPING IN PHAGE T7
the probability oftranscription through all RNAmoleculesoflengthx'orlonger complete RNA message up to x', the frac RNA molecules plus the fraction of con transcripts (from unhit genomes) give frequency of transcripts that contain the to x'. When x' is at the promotor distal er the frequency of transcripts through x' probability of transcription of this part The frequency of transcripts oflength x' but not including those of full length L, i
EZ
XfM(x)
= eux Le-Because the number of photosensitive sil assumed to bereasonably large, i.e., at ] hundred, this sum may be replaced by yieldingfr
fj(x)
dx =e-x
'/L
-e-Because theintegral is unique within a c
fS(x) =
- (e/ gxL
_e-M)
= (g/L)e-ux/Ldx
This is the UV-induced frequency dis truncated RNA molecules as a function c
UV-dependent
distribution of labeled cules in polyacrylamide gel electroph length distribution function f,(x) gives frequency of RNA transcripts of length from unidirectional transcription of U DNA.However,analysis ofpolyacrylamic the number ofdisintegrationsper minute radioactively labeled RNA bands. Assum composition ofRNA, the number of dis per minute should be proportional to F and theelectrophoretic mobility should thelogarithm of the molecular weight.Consequently, the gel distribution o RNA molecules arising from transcript promotor at one end ofUV-irradiated (d scription units of length L is represented
x f,(x) versusln(x).
This is shown in Fig. 4 for M = 0.5, 1, 2 (these values for g were chosen to corres UV doses used experimentally). The I distributionisgiven by(d/dx)x
.f(x)
=atposition x =
L/,u.
The relative amount of RNA represen curve isgiven
by
1lL
fOL
x f,(x) dx andequals1/y
(1 -e- -Me-). For4largerelative amount of RNA contained in resolves to1/uto 1%accuracy. This perm nation ofLfrom thedecline in RNA prod dose.
The consequence of the above is that tion ofDNA atdoses of M = 1or larger c transcription, a broad peak of
premi
x). Because minated RNA molecules to appear on the gel at containthe position
ln(L/I).
For g larger than 1.25, the fraction tion ofsuch of RNArepresented
by this peak becomes larger than nplete RNA that contained in thepeak of full-length RNA mole-s the total cules at position ln(L) on the gel. (The fraction of message up RNA moleculescorresponding to unhit genomes isnotnd of agene, plotted in Fig. 4.)
equals the Frequencydistribution of RNAfragments after ;icular gene. cleavage by RNase III. Let us consider now the andlarger, particular case ofearly region transcription of UV-isgiven by irradiated T7 DNA. Transcription from a single promotor region at the left end of the genome is assumedto befollowed by cleavage by RNase III of
tes
has been the2.2x106
molecularweight transcripts.
We furtherleast several assumethat such
cleavage
iscomplete
andcanoccuran integral on
partial-length
transcripts,
and that all RNAspe-cies are stable. Because this cleavage occurs only at
specific intergenic sites, it would yield equimolar amountsof eachT7early RNA species in the absence ofirradiation. However, at UV dose Anot all of the
sonstant
early region transcripts will be full-length, and the prematurely terminated ones will be distributed ac-cordingtolength(Fig. 4) with L equal to the length of the T7early region. Intergenic cleavage of each RNA (0 < x < L) molecule of this distribution will lead to one RNA corresponding to each of those genes whose transcrip-tribution ofDflength. 04
RNA mole-oresis. The
the relative 03
ix
resulting
~V-irradiated
legelsyields
x.fwLxi
02occurringin 2
ling uniform
o1
,integrationsINA length,
be given by 0 . 0 0
0 02L OOS5L OI1L 02L 05L l
if truncated RNA Transcript Length x
lion
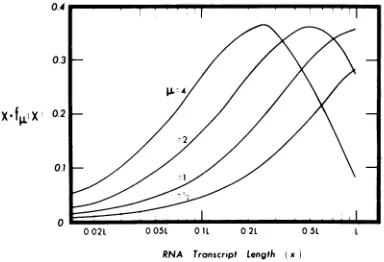
from a FIG. 4. Distributionof
RNA as afunction of
tran-osea)
tran-script
length (x)atfourrepresentativeUV
doses. The full length ofthe polycistronic transcription unit is!and
4hits;
represented
by
L(abscissa).
This distributionfunc-pond
tothe
tion has beenplotted
inamannercharacteristicof
thepeak
of
the way in which RNA is known toelectrophorese
oneand
occurs
polyacrylamide
gels.
UV dose isrepresented
byA,themean
of
the Poissondistribution,
and curves areted by this shown
for
dosesof
0.5, 1,2,
and4chain-terminating
hits per
length
L. These dosescorrespond
to thoseusedexperimentally, with L = lengthof the T7 early region.Fraction of transcripts from unhit genomes is represented by the term e- (not shown). Ordinateis erthan 7the representative of the absolute amount of RNA and is
this peak shown for the T7 early region, assuming L = 7,000 its determi- nucleotides. Thus, conversion of the ordinate to a luction with scale representative of fractional amount of initial RNA atzerodose requires division by 7,000. Because UV irradia- the fraction offull-length transcripts decreases rap-auses, upon idly with dose (e-), the curves represent a rapidly aturely ter- increasing relative amount of RNA with dose.
VOL.13,1974 1115
on November 10, 2019 by guest
http://jvi.asm.org/
[image:6.494.244.436.326.457.2]BRAUTIGAM
ANDSAUERBIERtionhad been completedwithintheuncleaved
mole-cule. In addition, there will result one abnormal
length segment of RNA corresponding to only the promotorproximalpartofthenextgeneinthe series,
and this short segmentis defined as anRNA
"frag-RNA Fragment Length (I)
3000 2000 1000 500 200 100Bases
I0I
01
GENE GENE GENE GENES GENE NUMBER
[image:7.494.66.253.136.353.2]1.0 0.7 1.3 0.3 &1.1
FIG. 5. Distribution of RNA fragments resulting
from intergenic cleavage of the distribution of T7
early region transcripts (Fig. 4) by RNase III. The abscissa represent l, the RNA fragment length in bases; the ordinate is characteristic of the absolute
amountofRNA and isthesame asinFig. 4. The four
setsofcurvescorrespond (from topto bottom)toA =
0.5, 1, 2, and 4 hitsonthetranscription unit of length L,whereuisthemeanofthePoissondistribution.An RNA "fragment" is defined as that most promotor distal segment of RNA resulting from intergenic
cleavageoftheUV-truncated early region transcripts.
Sitesforcleavagewereassumedtobebetweeneachof
the known T7earlygenes.Lengths corresponding to eachoftheearly RNAspeciesareshownatthe bottom
ofthefigure.Heavy black barsrepresentapproximate
bandwidths forgel electrophoresis ofearly RNA and were derived from Fig. 1. Those fragments whose
length issuch that they are within the band width
would beexpectedtocontribute extraneous RNA to
experimentalearly RNAgelpatterns,assuming them tobeasstableas theearly RNAspeciesthemselves. Curves haveagainbeenplottedinamanner charac-teristic ofexperimental gel patterns and areshown
after subtraction ofa background chosen to
corre-spondapproximatelywith thebackgroundcorrections used for experimental data. The ordinate has a
different meaningateachdose, because it represents with increasing dose a largerrelativefraction ofthe
transcripts of any given gene. This effect is most
pronounced forRNA transcribed fromthemost
pro-motordistalgene, gene1.3,transcription ofwhichhas
droppedtoe 4,or1.83%ofitsinitial value by = 4
(seeFig.6).
ment" (each moleculerepresentedby thedistribution
f,(x)
givesrisetoonlyonefragmentafter cleavage).The function
F0(b)
may now be defined as the frequency distribution of RNA fragments whichre-sults when cleavage by RNase III is applied to the
frequency distribution ofRNA transcripts, f,(x). In
the special case inwhich L isthe length ofthe T7
earlyregionandRNA cleavageoccursbetween eachof
the fiveknown earlygenes,
F,(
I) shouldbecharacter-istic ofthe fragmentdistribution fortranscription of
UV-irradiated T7 by E. coli RNA polymerase. The distribution F,0(t) for the early region of T7 in the absenceofdiffusion is shown afterbackground
correc-tion in Fig. 5. Ithas been plottedversus ln(l) rather
than l, in order to becharacteristic of the expected polyacrylamide gel electrophoresis pattern. It isseen
that spikes appear at the location of each gene.
Experimentally determinedbandwidths fortheRNA
ofeachgene,derived from Fig.1, arealso shown. The
amount ofRNA contained within the bandwidth in
each spike can be determined and calculated as a
ratio ofthe amount ofnormal length RNA expected
I.0 I
CL
us
c
0
z
c
0~
> :
0)
U-0
0.1
0.01
Mean Number of Hits per Genome
(4L)
FIG. 6. Effect of the extraneous RNA fragments contained within the bandwidths of each RNA
species (Fig. 5) on the (theoretical) UW-inactivation
curves.Theabscissa representsUVdose in
chain-ter-minating hits, andtheordinaterepresentsthe
proba-bility of transcription of each individualgene. Solid lines are the simple exponential UW-inactivation
curvesexpectedfrom theoryinthe absenceof
extrane-ousRNA; dashedcurvesshow thealteration induced
bytheconsideration oftheappearanceofpartialgene
lengthcleavageproducts (fragments)atgelpositions occupied byearlyRNAspecies.
1116
J.VIROL.on November 10, 2019 by guest
http://jvi.asm.org/
[image:7.494.274.461.289.552.2]TRANSCRIPTIONUNIT MAPPING IN PHAGE T7
ateach position by theoryatthat UV dose. This will
beextraneousRNA whichwillraise eachpointofthe
(formerly) exponential UV-inactivation curves
slightly. This effect will begreater forpoints
corre-spondingtohigher doses and fortranscriptionof those genes most promotordistal. The predicted effect is shown in Fig. 6, where the solid line for each RNA
speciesis thesimple exponentialcurveexpectedfrom
the theory and the broken line is the alteration
in-ducedby the presenceofRNAfragments. The
inclu-sion ofthe effect of diffusionofthefragments inthe
gelwould be complex and would notalter thisfigure significantly.
ACKNOWLEDGMENTS
This investigation was supported by National Science Foundation grant no. GB-38085 andbyPublic Health Service training grantno.GM-00781 from the National Institute of General MedicalSciencestotheDepartmentofBiophysics
and Genetics (no. 580), University of Colorado Medical Center,Denver.
LITERATURE CITED
1. Anderson, E. H. 1946. Growth requirements of virus-resistant mutants ofEscherichiacolistrain"B."Proc. Nat.Acad. Sci. U.S.A. 32:120-128.
2. Brautigam, A.R.,and W.Sauerbier, 1973.Transcription unitmapping inbacteriophageT7. I. In vivo transcrip-tion by Escherichia coli RNA polymerase. J. Virol. 12:882-886.
3. Davis,R.W.,and R. W.Hyman.1970.Physicallocations of the invitro RNA initiation site and termination sites of T7M DNA.ColdSpringHarborSymp. Quant.Biol. 35:269-282.
4. Dunn, J.J.,and F. W.Studier. 1973. T7earlyRNAsand E. coli ribosomal RNAs arecut fromlarge precursor RNAs in vivo by RNase III. Proc. Nat. Acad. Sci. U.S.A.70:3296-3300.
5. Dunn,J.J.,and F. W.Studier.1973.T7earlyRNAs are generatedbysitespecificcleavages.Proc. Nat. Acad. Sci.U.S.A. 70:1559-1563.
6. Hercules, K., and W. Sauerbier. 1973. Transcription units inbacteriophageT4. J. Virol.12:872-881. 7. Hinkle, D. C., and M. J. Chamberlin. 1972. Studiesof
bindingofEscherichiacoli RNApolymerasetoDNA.I. The role ofsigmasubunitinsiteselection.J. Mol. Biol.
70:157-185.
8. Keil, T. U., and P. H.Hofschneider. 1973. Secondary
structureof RNAphageM12replicative intermediates invivo. Biochim.Biophys.Acta312:297-310. 9. Kinard,F. E. 1957.Liquid scintillator for the analysis of
tritium inwater.Rev. Sci. Instrum.28:293-294. 10. LeTalaer, J. Y.,M. Kermici, andPh. Jeanteur. 1973.
Isolation of Escherichia coli RNApolymerasebinding
sitesonT5 and T7DNA: further evidence for sigma-dependent recognition of A-T rich DNA sequences. Proc.Nat.Acad. U.S.A. 70:2911-2915.
11. Loening,U.E. 1967. Thefractionation ofhigh molecular weight ribonucleic acid bypolyacrylamide gel electro-phoresis. Biochem. J. 102:251-257.
12. Marrs,B.L.,andC.Yanofsky.1971. Host and bacterio-phage specific messenger RNA degradation in T7-infected E. coli. Nature N. Biol.234:168-170. 13. Michalke, H.,and H. Bremer. 1969. RNA synthesis in
-Escherichia coli after irradiation with ultravioletlight. J. Mol. Biol. 41:1-23.
14. Millette, R. L., C. D. Trotter, P. Herrlich, and M. Schweiger. 1970. In vitrosynthesis, termination, and release of active messenger RNA. ColdSpring Harbor Symp.Quant. Biol. 35:135-142.
15. Minkley,E.G., and D.Pribnow. 1973. Transcription of theearly regionofbacteriophageT7: selective initia-tion withdinucleotides. J. Mol. Biol. 77:255-277. 16. Russel, M. 1973. Control of bacteriophage T4 DNA
polymerase synthesis. J. Mol. Biol.79:83-94. 17. Sauerbier, W., R. Millette, and P. B.Hackett, Jr. 1970.
The effects of UV irradiation on thetranscription of T4 DNA. Biochim.Biophys. Acta209:368-386.
18. Schweiger, M., P. Herrlich, and R. L. Millette. 1971. Gene expression in vitro from DNA ofbacteriophage T7. J. Biol. Chem. 246:6707-6712.
19. Simon, N. M., and F. W. Studier. 1973. Physical map-pingof theearly region of bacteriophage T7 DNA.J. Mol. Biol.79:249-265.
20. Stevens, A. 1969. Studies ofDNA-dependent RNA po-lymerase. J. Cell.Physiol.Suppl. 1 74:205-218. 21. Studier, F. W. 1969. The genetics and physiology of
bacteriophage T7. Virology 39:652-574.
22. Summers, W. C., I.Brunovskis,and R. W. Hyman. 1973. The process of infection withcoliphageT7.VII. Char-acterization and mapping of the major in vivo tran-scription products of the early region. J. Mol. Biol. 74:291-300.
23.Young, R. J., and G.Smith.1973. Theend groups of T7 mRNA.Biochem.Biophys.Res.Commun.53:952-959.
VOL.13,1974