Annals of Oncology22: 1726–1735, 2011 doi:10.1093/annonc/mdq633 Published online 20 January 2011
review
Advanced breast cancer incidence following
population-based mammographic screening
P. Autier
1*, M. Boniol
1, R. Middleton
2, J.-F. Dore´
3, C. He´ry
3, T. Zheng
4& A. Gavin
21
Department of Epidemiology and Biostatistics, International Prevention Research Institute (iPRI), Lyon, France;2
Direction and Data Department, Northern Ireland Cancer Registry (NICR), Queens University Belfast, Belfast, UK;3
Unit of Molecular Epidemiology, INSERM U 590, Lyon, France;4
Department of Epidemiology and Public Health, Yale University School of Medicine, New Haven, USA
Received 22 September 2010; accepted 24 September 2010
Background:Breast cancer mortality is declining in many Western countries. If mammography screening
contributed to decreases in mortality, then decreases in advanced breast cancer incidence should also be noticeable.
Patients and methods:We assessed incidence trends of advanced breast cancer in areas where mammography
screening is practiced for at least 7 years with 60% minimum participation and where population-based registration of advanced breast cancer existed. Through a systematic Medline search, we identified relevant published data for Australia, Italy, Norway, Switzerland, The Netherlands, UK and the USA. Data from cancer registries in Northern Ireland, Scotland, the USA (Surveillance, Epidemiology and End Results (SEER), and Connecticut), and Tasmania (Australia) were available for the study. Criterion for advanced cancer was the tumour size, and if not available, spread to regional/distant sites.
Results:Age-adjusted annual percent changes (APCs) were stable or increasing in ten areas (APCs of20.5% to
1.7%). In four areas (Firenze, the Netherlands, SEER and Connecticut) there were transient downward trends followed by increases back to pre-screening rates.
Conclusions:In areas with widespread sustained mammographic screening, trends in advanced breast cancer
incidence do not support a substantial role for screening in the decrease in mortality.
Key words:breast cancer, cancer registry, incidence, screening, stage
introduction
Since 1990, breast cancer mortality in women has fallen in many countries with populations of mainly European ancestry [1–3]. This improvement in mortality could be related to earlier detection of cancer with screening and the efficacy of treatments. Studies done so far have not been able to assess with precision how much of the mortality decrease was due to screening or to adjuvant therapy. For instance, a study that developed seven independent statistical models found that the contribution of screening to decreases in breast cancer mortality in the United States could range from 28% to 65% [4].
Mammographic screening aims to detect cancer at an earlier stage that would be less life threatening and easier to cure than if detected clinically. Diagnosis procedures are not influenced by subsequent treatments. Hence, a reduction of advanced cancer incidence should reflect the impact of screening activities alone, thus providing an estimate of the contribution of screening to the observed mortality decrease.
Longstanding broad consensus exists for considering a decrease in advanced breast cancer incidence as the best early indicator of the impact of screening [5–11]. Following this logic, in a previous work, we found that when all randomised trials of mammographic screening were considered, breast cancer mortality reductions were directly proportional to the fall in the incidence of advanced breast cancer [12].
In the United States, nationwide mammographic screening has been introduced in 1983 and screening coverage of women ‡40 years reached 50% in 1990 and 71% in 1997 [13]. In a recent report, using data from the Surveillance, Epidemiology and End Results (SEER) cancer registries, Esserman et al. [14] concluded that breast screening may increase the burden of low-risk cancers without significantly reducing the incidence of more aggressively growing tumours. In view of these unexpected conclusions, we performed a systematic review of published data on incidence trends of advanced breast cancer incidence in areas where
mammographic screening was in operation for‡7 years and where participation to screening was high. We could also make use of relevant data made available by several population-based cancer registries established in areas with high mammography screening coverage.
review
*Correspondence to: Dr P. Autier, International Prevention Research Institute (iPRI), Cours Lafayette 95, F-69006 Lyon Cedex 08, France. Tel:+33-472171183; Fax:+33-472171195; E-mail: philippe.autier@i-pri.fr
ªThe Author 2011. Published by Oxford University Press on behalf of the European Society for Medical Oncology.
This is an Open Access article distributed under the terms of the Creative Commons Attribution Non-Commercial License (http://creativecommons.org/licenses/by-nc/2.5), which permits unrestricted non-commercial use, distribution, and reproduction in any medium, provided the original work is properly cited.
at University of Strathclyde on October 10, 2013
http://annonc.oxfordjournals.org/
Downloaded from
at University of Strathclyde on October 10, 2013
http://annonc.oxfordjournals.org/
Downloaded from
at University of Strathclyde on October 10, 2013
http://annonc.oxfordjournals.org/
Downloaded from
at University of Strathclyde on October 10, 2013
http://annonc.oxfordjournals.org/
Downloaded from
at University of Strathclyde on October 10, 2013
http://annonc.oxfordjournals.org/
Downloaded from
at University of Strathclyde on October 10, 2013
http://annonc.oxfordjournals.org/
Downloaded from
at University of Strathclyde on October 10, 2013
http://annonc.oxfordjournals.org/
Downloaded from
at University of Strathclyde on October 10, 2013
http://annonc.oxfordjournals.org/
Downloaded from
at University of Strathclyde on October 10, 2013
http://annonc.oxfordjournals.org/
Downloaded from
at University of Strathclyde on October 10, 2013
http://annonc.oxfordjournals.org/
patients and methods
criteria for data or study selection
Data or studies were selected if they reported time trend of advanced invasive breast cancer incidence in the general population, outside the context of randomised trials or cohort studies. Further inclusion criteria were details on cancer size or on stage; incidence reported for at least 7 years after commencement of breast cancer screening and screening attendance in target group of‡60% per biennium (triennium in the UK) during at least the last 3–4 years of observation.
We excluded studies that reported size or stage as a percentage of total number of cancer cases, as this type of metric varies with the number of smaller tumours detected [14]. We also excluded studies that obtained results via application of mathematical models to cancer registry data.
search for published data on size- or stage-specific breast cancer incidence
The literature review was performed using Medline from January 1990 to June 2009. Algorithms incorporating keywords: ‘breast cancer’, ‘size’, ‘stage’, and ‘trends’ were used. We searched for keywords in the title and abstract, without language restrictions.
In addition, we performed a manual search of references cited in the selected articles, in related articles according to Medline and in International Agency for Research on Cancer library resources, e.g. the articles used for the Handbook on Breast Cancer Screening [7]. We also performed searches for publicly available reports from bodies in charge of screening programmes.
Data from peer-reviewed articles was supplemented with data from several population-based cancer registries whose data were published in Cancer in Five Continents volumes VIII and IX (www-dep.iarc.fr).
definition of advanced breast cancer
Breast cancer invasive component size was used as an indicator for advanced disease. The size for distinguishing early and advanced cancers was 20 mm as this threshold also distinguishes tumour classes T1 and T2 or above in both the tumour–node–metastasis (TNM) and American Joint Committee on Cancer manuals [15, 16].
If size was not available, data were examined by stage at diagnosis. Stage I cancers were considered as early, and stages II–IV as advanced since stage I breast cancers are equal or<20 mm and are without lymph node involvement or distant metastases. Several registries reported cancer as localised (cancer confined to the breast, including nipple and areola), regional (cancer invading surrounding tissues or
involving axillary or internal mammary lymph nodes) or distant (cancer involving infraclavicular, supraclavicular, cervical or other distant lymph nodes or systemic metastases) according to the Surveillance, Epidemiology and End Results (SEER) classification method [17]. We used the term ‘non-local’ cancer when we talked of both regional and distant cancers.
data extraction and analysis
This study concentrates on invasive breast cancer. When data were not reported in tables, we extracted incidence rates by digitising figures using the two-dimensional coordinate tool of the Acrobat software (Adobe Acrobat, version 7.1).
Statistical analyses were performed on age groups targeted for screening. However, incidence rates reported in publications sometimes covered larger age groups. For the nine oldest SEER areas and Connecticut, we took women aged 40–69 years, as screening in the United States is most frequent in this age range [18]. Studies often used different reference populations for age adjustment of incidence rates. Two studies on women aged 50–69 years
in Firenze (Italy) [19] and in Norway [20] did not report age adjustment, but because of the narrow age range studied, this is unlikely to have changed overall trends.
Log-linear regressions were fitted to estimate changes in age-adjusted incidence over time, from which we derived annual percent changes (APC) and 95% confidence intervals (95% CI) [21]. When incidence data were reported for years preceding screening, APC calculations included the 3 years before the presumed start year, but not earlier data. Rates for New South Wales were reported for 4 years only, 1986, 1988, 1992, and 1995 [22]. Therefore, before APC calculation, rates of a given year were interpolated to directly preceding and following years. In years where rates were still missing, the average of two closest years was computed. In Geneva (Switzerland), because rates by 5-year age blocks were reported, we took APCs computed by authors [23]. A trend was labelled significant if the 95% CI did not include 0.
results
study selection
We retrieved 590 articles published in peer-reviewed journals. Application of the selection criteria resulted in the retention of 35 studies. Twenty-seven were excluded for the following reasons:
1 They were earlier reports of SEER data USA [24–31], of the Connecticut Tumour Registry [32, 33], of Firenze (Italy) cancer registry [34, 35], and of pilot screening project in Norway [36];
2 Areas where screening was operational for<7 years or where reported data mainly concerned the prevalent screening round [37, 38];
3 Studies not based on population-based cancer registries or conducted in selected sub-groups (e.g. membership of a health insurance plan) or without appropriate denominator [39–49].
4 Studies with erratic variations in stage over time most probably reflecting changes in practice (e.g. sentinel node biopsy) [50].
Data of eight studies published in peer-reviewed journals displayed in Table 1 were used [8,19–23, 51, 58, 59], related to areas in Australia, Italy, The Netherlands, Norway, Switzerland, and the United States. For The Netherlands, we also retrieved a report and a congress abstract issued by the Dutch National Evaluation Team for Breast Cancer Screening that reported incidence rates of advanced cancer for more recent years [53, 60]. Data collected by the Tasmania Cancer Registry [52], the Northern Ireland Cancer Registry [54], the Scottish Cancer Registry [55], the nine oldest SEER areas [56], the National Cancer Institute’s Historical Connecticut Tumour Registry (part of the nine oldest SEER registries) [57] satisfied the eligibility criteria and were available for this study.
Screening coverage (proportion of the woman population for which screening is available) and participation (women regularly attending screening) have gradually increased in all areas, included in this study. In all areas, the percentage of eligible women participating in mammography screening was high, ranging from 60% in Firenze (Italy) to 88% in Rhode Island (USA). Details on screening activities in selected can be found in the additional material, available atAnnals of Oncology
Annals of Oncology
review
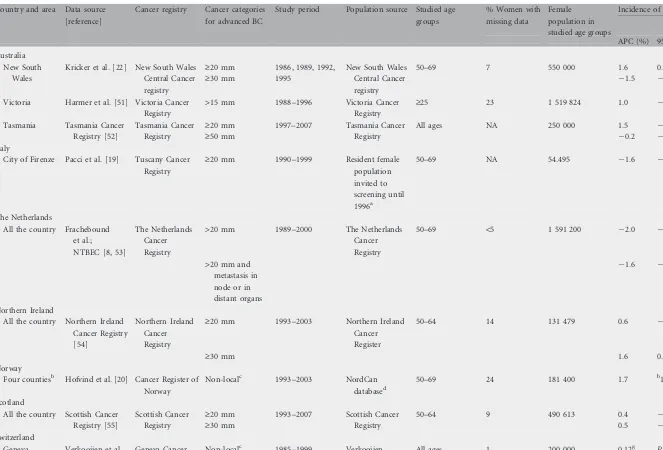
Table 1. Temporal trends in incidence of early and of advanced BC
Country and area Data source [reference]
Cancer registry Cancer categories for advanced BC
Study period Population source Studied age groups
% Women with missing data
Female population in studied age groups
Incidence of
APC (%) 95% CI
Australia New South
Wales
Kricker et al. [22] New South Wales Central Cancer registry
‡20 mm 1986, 1989, 1992,
1995
New South Wales Central Cancer registry
50–69 7 550 000 1.6 0.7–2.5
‡30 mm 21.5 22.4 to20.5
Victoria Harmer et al. [51] Victoria Cancer Registry
>15 mm 1988–1996 Victoria Cancer
Registry
‡25 23 1 519 824 1.0 20.1 to 2.0
Tasmania Tasmania Cancer
Registry [52]
Tasmania Cancer Registry
‡20 mm 1997–2007 Tasmania Cancer
Registry
All ages NA 250 000 1.5 20.3 to 3.4
‡50 mm 20.2 23.7 to 3.5
Italy
City of Firenze Pacci et al. [19] Tuscany Cancer Registry
‡20 mm 1990–1999 Resident female
population invited to screening until 1996a
50–69 NA 54.495 21.6 24.4 to 1.3
The Netherlands
All the country Frachebound et al.; NTBEC [8, 53]
The Netherlands Cancer Registry
>20 mm 1989–2000 The Netherlands
Cancer Registry
50–69 <5 1 591 200 22.0 22.7 to21.2
>20 mm and metastasis in node or in distant organs
21.6 22.3 to20.9
Northern Ireland
All the country Northern Ireland Cancer Registry [54]
Northern Ireland Cancer Registry
‡20 mm 1993–2003 Northern Ireland
Cancer Register
50–64 14 131 479 0.6 20.4 to 1.6
‡30 mm 1.6 0.1–3.2
Norway
Four countiesb Hofvind et al. [20] Cancer Register of Norway
Non-localc 1993–2003 NordCan
databased
50–69 24 181 400 1.7 b1.2–2.2
Scotland
All the country Scottish Cancer Registry [55]
Scottish Cancer Registry
‡20 mm 1993–2007 Scottish Cancer
Registry
50–64 9 490 613 0.4 20.6 to 1.6
‡30 mm 0.5 20.7 to 1.8
Switzerland
Geneva Verkooijen et al.
[23]
Geneva Cancer Registry
Non-localc 1985–1999 Verkooijen
et al. [23]
All ages 1 200 000 0.12g P=NS
review
Annals
of
Oncology
1728
|
Autier
et
al.
Volume
22
|
No.
8
|
August
Table 1. (Continued)
Country and area Data source [reference]
Cancer registry Cancer categories for advanced BC
Study period Population source Studied age groups
% Women with missing data
Female population in studied age groups
Incidence of
APC (%) 95% CI
United States of America Nine oldest
SEER areas
9 oldest SEER registries [56]
9 oldest SEER registriese
Non-localc 1980–2007 SEERf 40–69 4 6 134 000 20.4 20.6 to 0.1
Distant 0.1 20.2 to 0.3
Connecticut Connecticut
Tumour Registry (part of nine oldest SEER areas) [57]
Connecticut Tumour Registry (part of nine oldest SEER areas)
Non-localc 1980–2006 Connecticut
Tumour Registry
40–69 4 621 000 20.5 20.8 to 0.2
Distant 21.0 21.6 to20.5
New Mexico Escobedo et al. [58]
New Mexico Tumour Registry
Non-localc 1980–1997 SEER (f) All ages NA 901 033 20.3 20.7 to 0.1
Rhode Island Coburn et al. [59] Non-localc 1995–2001h Coburn et al. [59] ‡40 NAi 250 00 20.1 NA
APC, annual percents change in %; BC, breast cancer; 95% CI, 95% confidence interval; NA, not reported or data not available for making calculations; NS, statistically non significant.
aData from Paci et al 2002 [35] for female population until 1996, and estimation until from 1996 to 1999 obtained using projection based on linear regression.
bCounties of Akerhus, Hordaland, Oslo, Rogaland.
cLocal, regional, or distant SEER stage (Shambough et al. [17]): regional and distant extension were grouped as non-local.
dEngholm et al. [61].
eConnecticut, Hawaai, Iowa, New Mexico, Utah, Atlanta, Detroit, San Francisco-Oakland, Seattle-Puget Sound.
fhttp://seer.cancer.gov/popdata/download.html.
gIncidence data reported by 5-year blocks; APC as reported by Verkooijen et al. [23].
hIncidence data for 1995-97 and 1999-2002 (see Figure 1).
iMissing data on stage was reported as ‘‘low’’ after 1993, without other precision.
Annals
of
Oncology
review
Volume
22
|
No.
8
|
August
2011
doi:10.1093/annonc/mdq633
|
online. For the SEER and Connecticut Tumor Registry, before 1998, size was missing for 20%–42% of invasive cancers and thus, we used the local/regional/distant classification for which there were 3.6% unstaged cancers per year on average.
advanced breast cancer incidence
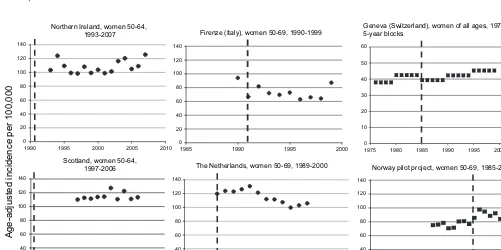
Temporal trends in size-specific breast cancer in the 11 main studies are reported as APC in Table 1. Figures 1–3 display temporal trends in advanced breast cancer incidence.
The differences in incidence rates between areas were partly due to differences in the age groups considered and to the use of different reference populations for standardisation of rates. Such differences do not affect time trends.
In Firenze (Figure 1), the incidence of advanced cancers was reported for a single year (1990) before the screening
programme started. The rate decreased abruptly in 1991 and then stabilised until 1998, and in 1999, it came back to the 1990 level. The APC of21.6% is essentially due to the high 1990 rate at the beginning.
In The Netherlands, the National Evaluation Team for Breast Cancer Screening published size-specific incidence from 1989 until 1997 [8]. Incidences until 2000 were displayed in the 11th Evaluation Report [53]. In 2008, incidence rates by TNM stage until 2003 were reported during the International Union Against Cancer (UICC) World Cancer Congress in Geneva, Switzerland [60]. The incidence of cancers over 20 mm in women 50–69 first decreased by 12.2% from 1989 to 1997 with the lowest rate observed in 1998 (Figure 1). However, rates increased again in 1999 and 2000. The report made during the 2008 UICC World Cancer Congress in Geneva (Switzerland) concluded that ‘the initially observed decrease of advanced breast cancers after the
implementation of mammography screening did not continue after 1997, but, was followed by an increase to the initial level’ [60]. Of note, in this report, ‘advanced’ equals cancers>20 mm in size with positive lymph nodes and/or distant metastases (M1) which represented60% of all cancers>20 mm.
In Northern Ireland and in Scotland, trends in cancer‡20 mm remained stable (Figure 1).
No change in incidence of advanced cancers occurred in the four Norwegian counties in the years following implementation of the pilot screening programmes in 1996.
In Geneva, Switzerland, trends in incidence rates of localised and non-localised (SEER definition) were reported separately for ductal and lobular invasive carcinoma. The latter type of breast cancer is more difficult to detect by mammography and we retained only data for ductal carcinoma.
No change in the incidence of advanced ductal cancers was evident in Geneva.
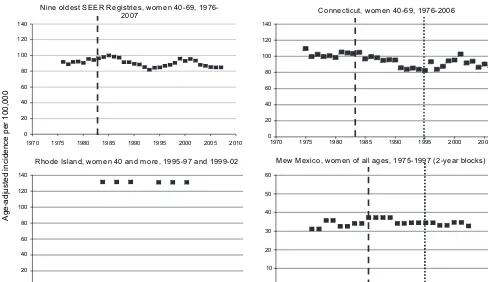
In the nine oldest SEER registries (USA), during a 16-year period, the incidence trends of non-local cancers were erratic with periods of decrease alternating with periods of increase (Figure 2). In 2001, rates had returned to levels before screening started. After 2000, the incidence of advanced cancers decreased, but similar decreases were noticeable for early cancer (<20 mm size of local cancers, data not displayed) [62]. The population in Connecticut represent 14% of the population in the nine oldest SEER areas. From 1975 to 2006, the incidence of non-local cancer fluctuated like the nine oldest SEER areas. In 1995, the Breast and Cervical Cancer Early Detection Program was launched. The incidence of advanced cancer peaked again in 2000 when participation to screening had reached 84%. Alike the nine oldest SEER areas, the incidence of advanced cancers
9 9 9 1 -0 9 9 1 , 9 6 -0 5 n e m o w , ) y l a t I ( e z n e r i F , 4 6 -0 5 n e m o w , d n a l e r I n r e h t r o N 7 0 0 2 -3 9 9 1
Scotland, women 50-64, 6 0 0 2 -7 9 9
1 The Netherlands, women 50-69, 1989-2000
, 9 9 9 1 -6 7 9 1 , s e g a ll a f o n e m o w , ) d n a l r e z t i w S ( a v e n e G s k c o l b r a e y -5 0 10 20 30 40 50 60 2005 2000 1995 1990 1985 1980 1975
Norway pilot project, women 50-69, 1985-2004
[image:5.684.51.552.430.680.2]0 20 40 60 80 100 120 140 2005 2000 1995 1990 1985 1980 1975 0 20 40 60 80 100 120 140 0 20 40 60 80 100 120 140 0 20 40 60 80 100 120 140 0 20 40 60 80 100 120 140 2010 2005 2000 1995 1990 2010 2005 2000 1995 1990 2000 1995 1990 1985 A g e-a d juste d inci denc e pe r 10 0,00 0 2005 2000 1995 1990 1985
Figure 1. Age-adjusted incidence rates of advanced breast cancer in Northern Ireland, Scotland, Firenze (Italy), The Netherlands, Geneva (Switzerland), and Norway. The interrupted vertical line indicates the year of screening start. Criterion for advanced cancer is a tumour size>or‡20 mm (dots) or non-local cancer (squares). Rates were age adjusted using the World standard population (for Northern Ireland and Scotland) and the European standard population (for The Netherlands and Geneva). No information on age-adjustment was provided for the Norway pilot project and for Firenze (Italy).
review
Annals of Oncologydecreased after 2000, but larger decreases were noticeable for early cancer (<20 mm size of local cancers, data not displayed).
In New Mexico, the incidence of advanced cancers increased slightly from 32.3 per 100 000 women of all ages in 1979–80 to 36.9 in 1983–84. It remained the same in 1985–86 and slightly decreased to 34.2 in 1987–88. After 1987–88, the incidence remained stable until 1997 and was not affected by the Breast and Cervical Cancer Early Detection Program launched in 1991.
In Rhode Island, the annual incidence of stages II–IV breast cancers in women 40 years of age and more was unchanged at 132.0 per 100 000 for the period 1995–97 and 131.3 for the period 1999–2001 (incidence rates for 1998 were not reported).
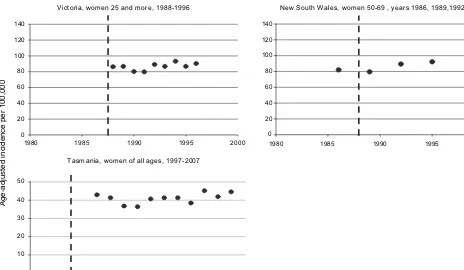
In Victoria, New South Wales, and Tasmania, trends in advanced cancer remained constant over time (Figure 3).
Incidence of large cancers or of cancer that already had disseminated in distant organ at diagnosis was available in some areas (Table 1). Cancer‡30 mm size represented 50% and 46% of all cancer‡20 mm in Northern Ireland and in Scotland, respectively. Upward trends of cancer‡30 mm were noticeable.
In the nine oldest SEER registries (USA), distant cancers represented15% of all non-local cancers. Their incidence remained stable in the nine old SEER registries, while in Connecticut significant downward trends were noticeable with APC of21.0% from 1980 to 2006. However, the decrease in the incidence of advanced breast cancer observed until 1995 started in years preceding screening start and well before participation to screening was substantial (APC 1975–2006:21.1%; 95% CI21.6 to20.6).
In New South Wales, while there was a significant decrease in the incidence of cancers‡30 mm (APC=21.5; 95% CI22.4 to20.5), there was a concomitant strong increase in the incidence of cancers 20–29 mm (APC=4.1%; 95% CI 3.5% to 4.7%). In Tasmania, the incidence of cancers>49 mm remained stable over the 11-year period of observation.
Missing data on size or stage were variable, from 1% in Geneva (Switzerland) to 24% in Norway. No association between amounts of missing and time trends were noticed (data not shown).
discussion
In areas included in this study, breast cancer mortality fell dramatically after 1990 with APCs ranging from21.7% to 22.5% [1–3]. Often, mortality decreases started before screening started or was offered to the majority of women. In examining trends of breast cancer by size or by stage, we expected to observe decreases in the incidence rate of advanced breast cancer. In contrast, this study found that in general, incidence rates of advanced breast cancer did not change much despite 7–15 years of good participation in mammographic screening. There were variations in some areas, with transient downward trends. These, however, were followed by increases back to pre-screening rates. For instance, in The Netherlands, trends in the falling incidence of advanced cancer for the first 7 years of screening were compatible with the results of most trials. However, incidence rates in 2003 were close to initial values in 1989 just before the launch of the national breast screening programme. Likewise, the rates of advanced breast 0
20 40 60 80 100 120 140
2010 2005 2000 1995 1990 1985 1980 1975 1970
0 20 40 60 80 100 120 140
2010 2005 2000 1995 1990 1985 1980 1975 1970
Age-adjusted incidence per 100,000
-6 7 9 1 , 9 6 -0 4 n e m o w , s e i r t s i g e R R E E S t s e d l o e n i N
7 0 0
2 Connecticut,women40-69,1976-2006
0 20 40 60 80 100 120 140
2005 2000
1995 1990
0 10 20 30 40 50 60
2000 1995 1990
1985 1980 1975
1970
2 0 -9 9 9 1 d n a 7 9 -5 9 9 1 , e r o m d n a 0 4 n e m o w , d n a l s I e d o h
[image:6.684.66.554.56.338.2]R MewMexico,womenofallages,1975-1997(2-yearblocks)
Figure 2. Age-adjusted incidence rates of advanced breast cancer in the United States. The interrupted vertical line indicates the year of screening start (not displayed in Rhode Island where it started in 1983). The doted line is the first year of the Breast and Cervical Cancer Early Detection Program. Criterion for advanced cancer is a tumour size>20 mm (dots) or non-local cancer (squares), or (for Rhode Island) stages II–IV (squares). Rates were age adjusted using the 2000 US standard population but for New Mexico where the 1970 US standard population was used.
Annals of Oncology
review
cancer in the USA in 2000 were nearly back to levels before screening started. The fall of rates in the USA after 2001 was linked to massive drops in the use of hormone replacement treatment (HRT) after publication of the Women’s Health Initiative trial, and falls of rates have affected breast cancer of all stages and of all sizes [31, 62]. Similar rate decreases of early and advanced breast cancer after massive cessation of HRT use by postmenopausal women have been observed in other countries [63, 64].
Comparison of breast screening activities showed that the numbers of large screen-detected cancers>20 mm were very similar in the USA and the UK in spite of considerable differences in the way screening is implemented [65, 66]. These elements indicate that the lower than expected decrease in advanced cancer incidence seems not attributable to age at screening, to screening frequency or to the way screening is implemented.
Randomised trials of breast cancer screening and their reviews concluded that mammographic screening of women aged 50–69 years decreases breast cancer mortality by 20% to 25% [8, 67]. In a previous work, we showed that in these trials, breast cancer mortality reductions were directly proportional to the fall in the incidence of advanced breast cancer [12]. Results of this study do not concur with expectations from
mammography randomised trials despite the fact that women living in areas included in this study were at least as compliant to screening and had more screening rounds than women had in the intervention groups of most randomised trials. For instance, in the Swedish Two-County trial, the cumulative incidence of advanced breast cancer steadily decreased by 4.4% per year in women allocated to mammography compared with the control group [5, 6]. Two to four screening rounds at 24–33
month-interval lead to a 31% reduction in advanced breast cancer incidence and 32% in breast cancer mortality [12]. In contrast, until 2002 (when the massive discontinuation of hormone replacement treatment took place), no or only little change occurred in the incidence of advanced breast cancer in the USA, despite that over>10–15 years, most US women 40– 69 years had three to five times more mammography screenings than in the Two-County Trial.
Other cancers subject to screening have shown remarkable decreases in both the incidence of advanced cancer and of mortality. For instance, in the USA, similarly to breast cancer mortality, colorectal cancer mortality has decreased by 1.8% per year from 1990 to 2006 [68]. A substantial contribution of earlier detection to the reduction of mortality is supported by steady decreases in the incidence of regional (22.5% per year) and of distant (21.2% per year) colorectal cancer in the SEER data [69]. In Iceland, age-adjusted annual mortality rate from cervical cancer decreased from 5.0 per 100 000 in 1974–78 to 2.1 in 1999–2003 [61]. At the same time, incidence of stages II–IV cervical cancer decreased by a factor two to three, depending on age [70].
What are the possible reasons for modest or no reduction in the incidence of advanced breast cancer?
First, in the absence of screening, would advanced breast cancer incidence have increased as the incidence of earlier breast cancer? This is very unlikely since generalisation of mammographic screening has been itself at the origin of sharp increases in the incidence of small breast cancers, many of which are deemed to be of low malignant potential [71]. In The Netherlands, no increase in proportions of advanced cancers in women not attending screening was observed [53], and there
6 9 9 1 -8 8 9 1 , e r o m d n a 5 2 n e m o w , a i r o t c i V 0 0 2 0 4 0 6 0 8 100 120 140 0 0 0 2 5 9 9 1 0 9 9 1 5 8 9 1 1980 0 0 2 0 4 0 6 0 8 100 120 140 2000 1995 1990 1985 0 8 9 1 5 9 9 1 d n a 2 9 9 1 , 9 8 9 1 , 6 8 9 1 s r a e y , 9 6 -0 5 n e m o w , s e l a W h t u o S w e N
Age-adjusted incidence per 100,000
[image:7.684.71.535.55.325.2]0 0 1 0 2 0 3 0 4 0 5 8 0 0 2 6 0 0 2 4 0 0 2 2 0 0 2 0 0 0 2 8 9 9 1 6 9 9 1 4 9 9 1 2 9 9 1 7 0 0 2 -7 9 9 1 , s e g a ll a f o n e m o w , a i n a m s a T
Figure 3. Age-adjusted incidence rates of advanced breast cancer in Victoria and New South Wales (Australia). The interrupted vertical line indicates the year of screening start. Criterion for advanced cancer is a tumour size>15 mm in Victoria and‡20 mm in New South Wales and Tasmania. Rates were age adjusted using the World standard population for Victoria and Tasmania and the 1991 Australia standard population for New South Wales.
review
Annals of Oncologywere no time changes in the incidence of advanced breast cancer in women<50 and>69 years of age in which screening is rare [8]. In Victoria (Australia), the incidence of advanced breast cancer in non-attending women was similar to that observed among screened women [51].
Second, reassurance of women with negative screening could have led to greater numbers of interval cancer>20 mm. This is unlikely to be the case. A study in The Netherlands concluded that this factor played only a minor role in breast cancer screening [72].
Mammographic screening aims to detect tumours in the breast, rather than lymph node or distant metastases. Therefore, size of invasive cancer was preferred to other indicators of cancer progression. Furthermore, contrary to axillary node status, cancer size measurement has remained stable over time [12]. In this respect, some of the fluctuations in rates of cancers classified as ‘regional or distant’ in the USA may have been due to changes over time in lymph node status assessment and improvements in the diagnosis of disseminated cancer. Changes in lymph node status assessment have also been invoked for explaining the absence of persistent
downward trend of the advanced breast cancer incidence in The Netherlands [60, 73]. But the stable incidence in large size cancer we have observed cannot be explained by changes in lymph node status assessment.
Our study has several limitations. In Victoria, New Mexico, and Switzerland, incidence rates were reported for wider age groups than those targeted by screening. However,96% of breast cancers occur after age 39 [68] and any decrease in advanced breast cancer occurrence due to screening before age 70 is expected to persist after that age. In the USA, screening after 69 years of age is common and nationwide surveys showed that in 1997–98, 57% of US women aged‡70 received screening within 2 years [18].
We did not find much published data on breast cancer incidence by cancer size or stage. This was often due to the absence of a population-based cancer registry or lack of recording of data on disease advancement by registries. Some registries reported high levels of missing stage or size data [10]. In many countries, co-existence of centrally organised screening programmes and non-centrally organised
screening activities (see additional material, available atAnnals
of Oncologyonline) made it difficult to obtain the same quality
statistics related to both types of screening.
In conclusion, there are unexpected differences between the results of randomised trials and screening with mammography as applied in general populations which require further investigation. Cancer registries should as a matter of routine collect size of breast cancers and the screening status to enable further monitoring of the impact of mammographic breast cancer screening.
acknowledgements
We wish to thank Dr David Brewster for access to the Scottish Cancer Registry data. Parts of this article are based on work done by PA and MB when they were staff members of the IARC, Lyon, France. The IARC, however, has no responsibility for any of the results, discussion, and conclusions of the present article.
disclosure
The authors declare no conflict of interest.
references
1. Hery C, Ferlay J, Boniol M, Autier P. Quantification of changes in breast cancer incidence and mortality since 1990 in 35 countries with Caucasian-majority populations. Ann Oncol 2008; 19: 1187–1194.
2. Hery C, Ferlay J, Boniol M, Autier P. Changes in breast cancer incidence and mortality in middle-aged and elderly women in 28 countries with Caucasian majority populations. Ann Oncol 2008; 19: 1009–1018.
3. Autier P, Boniol M, LaVecchia C et al. Disparities in breast cancer mortality trends between thirty European countries: retrospective trend analysis of WHO mortality database. BMJ 2010; 341: c3620 doi: 10.1136/bmj.c3620. 4. Berry DA, Cronin KA, Plevritis SK et al. Effect of screening and adjuvant
therapy on mortality from breast cancer. N Engl J Med 2005; 353: 1784–1792.
5. Tabar L, Fagerberg CJ, Gad A et al. Reduction in mortality from breast cancer after mass screening with mammography. Randomised trial from the Breast Cancer Screening Working Group of the Swedish National Board of Health and Welfare. Lancet 1985; 1: 829–832.
6. Day NE, Williams DR, Khaw KT. Breast cancer screening programmes: the development of a monitoring and evaluation system. Br J Cancer 1989; 59: 954–958.
7. IARC. International Agency for Research on Cancer. Breast Cancer Screening; Handbook. Lyon, France: IARC Press 2002.
8. Fracheboud J, Otto SJ, van Dijck JA et al. Decreased rates of advanced breast cancer due to mammography screening in The Netherlands. Br J Cancer 2004; 91: 861–867.
9. Smith RA, Duffy SW, Gabe R et al. The randomized trials of breast cancer screening: what have we learned? Radiol Clin N Am 2004; 42: 793–806.
10. Pisani P, Forman D. Declining mortality from breast cancer in Yorkshire, 1983– 1998: extent and causes. Br J Cancer 2004; 90: 652–656.
11. Duffy SW, Tabar L, Vitak B et al. The relative contributions of screen-detected in situ and invasive breast carcinomas in reducing mortality from the disease. Eur J Cancer 2003; 39: 1755–1760.
12. Autier P, He´ry C, Haukka J et al. Advanced breast cancer and breast cancer mortality in randomized controlled trials on mammography screening. J Clin Oncol 2009; 27: 5919–5923.
13. Blackman DK, Bennett EM, Miller DS. Trends in self-reported use of mammograms (1989–1997) and papanicolaou tests (1991–1997). MMWR 1999; 48(SS-6): 1–22.
14. Esserman L, Shieh Y, Thompson I. Rethinking screening for breast cancer and prostate cancer. JAMA 2009; 15: 1685–1692.
15. AJCC. American Joint Committee on Cancer: AJCC Cancer Staging Manual, 6th edition. New York, NY: Springer 2002; 171–180.
16. UICC. International Union Against Cancer (UICC), TNM Classification of Malignant Tumours, 6th edition. New York: Wiley-Liss 2002.
17. Shambough E, Gloecker Ries L, Young J et al. SEER Extent of Disease—1988 Instructions. Washington, DC: National Institutes of Health 1992 Codes and Coding.
18. Caplan LS. To screen or not to screen: the issue of breast cancer screening in older women. Public Health Rev 2001; 29: 231–240.
19. Paci E, Duffy S. Overdiagnosis and overtreatment in service screening. Breast Cancer Res 2005; 7: 266–270.
20. Hofvind S, Sorum R, Thoresen S. Incidence tumor characteristics of breast cancer diagnosed before and after implementation of a population-based screening program. Acta Oncol 2008; 47: 225–231.
21. Kleinbaum DG, Kupper LL, Muller AL. Applied Regression Analysis and Other Multivariable Methods, 2nd edition. Boston, MA: PWS-Kent 1988.
22. Kricker A, Farac K, Smith D et al. Breast cancer in New South Wales in 1972– 1995: tumor size and the impact of mammographic screening. Int J Cancer 1999; 81: 877–880.
Annals of Oncology
review
23. Verkooijen HM, Fioretta G, Vlastos G et al. Important increase of invasive lobular breast cancer incidence in Geneva, Switzerland. Int J Cancer 2003; 104: 778–781.
24. Miller BA, Feuer EJ, Hankey BF. Recent incidence trends for breast cancer in women and the relevance of early detection: an update. CA Cancer J Clin 1993; 43: 27–41.
25. Garfinkel L, Boring CC, Heath CW Jr. Changing trends. An overview of breast cancer incidence and mortality. Cancer 1994; 74 (1 Suppl): 222–227. 26. Chu KC, Tarone RE, Kessler LG et al. Recent trends in U.S. breast cancer
incidence, survival, and mortality rates. J Natl Cancer Inst 1996; 88: 1571–1579.
27. Ghafoor A, Jemal A, Ward E et al. Trends in breast cancer by race and ethnicity. CA Cancer J Clin 2003; 53: 342–355.
28. Schootman M, Jeffe D, Reschke A, Aft R. The full potential of breast cancer screening use to reduce mortality has not yet been realized in the United States. Breast Cancer Res Treat 2004; 85: 219–222.
29. Hausauer AK, Keegan TH, Chang ET, Clarke CA. Recent breast cancer trends among Asian/Pacific islander, Hispanic, and African-American women in the US: changes by tumor subtype. Breast Cancer Res 2007; 9: R90.
30. Smigal C, Jemal A, Ward E et al. Trends in breast cancer by race and ethnicity: update 2006. CA Cancer J Clin 2006; 56: 168–183.
31. Jemal A, Elizabeth Ward E, Thun MJ. Recent trends in breast cancer incidence rates by age and tumor characteristics among U.S. women. Breast Cancer Res 2007; 9: R28.
32. Anderson WF, Jatoi I, Devesa SS. Assessing the impact of screening mammography: breast cancer incidence and mortality rates in Connecticut (1943–2002). Breast Cancer Res Treat 2006; 99: 333–340.
33. Polednack AP. Trends in late-stage breast and cervical cancer incidence rates in Connecticut (United States). Cancer Causes Control 2003; 14:
361–365.
34. Barchielli A, Paci E. Trends in breast cancer mortality, incidence, and survival, and mammographic screening in Tuscany, Italy. Cancer Causes Control 2001; 12: 249–255.
35. Paci E, Duffy SW, Giorgi D et al. Quantification of the effect of mammographic screening on fatal breast cancers: The Florence Programme 1990–96. Br J Cancer 2002; 87: 65–69.
36. Hofvind S, Sørum R, Haldorsen T, Langmark F. Incidence of breast cancer before and after implementation of population-based mammography screening. Tidsskr Nor Lægeforen 2006; 126: 2935–2938 (Article in Norwegian).
37. McCann J, Stockton D, Day N. Breast cancer in East Anglia: the impact of the breast screening programme on stage at diagnosis. J Med Screen 1998; 5: 42–48.
38. Schouten LJ, de Rijke JM, Schlangen JT, Verbeek AL. Evaluation of the effect of breast cancer screening by record linkage with the cancer registry, The Netherlands. J Med Screen 1998; 5: 37–41.
39. Hiatt RA, Tekawa IS. Mammography utilization in relation to stage at diagnosis for breast cancer: the Kaiser Permanente experience in a large pre-paid health plan. Prog Clin Biol Res 1990; 339: 227–238.
40. Simon MS, Lemanne D, Schwartz AG et al. Recent trends in the incidence of in situ and invasive breast cancer in the Detroit metropolitan area (1975–1988). Cancer 1993; 71: 769–774.
41. Vutuc C, Haidinger G, Waldhoer T. Prevalence of self-reported screening mammography and impact on breast cancer mortality in Austria. Wien Klin Wochenschr 1998; 110(13–14): 485–490.
42. Kotwall C, Covington D, Churchill P et al. Breast conservation surgery for breast cancer at a regional medical center. Am J Surg 1998; 176(6): 510–514.
43. Harvey JM, Sterrett GF, McEvoy S et al. Pathology reporting of breast cancer: trends in 1989–1999, following the introduction of mammographic screening in Western Australia. Pathology 2005; 37(5): 341–346.
44. Jensen AR, Madsen AH, Overgaard J. Trends in breast cancer during three decades in Denmark: stage at diagnosis, surgical management and survival. Acta Oncol 2008; 47: 537–544.
45. Malmgren JA, Mary K, Atwood MK, Henry G, Kaplan HG. Increase in mammography detected breast cancer over time at a community based regional
cancer center: a longitudinal cohort study 1990–2005. BMC Cancer 2008; 8: 131.
46. Taplin SH, Ichikawa L, Buist DSM et al. Evaluating organized breast cancer screening implementation: the prevention of late-stage disease? Cancer Epidemiol Biomarkers Prev 2004; 13: 225–234.
47. Glass AG, Lacey JV Jr, Carreon JD, Hoover RN. Breast cancer incidence, 1980– 2006: combined roles of menopausal hormone therapy, screening
mammography, and estrogen receptor status. J Natl Cancer Inst 2007; 99: 1152–1161.
48. Prehn A, Clarke C, Topol B et al. Increase in breast cancer incidence in middle-aged women during the 1990s. Ann Epidemiol 2002; 12: 476–481.
49. Ward E, Jemal A, Thun M. Regarding ‘‘increase in breast cancer incidence in middle-aged women during the 1990s’’. Ann Epidemiol 2005; 15: 424–425. 50. Louwman WJ, Voogd AC, van Dijck JAMM et al. On the rising trends of incidence
and prognosis for breast cancer patients diagnosed 1975–2004: a long-term population-based study in southeastern Netherlands. Cancer Causes Control 2007; 19: 97–106.
51. Harmer C, Staples M, Kavanagh AM. Evaluation of breast cancer incidence: is the increase due entirely to mammographic screening? Cancer Causes Control 1999; 10: 333–337.
52. Tasmanian Cancer Registry. Cancer in Tasmania: Incidence and Mortality, 1997–2007 (11 Reports). Hobart, Australia: Menzies Research Institute 2010. 53. NETBCS. National Evaluation Team for Breast Cancer Screening. National
evaluation of breast cancer screening in the Netherlands 2005 11th Evaluation report, Rotterdam.
54. Northern Ireland Cancer Registry, Centre for Public Health, School of Medicine, Dentistry & Biomedical Sciences Queen’s University Belfast, Belfast. http:// www.qub.ac.uk/research-centres/nicr/ (26 August 2010, date last accessed). 55. Scottish Cancer Registry Scottish Cancer Registry, Information Services Division
of NHS National Services Scotland (ISD Scotland), Edinburgh. http:// showcc.nhsscotland.com/isd//3535.html (26 August 2010, date last accessed).
56. Surveillance, Epidemiology, and End Results (SEER) Program. SEER*Stat Database: Incidence—SEER 17 Regs Research Data+Hurricane Katrina Impacted Louisiana Cases, Nov 2009 Sub (1973–2007 Varying)
(www.seer.cancer.gov), National Cancer Institute, DCCPS, Surveillance Research Program, Cancer Statistics Branch, released April 2010; based on the November 2009; submission.
57. Connecticut Cancer registry. Connecticut department of Health. http:// www.ct.gov/dph/cwp/view.asp?a=3129&q=389716 (26 August 2010, date last accessed).
58. Escobedo LG, Zhong Z, Key C. Breast and cervical cancer screening and disease incidence and stage in New Mexico. Cancer Causes Control 2002; 13: 137–145.
59. Coburn NG, Chung MA, Fulton J, Cady B. Decreased breast cancer tumor size, stage, and mortality in Rhode Island: an example of a well-screened population. Cancer Control 2004; 11: 222–230.
60. Fracheboud J, Otto SJ, Holland R et al. Is There a Real Increase of Advanced Breast Cancers in Spite of Mammography Screening?. Geneva, Switzerland: UICC 08 World Cancer Congress, International Union Against Cancer 27-31 2008 (Abstr FC55).
61. Engholm G, Ferlay J, Christensen N et al. NORDCAN: Cancer Incidence, Mortality and Prevalence in the Nordic Countries, Version 3.2. Association of Nordic Cancer Registries. Copenhagen, Denmark: Danish Cancer Society 2008 http:// www.ancr.nu; http://www-dep.iarc.fr/nordcan.htm.
62. Ravdin PM, Cronin KA, Howlader N et al. The decrease in breast-cancer incidence in 2003 in the United States. New Eng J Med 2007; 356: 1870–1876.
63. Renard F, Vankrunkelsven P, Van Eycken L et al. Decline in breast cancer incidence in the Flemish region of Belgium after a decline in hormonal replacement therapy. Ann Oncol 2010 May 3 [Epub ahead of print].
64. Daubisse-Marliac L, Delafosse P, Boitard JB et al. Breast cancer incidence and time trend in France from 1990 to 2007: a population-based study from two French cancer registries. Ann Oncol 2010 August 2 [Epub ahead of print].
review
Annals of Oncology65. Smith-Bindman R, Chu PW, Miglioretti DL. Comparison of screening mammography in the United States and the United Kingdom. JAMA 2003; 290: 2129–2137.
66. Smith-Bindman R, Ballard-Barbash R, Miglioretti DL et al. Comparing the performance of mammography screening in the USA and the UK. J Med Screen 2005; 12: 50–54.
67. Humphrey LL, Helfand M, Chan BK, Woolf SH. Breast cancer screening: a summary of the evidence for the U.S. Preventive Services Task Force. Ann Intern Med 2002; 137(5 part 1): 347–360.
68. Jemal A, Siegel R, Xu J, Ward E. Cancer statistics, 2010. CA Cancer J Clin 2010; 60: 277–300.
69. Edwards BK, Ward E, Kohler BA et al. Annual report to the nation on the status of cancer, 1975–2006, featuring colorectal cancer trends and impact of
interventions (risk factors, screening, and treatment) to reduce future rates. Cancer 2010; 116: 544–573.
70. Sigurdsson K, Sigvaldason H. Effectiveness of cervical cancer screening in Iceland, 1964–2002: a study on trends in incidence and mortality and the effect of risk factors. Acta Obstet Gynecol Scand 2006; 85: 343–349.
71. Chiu C, Morrell S, Page A et al. Population-based mammography screening and breast cancer incidence in New South Wales, Australia. Cancer Causes Control 2006; 17: 153–160.
72. De Gelder R, van As E, Tilanus-Linthorst MM et al. Breast cancer screening: evidence for false reassurance? Int J Cancer 2008; 123: 680–686. 73. Maaskant AJG, van de Poll-Franse LV, Voogd AC et al. Stage migration due to
introduction of the sentinel node procedure: a population-based study. Breast Cancer Res Treat 2009; 113: 173–179.
Annals of Oncology