Effect of electric-current pulses on grain-structure evolution in cryogenically rolled
copper
Tatyana Konkova and Irshat Valeev
Institute for Metals Superplasticity Problems, Russian Academy of Science, Ufa 450001, Russia Sergey Mironov
Institute for Metals Superplasticity Problems, Russian Academy of Science, Ufa 450001, Russia; and Department of Materials Processing, Graduate School of Engineering, Tohoku University, Sendai 980-8579, Japan
Alexander Korznikov
Institute for Metals Superplasticity Problems, Russian Academy of Science, Ufa 450001, Russia; and National Research Tomsk State University, Tomsk 634050, Russia
Michail Myshlyaev
Baikov Institute of Metallurgy and Material Science, Russian Academy of Science, Moscow 119991, Russia; and Institute of Solid State Physics, Russian Academy of Sciences, Chernogolovka, Moscow oblast 142432, Russia
S. Lee Semiatin
Air Force Research Laboratory, Materials and Manufacturing Directorate, AFRL/RXCM, Wright-Patterson AFB, Ohio 45433-7817, USA
The effect of electric-current pulses on the evolution of microstructure and texture in cryogenically rolled copper was determined. The pulsed material was found to be completely recrystallized, and the recrystallization mechanism was deduced to be similar to that operating during conventional static annealing. The microstructural changes were explained simply in terms of Joule heating. A significant portion of the recrystallization process was concluded to have occurred after pulsing; i.e., during cooling to ambient temperature. The grain structure and microhardness were shown to vary noticeably in the heat-affected zone (HAZ); these observations mirrored variations of temper colors. Accordingly, the revealed microstructure heterogeneity was attributed to the inhomogeneous temperature distribution developed during pulsing. In the central part of the HAZ, the mean grain size increased with current density and this effect was associated with the temperature rise per se. This grain size was slightly smaller than that in statically recrystallized specimens.
I. INTRODUCTION
Large deformation at cryogenic temperatures is sometimes considered as a promising and cost-effective method for producing bulk fine-grained materials (e.g., Refs. 1–5). The thermal stability of cryodeformed materials is therefore of substantial interest. For example, in previous work,6 the static-annealing behavior of cryogenically rolled copper in the temperature range of 50– 950 °C was established. The material was found to have poor microstructure stability. Specifically, evidence of recrystallization was noted after annealing at 50 °C for only 1 h, and the material was completely recrystallized simply during heating to 450 °C. The recrystallization process per se was shown to be discontinuous in nature. As an extension of the previous research, the present study was undertaken to determine the effect of electric-current pulses (ECP) of very short duration on the evolution of grain structure in cryorolled copper.
is still not completely clear, however. Current theories are based either on an assumption of a specific dislocation resistivity or on quantum mechanics considerations of the interactions between conductions electrons and dislocations.7 In some research works, however, the observed microstructural changes during ECP were suggested to be solely due to Joule heating (e.g., Ref. 13).
Despite these previous studies, many important aspects of microstructure evolution during ECP are still unclear. The electron backscatter diffraction (EBSD) technique was used in the present work to characterize grain structure evolution and thus to obtain a deeper insight into the process.
II. MATERIAL AND EXPERIMENTAL PROCEDURES
The material used in the present work consisted of 99.9 wt% pure copper supplied as a hot-rolled bar. The as-received material was preconditioned by severe “abc” deformation14 and then cryogenically rolled to 90% overall thickness reduction (true strain = - 2.3). The total thickness reduction was achieved using multiple passes of ≈10% each. To provide cryogenic deformation conditions, the rolling perform and work rolls were soaked in liquid nitrogen prior to each pass and held for 20 min. Immediately after each pass, the workpiece was re-inserted into liquid nitrogen. The total time of each pass (i.e., the exposure time of the specimen under ambient conditions) was only a few seconds. Heat transfer calculations revealed that the warming of the rolls and copper specimens prior to rolling due to free convection in air was small, resulting in temperature increase of the order of only ≈1–4 °C. Additional details of the cryorolling process are described elsewhere.4
To maintain consistency with the scientific literature on rolling, the typical flat-rolling conventions are used throughout this work, i.e., RD denotes the rolling direction, TD the transverse direction, and ND the normal direction of the rolled sheet. For ECP treatment, specimens measuring 10 (RD) x 5 (TD) x1 (ND) mm3 were machined from the cryorolled sheets.
ECP was performed under ambient conditions by attaching copper electrodes to the end of each sample and the subsequent discharge of a high-voltage capacitor bank. The waveform of the ECP was determined to be a damped oscillation using a Rogowski coil15 and C8-17 dual-trace storage oscilloscope (manufactured by Research Institute for Radio Engineering, Kaunas, USSR). Due to the relatively small specimen thickness, the skin effect was negligible. Further details of the ECP treatment are described elsewhere.13
The energy released during ECP was quantified by the integral current density, Kj15:
,
in which j denotes the current density, is the pulse duration, k is the coefficient of the Rogowski coil (k=44), S is the cross-sectional area of the pulsed specimen, and A1, A2, and A3 are the first, second, and third amplitudes of the damped current, respectively. The pulse duration was 100 s in all cases. To establish the effect of ECP energy on microstructure evolution, the integral current density was varied from Kj = 0.2 x10⁵ A2 s mm-4 to Kj = 0.77 x10⁵ A2 s mm-4.
To preserve the microstructures developed during ECP, the processed samples were stored in a freezer at≈ -20 °C prior to examination.
boundaries (LABs) and high-angle boundaries (HABs). Grains were defined as crystallites bordered by a continuous HAB perimeter.
To obtain a broader view of the underlying microstructure changes, the Vickers microhardness was also measured using a load of 50 g for 10 s.
III. RESULTS
A. Cryogenically rolled material
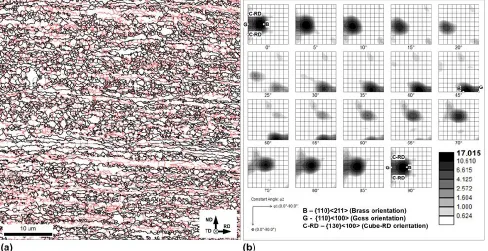
A typical EBSD grain-boundary map obtained from cryogenically rolled material is shown in Fig. 1(a). In the map, LABs, HABs, and Σ3 twin boundaries (within a 5° tolerance) are depicted by red, black, and grey lines, respectively. (The reader is referred to online version of the paper to see the figures in color.) The microstructure was dominated by heavily rolled grains which were highly elongated along the RD. The grains contained a dense subboundary network; the LABs comprised 51% of the total grain-boundary area. In addition to the LAB network, a number of fine, equiaxed grains decorating the boundaries of the coarse elongated grains were noted. As found in previous work,16 the fine grains originated from local grain boundary bulging occurring during warming of the cryorolled material to ambient temperature after deformation.
The cryorolled material was characterized by a relatively strong texture which was dominated by the {011}<211> brass component [Fig. 1(b)]. The formation of the brass texture during cryorolling of copper has been reported previously4,17 and has been attributed to the suppression of cross slip.4 In the present work, the brass texture was characterized by a large orientation spread giving rise to noticeable fractions of {011}<100> Goss and {013}<100> cube-RD orientations [Fig. 1(b)].
B. Macrostructure and hardness of ECP material
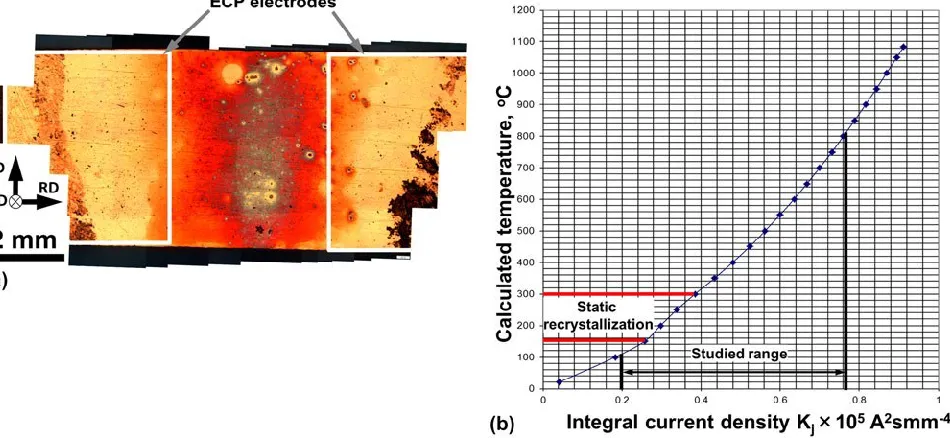
The macrostructure of electric-current pulsed (ECP) specimens was revealed by chemical etching after ECP (Fig. 2); such observations were complemented by microhardness measurements (Fig. 3). For clarity, contours of the locations at which the ECP electrodes were attached are also shown.
At the relatively high integral current density of Kj ≥ 0.44 x10⁵ A2 s mm-4, a so-called heat-affected zone (HAZ) was developed in the central (i.e., fully annealed) part of ECP specimens [Fig. 2(a)], thus giving rise to substantial material softening [Fig. 3(a)]. As quantified by the microhardness measurements (and somewhat by the etching response), the HAZ was slightly wider than the space between the electrodes [Figs. 2(a) and 3(a)]. However, the macrostructure of the HAZ was somewhat inhomogeneous; variations of the optical contrast mirrored those of microhardness [Figs. 2(a) and 3(a)]. In particular, areas directly adjacent to the electrodes were relatively dark [Fig. 2(a)], and the microhardness here was as high as 70–80 Vickers (Hv) [Fig. 3(a)]. In the central part of the HAZ, the optical contrast was bright [Fig. 2(a)], and the hardness decreased to ≈50 Hv [Fig. 3(a)]. The microstructure in the HAZ is discussed in more detail in Sec. D.
At a relatively low integral current density (i.e., Kj ≤ 0.34 x10⁵ A2 s mm-4), the HAZ was very small [indicated by arrows in Figs. 2(b) and 3(b)]. It was confined to the specimen edges directly adjacent to the ECP electrodes.
In all cases, the microhardness in the HAZ was equal or even lower than that of statically recrystallized copper, i.e., ≈75 Hv.6 This suggests that the material subjected to ECP experienced recrystallization. It was also found that the microhardness in the “dead zones” (Fig. 3) was lower than that in the as-cryodeformed material, i.e., ≈182 Hv.6
C. Grain structure in the dead zone
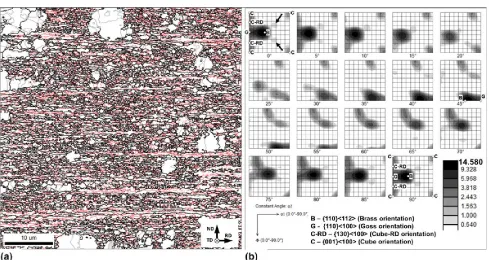
not change significantly [compare Figs. 4(b) and 1(b)]. The only noticeable change was the appearance of components with orientations of (55; 30; 0) and (55; 60; 0), as indicated by the arrows in Fig. 4(b).
In a broad sense, the microstructure within the dead zone was similar to that developed after static annealing at 50 °C for 1 h.6 Thus the observed material softening was most likely related to partial recrystallization occurring in this area.
D. Grain structure in the HAZ
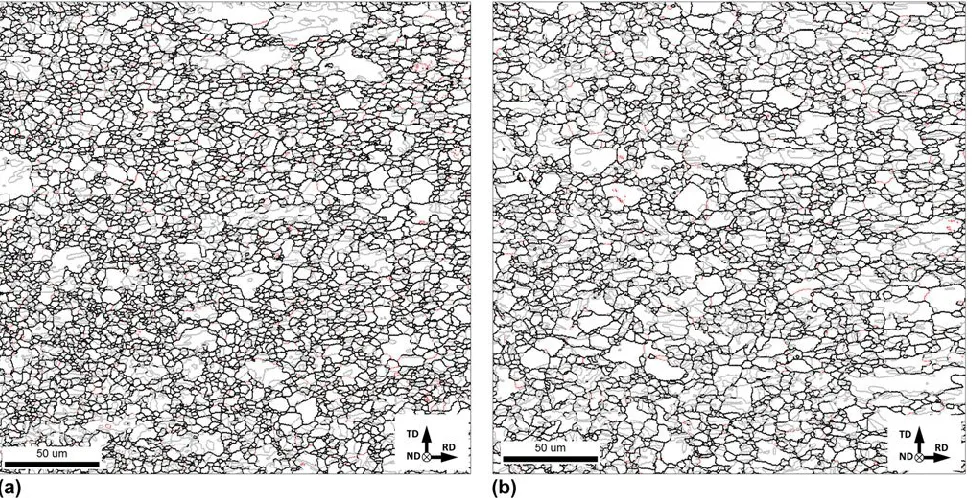
The effect of the integral current density on microstructure in the central parts of the HAZ of pulsed specimens was also determined using EBSD-based analysis (Figs. 5 and 6). In all cases, fully recrystallized grain structures were found. They were broadly similar to those developed during static annealing at 300 °C for 1 h [Figs. 5(a) and 5(b)]. However, a more detailed examination showed that the recrystallized microstructures were rather inhomogeneous, comprising both relatively small (≈1 m) and large (>10 m) grains [Fig. 5(a)]. The mean grain size increased with the integral current density, but typically it was somewhat smaller than that in the statically recrystallized material [Fig. 6(a)]. The LAB fraction in the pulsed specimens was as small as ≈10%, which was very close to that in the conventionally recrystallized material [Fig. 6(b)]. On the other hand, the proportion of Σ3 twin boundaries in the HAZ was slightly lower than that in the statically annealed samples [Fig. 6(b)]. Generally, the results were in good agreement with previous findings in the literature.8–10,13
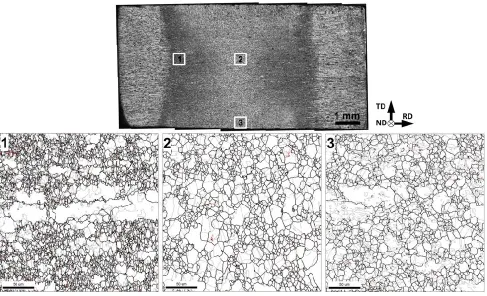
The grain-structure distribution in the HAZ was quantified further using EBSD maps taken from different locations of the specimen pulsed at Kj = 0.77 x10⁵ A2 s mm-4 (Fig. 7). The relevant microstructural (and textural) data are summarized in Tables I and II. These results indicated that the microstructure distribution was noticeably inhomogeneous, and the mean grain size varied substantially in the HAZ (Fig. 7 and Table I). All microstructures were bimodal, consisting of a mixture of relatively small and large grains (Fig. 7). This was most pronounced at the borders of the HAZ (Region 1 in Fig. 7). Furthermore, these variations mirrored quite well the nonuniformity in the microhardness distributions [Figs. 3(a) and 7].
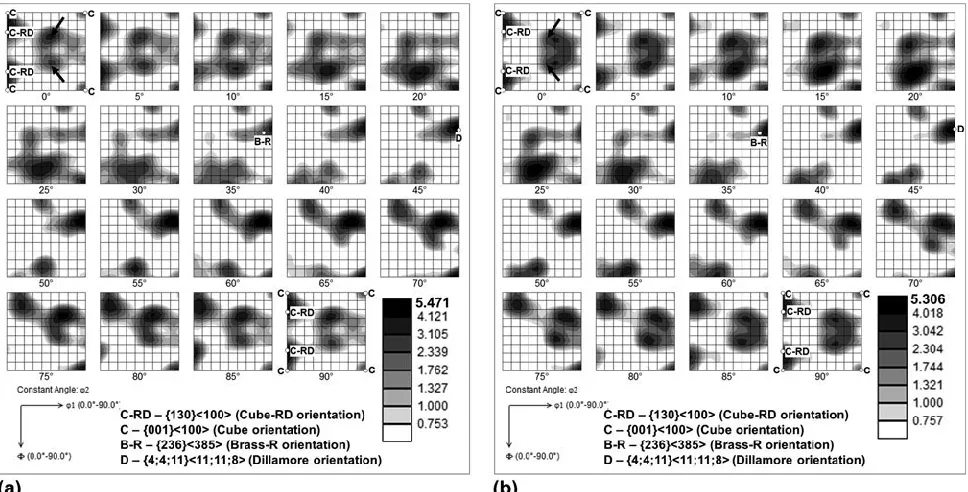
The textures evolved in all regions of the HAZ were similar to each other and to the texture of the statically recrystallized material, as shown by a comparison of the results in Tables II and III and Figs. 8 and 9. On the other hand, the textures were distinctly different from that developed during cryogenic rolling [Fig. 1(b)]. In particular, they became very weak [Fig. 8(a)], and the original Brass and Goss components disappeared almost completely [Figs. 8(a) and 9(a)]. Instead, the texture comprised mainly (55; 30/60; 0) and cube-RD components as well as newly developed {236}<385>Brass-R and {4; 4;11}<11; 11; 8> Dillamore orientations [Figs. 8(a) and 9(b)].
In general, the microstructural and textural data gave evidence that the material in the HAZ had undergone recrystallization. At Kj = 0.77 x10⁵ A2 s mm-4, however, the mean grain size was somewhat larger than that expected from the static-recrystallization measurements [Fig. 6(a)]. In this case, recrystallization can be surmised to have been followed by a small degree of grain growth.
IV. DISCUSSION
A. Temperature transients during ECP
Due to the very short duration of the current pulse during ECP (≈104 s), direct measurement of the temperature transients was not possible. However, heating of the copper samples in air led to surface oxidation/discoloration within the HAZ that enabled an approximate estimate of the spatial variation in peak temperature.
at a relatively high temperature, on the other hand, a thin black CuO outer oxide is formed above a pinkish-red Cu2O layer, and the oxide film becomes opaque.
To establish the ECP-induced temper colors, a specimen was diamond polished to produce a mirror finish and then pulsed at Kj = 0.8 x10⁵ A2 s mm-4. The formation of temper colors between the electrodes [Fig. 10(a)] indicated that the material experienced Joule heating. The colors varied from orange at the periphery of the HAZ to black along the centerline. This appearance suggested the development of an inhomogeneous temperature distribution in this zone consisting of a relatively cold periphery and a hotter center (Table IV). This qualitative temperature distribution mirrored the variation of grain size (Fig. 7 and Table I) and microhardness [Fig. 3(a)].
To supplement the temper-color analysis, the temperature rise due to Joule heating was quantified from the following equation15:
Here, ρe denotes electrical resistivity; T0 is the room temperature; TK is the temperature attained in the specimen; and q and c are the density and specific heat of copper, respectively. The relationship between the integral current density and the calculated temperature is shown in Fig. 10(b).13 In the present work, the calculated temperature varied from ≈100 °C (for Kj = 0.2 x10⁵ A2 s mm-4) to ≈800 °C (for Kj = 0.77 x10⁵ A2 s mm-4). For comparison, the recrystallization range during static annealing is also shown in the figure.
It should be noted that the real temperature distribution in the heat-affected zone was inhomogeneous, as deduced above. Hence, the calculated temperature should be considered as an approximate average. In the extreme case, the HAZ for Kj ≤ 0.34 x10⁵ A2 s mm-4 was very small [Figs. 2(b) and 3(b)]. Thus, the real current density and the respective calculated temperature in the local “hot spots” were likely considerably higher than that shown in Fig. 10(b).
Based on this observation, it may be concluded that the recrystallization temperature in the pulsed specimens was typically higher than that in statically annealed material. This agrees well with direct measurements of the effect of heating rate on recrystallization kinetics19 and presumably compensates for the shorter duration of heating.
B. Cooling stage
ECP provides very rapid heating. The duration of the heating is approximately equal to that of the electrical pulse, i.e., ≈104 s. On the other hand, the cooling of the pulsed material back to ambient temperature is not as quick. Hence, the cooling stage may play an equal, if not more important, role in microstructure formation per se. To clarify this possibility, the rate of cooling was evaluated for specimens pulsed at Kj ranging from 0.44 x10⁵ A2 s mm-4 [Tk ≈623 K, Fig. 10(b)] to 0.77 x10⁵ A2 s mm-4 [Tk ≈1073 K, Fig. 10(b)].
A variety of calculations revealed that the cooling of the narrow-width HAZ was determined by (rapid) heat conduction into the “dead zones” and subsequent slower heat conduction into ECP electrodes and grips. Using typical values of the interface heat transfer coefficient to characterize the workpiece–electrode interface (i.e., ≈1–2.5 kW/m2 K), the cooling time from the peak temperature in the HAZ to the ambient temperature varied in the range of ≈4–5 s, the exact value depending on the pulsing conditions. In general, however, the cooling time was ≈4 orders of magnitude greater than the pulse duration itself.
C. Microstructure evolution during ECP
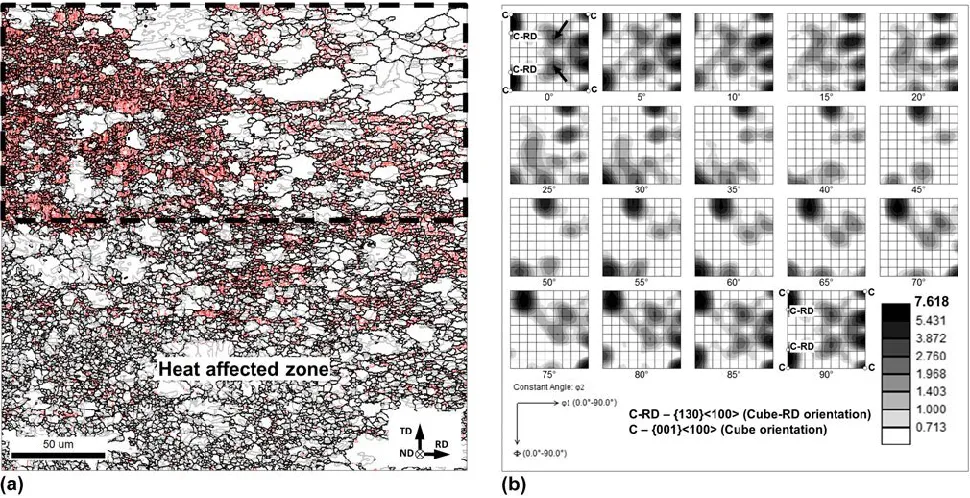
Due to the very fast nature of ECP, the interpretation of microstructure evolution is not a trivial task. To obtain further insight into the process, an EBSD map was determined for the transition region between the HAZ and dead zone in the specimen pulsed at low current density [Fig. 2(b)]. The results are shown in Fig. 11. The morphology of the microstructure ahead of the growing front of the HAZ in Fig. 11(a) suggested that grain structure development was governed by discontinuous recrystallization via the formation and growth of recrystallization nuclei. To evaluate the nucleation mechanism, the crystallographic orientation of the recrystallized grains ahead of the growing front [area enclosed by the broken lines in Fig. 11(a)] was measured and summarized as an ODF [Fig. 11(b)]. It is seen that the texture of the recrystallization nuclei was broadly similar to that of the statically recrystallized material [Fig. 11(b) versus Fig. 8(b)]. In view of the similarity in both texture and microstructure (Figs. 5 and 8), it thus appears that the recrystallization mechanism was nearly the same in both cases. Accordingly, the microstructure inhomogeneity in the HAZ (Fig. 7) may be explained simply in terms of an intermediate stage in the nucleation and growth of recrystallized grains. At the relatively colder periphery [Fig. 10(a)], the growth of the recrystallized grains was limited, and thus the resulting structure was fine-grained (Region 1 in Fig. 7). In the hottest (central) part [Fig. 10(a)], grain growth was more pronounced, and therefore the evolved structure was more coarse-grained (Regions 2 and 3 in Fig. 7). By contrast, the dead zone of the pulsed specimens experienced limited heat input during pulsing and/or during subsequent cooling of the material to ambient temperature. Since the microstructure of the cryorolled copper is known to be highly unstable,6,16 however, such heating likely gave rise to a degree of partial recrystallization (Fig. 4).
V. CONCLUSIONS
In this work, the effect of electric current pulses on the evolution of microstructure and texture of cryogenically rolled copper was investigated. To this end, the material was rolled to a 90% thickness reduction at liquidnitrogen temperature and then pulsed at an integral current density ranging from 0.2 x10⁵ A2 s mm-4 to 0.77 x10⁵ A2 s mm-4. Grain structure and texture changes were quantified using an EBSD technique. The main conclusions from this work are as follows:
(1)The material in the heat-affected zone (HAZ) was completely recrystallized. The recrystallization mechanism was deduced to be similar to that operating during conventional static annealing. The microstructural changes were explained simply in terms of Joule heating and similar observations for static recrystallization. No evidence of an “electron-wind” effect was found.
(2)Analysis of the temper color in the HAZ indicated an inhomogeneous temperature distribution. Near the electrodes, the temperature was deduced to be relatively low, whereas in the central part of the HAZ it was high. The temperature distribution was shown to control variations of the recrystallized grain size and thus microhardness across the HAZ.
(3)The cooling time of the pulsed specimens was estimated to be ≈4 orders of magnitude longer than the duration of the electric-current pulse. Thus, a significant portion of the microstructure-evolution process occurred after ECP during cool down to ambient temperature.
(4)In the central part of the HAZ, the mean grain size increased with the integral-current density; this effect can be directly related to the temperature rise.
ACKNOWLEDGMENTS
The authors thank Dr. R.M. Galeyev and Dr. O.R. Valiakhmetov for graciously providing the material used in this work, and P. Klassman and T.I. Nazarova for technical assistance during cryogenic rolling. One of the authors (AVK) would like to acknowledge the Tomsk State University Competitiveness Improvement Program for financial support.
REFERENCES
1. Y.S. Li, N.R. Tao, and K. Lu: Microstructural evolution andnanostructure formation in copper during dynamic plastic deformation at cryogenic temperatures. Acta Mater. 56, 230 (2008).
2. Y. Zhang, N.R. Tao, and K. Lu: Mechanical properties and rollingbehaviors of nano-grained copper with embedded nano-twin bundles. Acta Mater. 56, 2429 (2008).
3. Y. Huang and P.B. Prangnell: The effect of cryogenic temperature andchange in deformation mode on the limiting grain size in a severely deformed dilute aluminium alloy. Acta Mater. 56, 1619 (2008).
4. T. Konkova, S. Mironov, A. Korznikov, and S.L. Semiatin: Microstructural response of pure copper to cryogenic rolling. Acta Mater. 58, 5262 (2010).
5. S.V. Zherebtsov, G.S. Dyakonov, A.A. Salem, V.I. Sokolenko, G.A. Salishchev, and S.L. Semiatin: Formation of nanostructures in commercial-purity titanium via cryorolling. Acta Mater. 61, 1167 (2013).
6. T. Konkova, S. Mironov, A. Korznikov, M.M. Myshlyaev, andS.L. Semiatin: Annealing behaviour of cryogenically-rolled copper. Mater. Sci. Eng., A 585, 178 (2013).
7. H. Conrad, A.F. Sprecher, W.D. Cao, and X.P. Lu: Electroplasticity – The effect of electricity on the mechanical properties of metals. JOM 42, 28 (1990).
8. H. Conrad, N. Karam, and S. Mannan: Effect of electric currentpulses on the recrystallization of copper. Scr. Metall. 17, 411 (1983). 9. H. Conrad, N. Karam, and S. Mannan: Effect of prior cold work onthe influence of electric current pulses on the recrystallization of copper.
Scr. Metall. 18, 275 (1984).
10. H. Conrad, N. Karam, S. Mannan, and A.F. Sprecher: Effect ofelectric current pulses on the recrystallization kinetics of copper. Scr. Metall. 22, 235 (1988).
11. C.S. He, Y.D. Zhang, Y.N. Wang, X. Zhao, L. Zuo, and C. Esling: Texture and microstructure development in cold-rolled interstitial free (IF) steel sheet during electric field annealing. Scr. Mater. 48, 737 (2003).
12. X. Wang, W. Dai, R. Wang, X. Tian, and X. Zhao: Enhancedphase transformation and variant selection by electric current pulses in a Cu-Zn alloy. J. Mater. Res. 29, 975 (2014).
13. I.Sh. Valeev and Z.G. Kamalov: Structure evolution in copperresulting from the effect of powerful current pulses. J. Mater. Eng. Perform. 12, 272 (2003).
14. S.V. Dobatkin, G.A. Salischev, A.A. Kuznetsov, and T.N. Konkova: Submicrocrystalline structure in copper after different severe plastic deformation schemes. Mater. Sci. Forum 558–559, 189 (2007).
15. H. Knoepfel: Pulsed High Magnetic Fields (North-Holland Publishing Company, Amsterdam, Netherlands, 1970), p. 392.
16. T. Konkova, S. Mironov, A. Korznikov, and S.L. Semiatin: Onthe room-temperature annealing of cryogenically rolled copper. Mater. Sci. Eng., A 528, 7432 (2011).
17. J. Pospiech and K. Lucke: The rolling texture in copper anda-brass discussed in terms of the orientation distribution function. Acta Mater. 23, 997 (1975).
18. F.H. Constable: Spectrophotometric observations on the growth ofoxide films on iron, nickel, and copper. Proc. R. Soc. London, Ser. A 117, 376 (1928).
FIG. 2. Typical low-magnification images of specimens pulsed at (a) relatively high integral current (Kj ≥ 0.44 x 10⁵ A2 s mm-4) and (b)
relatively low integral current (Kj ≤ 0.34 x 10⁵ A2 s mm-4). In (b), the arrows indicate the HAZ. For clarity, the location of the ECP electrodes
during pulsing is superimposed on the specimens. Note: The pulsed specimens were chemically etched to reveal the microstructure.
[image:8.585.51.548.379.496.2]FIG. 3. Microhardness maps for specimens pulsed at (a) relatively high integral current (Kj 5 0.77 105 A2 s mm4) and (b) relatively low integral
current (Kj 5 0.25 105 A2 s mm4). In (b), arrows indicate the HAZ. For clarity, the location of the ECP electrodes during pulsing is superimposed
on the specimens.
[image:9.585.56.545.323.583.2]FIG. 5. Selected portions of EBSD grain-boundary maps showing the typical microstructure in (a) the central part of the HAZ of the pulsed material and (b) the material statically recrystallized at 300 °C for 1 h.6 In the maps, red, black, and gray lines depict LABs, HABs, and R3 twin boundaries
FIG. 6. (a) Effect of integral current on the mean grain size and (b) the fraction of LABs and R3 twin boundaries in the central part of the HAZ of the pulsed material. In all cases, data at Kj 5 0 represent the original cryorolled material.
FIG. 7. Selected portions of EBSD grain-boundary maps illustrating grain structure distribution in the HAZ of the material pulsed at Kj = 0.77 x 10⁵
A2 s mm-4. In the maps, red, black, and gray lines depict LABs, HABs, and R3 twin boundaries (within a 5° tolerance), respectively. Note: The
[image:11.585.57.544.269.565.2]TABLE I. Microstructure distribution in the HAZ.
Mean grain size 6 standard deviation (lm) Area fraction of grain boundaries (%)
Microstructure region in Fig. 7 Including twins Excluding twins LABs Σ3a
Region 1 1.3 ± 1.1 3.7 ± 3.9 4 43
Region 2 1.6 ± 2.5 6.4 ± 6.5 6 44
Region 3 2.6 ± 2.3 6.5 ± 6.7 4 49
a
[image:12.585.48.550.234.320.2]Within Brandon’s tolerance.
TABLE II. Texture distribution in the H AZ.
Microstructure region in Fig. 7
Peak intensity of ODF (X random)
Brass Goss Cube-RD Cube Brass-R Dillamore (50; 30/60; 0)
Region 1 4.6 4.5 0.7 10.7 3.6 11.4 9.6 22.2
Region 2 4.9 7.9 2.5 9.4 3.2 16.6 14.9 20.6
Region 3 4.8 4.6 1.7 9.4 2.4 14.1 12.8 22.0
Volume fraction of main texture components (within 15° tolerance) (%)
Note: Dominant components are highlighted in gray.
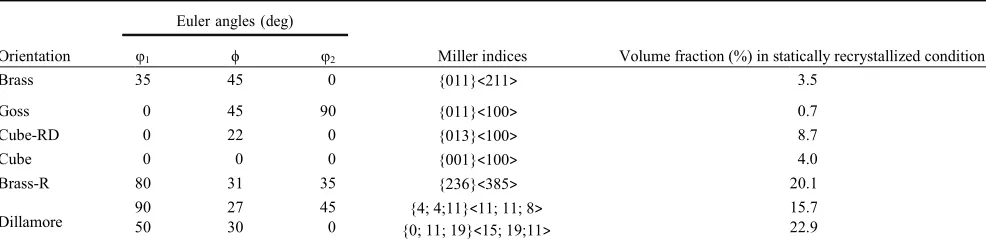
TABLE III. Volume fraction of different texture components in statically recrystallized, cryorolled copper.6
Orientation φ1 ϕ φ2 Miller indices Volume fraction (%) in statically recrystallized condition6
Brass 35 45 0 {011}<211> 3.5
Goss 0 45 90 {011}<100> 0.7
Cube-RD 0 22 0 {013}<100> 8.7
Cube 0 0 0 {001}<100> 4.0
Brass-R 80 31 35 {236}<385> 20.1
Dillamore 9050 2730 450 {0; 11; 19}<15; 19;11>{4; 4;11}<11; 11; 8> 15.722.9
Note: The texture component (50; 30; 0) was revealed during static recrystallization of cryogenically rolled copper.6 In contrast to other orientations shown in the table, it is not widely known, and thus has no descriptive name.
[image:12.585.52.545.369.491.2]given in Euler angles (Bunge notation).
FIG. 8. Orientation distribution functions showing typical texture in (a) the central part of the HAZ of the pulsed material and (b) in the material statically recrystallized at 300 °C for 1 h.6 For comparison purposes, several ideal orientations are superimposed on the ODFs. Arrows show (50;
30; 0) orientation.
[image:13.585.86.512.376.524.2]TABLE IV. The color and corresponding thickness of copper oxide films (after F.H. Constable18).
Color of film by reflected light
Thickness of homogeneous film of some color (Angstrom)
Dark brown 380
Red brown 420
Very dark purple 450
Very dark violet 480
Dark blue 500
Pale blue green 830
Pale silvery green 880
Yellowish green 970
Full yellow 980
Old gold 1110
Orange 1200
Red 1260
Note: The colors revealed in Fig. 10(a) are highlighted in grey.
FIG. 10. (a) Temper colors in the specimen pulsed at Kj = 0.80 x 10⁵ A2 s mm-4 and (b) relationship between integral current density and calculated
[image:14.585.66.541.327.546.2]FIG. 11. (a) EBSD grain-boundary map illustrating the grain structure at the moving front of the HAZ in Fig. 2(b) and (b) orientation distribution function for recrystallized grains in the selected area in (a). In the EBSD map, red, black, and grey lines depict LABs, HABs, and R3 twin boundaries (within a 5° tolerance), respectively. For comparison purposes, several ideal orientations are superimposed on the ODF in (b). Arrows in
[image:15.585.44.529.83.332.2]