199
Compaction behaviour of clay
A . TA R A N T I N O * a n d E . D E C O L †
This paper presents an experimental study of the com-paction behaviour of non-active clay. One-dimensional static compaction tests were carried out at high and medium water content with matric suction monitoring using Trento high-capacity tensiometers. At lower water contents, a transistor psychrometer was used to measure post-compaction suction. Samples were compacted on the dry side of optimum to cover a wide range of compaction water contents and vertical stresses. Three water content regions were identified in the compaction plane depend-ing on whether post-compaction suction increased, de-creased or remained constant as the degree of saturation was increased at constant water content. Hydraulic paths of specimens subjected to loading–unloading cycles at constant water content have clearly shown that post-compaction suction may increase as the degree of saturation increases. This non-intuitive behaviour was demonstrated to be associated with the coupling between mechanical and water retention behaviour. To this end, a coupled mechanical water retention model was formu-lated. Irreversible one-dimensional mechanical paths were modelled by a boundary surface in the space average skeleton vertical stress, modified suction and void ratio. Irreversible hydraulic ‘wetting’ paths were modelled by a boundary surface in the space suction, degree of satura-tion, and void ratio. This study was completed by investi-gating the pore size distribution of compacted samples through MIP tests.
KEYWORDS: clays; compaction; fabric/structure of soils; laboratory tests; partial saturation; suction
La pre´sente communication pre´sente une e´tude expe´ri-mentale du comportement au compactage de l’argile non active. On a effectue´ des essais de compactage statique monodimensionnels sur des argiles a` haute et moyenne teneur en eau, avec controˆle matric de l’aspiration, au moyen de tensiome`tres Trento de grande capacite´. En pre´sence de faibles teneurs en eau, on a utilise´ des psychrome`tres transistorise´s pour mesurer l’aspiration post compactage. On a soumis les e´chantillons a` un compactage optimal mais sec, dans une vaste gamme de teneurs en eau et de contraintes verticales. On a identifie´ trois zones de teneur en eau dans le plan de compactage, selon que l’aspiration post compactage augmentait, di-minuait ou restait constante au fur et a` mesure de l’augmentation du degre´ de saturation avec une teneur en eau constante. Les chemins hydrauliques de spe´cimens soumis a` des cycles de charge /de´charge, en pre´sence d’une teneur constante en eau, ont indique´ clairement que l’aspiration post compactage pouvait augmenter au fur et a` mesure de l’augmentation du degre´ de satura-tion. On a de´montre´ que ce comportement non intuitif e´tait en rapport avec l’accouplement entre le comporte-ment me´canique et de retenue de l’eau. A cette fin, on a formule´ un mode`le mixte me´canique /a` retenue d’eau, et on a mode´lise´ des chemins me´caniques monodimension-nels irre´versibles par une surface de se´paration dans la contrainte verticale d’ossature moyenne spatiale, l’aspira-tion modifie´e et l’indice de vide. On a mode´lise´ des chemins de « mouillabilite´ » hydraulique irre´versibles par une surface limite dans l’aspiration spatiale, le degre´ de saturation et l’indice de vide. Cette e´tude se termine par un examen de la distribution porome´trique d’e´chantillons compacte´s, par le biais d’essais MIP.
INTRODUCTION
Compaction has always been regarded as a process to ‘fabri-cate’ soils, and the state of soil after compaction has generally been assumed to be the ‘initial’ state of the soil in constitutive modelling. However, stress and phase variables evolve during the compaction process, and the soil after compaction is already characterised by a history of variation of stress and phase variables, which will affect the subsequent response of the soil. In the literature, very little information exists on soil behaviourduringthe compaction process.
A specific experimental programme was carried out invol-ving one-dimensional static compaction with matric suction monitoring throughout compaction. An attempt was then made to model the soil behaviour during compaction. Tarantino & Tombolato (2005) showed that post-compaction suction of
clayey specimens compacted at high water contents increased with increasing degree of saturation. This behaviour, which is not intuitive at first sight, was explained in a qualitative fashion by invoking the coupling between mechanical and water retention behaviour occurring during compaction. To corroborate this interpretation, experimental data were mod-elled by coupling a one-dimensional mechanical model with a water retention model. The mechanical model was formulated by combining features of the models presented by Wheeleret al. (2003) and Gallipoli et al. (2003b). The water retention model was formulated according to Gallipoliet al.(2003a).
One of the challenges of this work was to verify whether a single set of parameters could be used to model compac-tion behaviour over a wide range of compaccompac-tion water contents and compactive efforts. Tarantino & Tombolato (2005) suggested that kaolin samples compacted on the dry side of optimum are representative of the ‘same’ soil. How-ever, it is unlikely that the soil remains the ‘same’ over the entire range of compaction water contents. To gain a better insight into the microstructure of the compacted soil used in this investigation, and to address the question of whether the soil compacted to different vertical stress and water contents may or may not be considered the ‘same’, mercury intrusion porosimeter tests were carried out on kaolin samples com-pacted under different vertical stresses and water contents. Manuscript received 8 January 2007; revised manuscript accepted
10 November 2007.
Discussion on this paper closes on 1 October 2008, for further details see p. ii.
* Dipartimento di Ingegneria Meccanica e Strutturale, Universita` degli Studi di Trento, Italy.
BACKGROUND
Compaction water content and compactive effort are known to have a significant influence on the subsequent mechanical and hydraulic behaviour of compacted soils. A question that might be asked is which effects of compaction can be explained and modelled simply by variation in the initial compaction-induced state of the soil, and which effects can be represented only by considering soils pro-duced by different compaction procedures as fundamentally different materials (Sivakumar & Wheeler, 2000). Materials may be considered to be ‘different’ when characterised by different microstructure, which can be quantitatively investi-gated by mercury intrusion porosimetry, and considered to be the ‘same’ if their response can be modelled by a single set of soil parameters.
Soils compacted on the dry side of optimum (and at optimum water content) exhibit a bimodal intrusion volume frequency distribution, whereas soils compacted on the wet side of optimum are generally characterised by a single pore size mode (Ahmed et al., 1974; Delage et al., 1996). Soils compacted on the dry and wet side are then assumed to be fundamentally ‘different’, and this appears to be confirmed by their subsequent mechanical and hydraulic response. Gens at al. (1995) compacted specimens dry and wet of optimum and then brought them to the same condition in terms of dry density, water content and suction. Results show that the compaction-induced structure has a significant effect on the strains exhibited by the specimens during wetting. Mancuso et al.(2000) compacted two specimens at optimum and wet of optimum respectively. These specimens were brought to the same suction, and approximately the same degree of saturation was obtained. These two specimens were then compressed and sheared at constant suction, and significantly different responses were observed. Vanapalli et al. (1996) compared the water retention curve of samples compacted dry and wet of optimum, which were first saturated and then dried in a pressure plate. The different suction–degree of saturation relationships they observed cannot be explained by the different initial void ratios, and are likely to be associated with the different microstructure: aggregate-dominated fabric for the soil compacted on the dry side, and matrix-dominated fabric for the soil compacted on the wet side (Delageet al., 1996).
In contrast, soils compacted on the dry side of optimum at different water contents and compactive effort (including soils compacted at optimum that share the same double porosity structure) often exhibit a mechanical and hydraulic response that may be explained in terms of the initial compaction-induced state. The different water retention curves determined by Vanapalli et al. (1996) for samples compacted on the dry side and at optimum water content can indeed be explained by the different initial compaction-induced void ratio. Tarantino & Tombolato (2005) also found that the suction–degree of saturation relationship for samples compacted on the dry side over a broad range of water content and compactive efforts can be modelled by a single set of parameters, provided the effect of compaction-induced void ratio on water retention behaviour is accounted for. Barrera (2002) found that samples compacted at differ-ent water contdiffer-ents and isotropic pressures on the dry side of optimum could be modelled by a single set of elasto-plastic parameters.
Sivakumar & Wheeler (2000) tested two series of samples compacted on the dry side of optimum (Series 1 and 2 in their paper), and interpreted the different position of the normal compression lines in terms of different microfabric. It should be noted, however, that the two series of samples have different compaction-induced degrees of saturation, and the different positions of the normal compression lines can
alternatively be explained if the independent effect of degree of saturation on mechanical behaviour is accounted for. Gallipoliet al. (2003b) showed that, at the same suction, the higher the degree of saturation, the stiffer is the soil in the net stress–void ratio plane during virgin loading. This is exactly the response observed in samples from Series 2, which had compaction-induced degrees of saturation higher than samples from Series 1.
The pore size frequency distribution may be used to inspect the soil microstructure and to infer whether two samples compacted under different conditions on the dry side of optimum may be considered to be representative of the ‘same’ soil. In this respect, it is instructive to analyse the evolution of the pore size distribution of samples compacted to the same water content and compactive effort and then subject to drying. Cuisinier & Laloui (2004) compacted a silt on the dry side of optimum (double-porosity structure) and then dried the soil using the axis-translation technique. They observed that drying induced a strong reduction of the macropore volume and a corresponding increase of the micropore volume. Nonetheless, the large pore and small pore modes remained nearly unchanged. The same experi-mental evidence is provided by Simms & Yanful (2002) testing London Till and Regina Clay, at least for suctions lower than 1400–2000 kPa. As a result, if we assume that the soil compacted at given water content and compactive effort remains the ‘same’, at least over a suction range, we should accept that changes in micro- and macropore volumes may take place at nearly constant micro- and macropore modes.
EXPERIMENTAL EQUIPMENT Trento high-capacity tensiometer
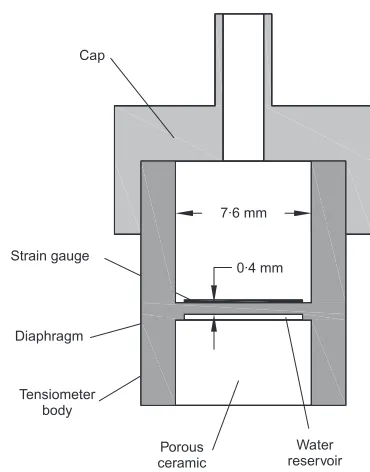
The Trento high-capacity tensiometer (Fig. 1) was used to measure matric suction (Tarantino & Mongiovı`, 2002). The tensiometer was calibrated in the positive range 0–1500 kPa with a measured standard deviation of accuracy of1.5 kPa. It was assumed that calibration could be extrapolated into the negative range according to the results by Tarantino & Mongiovı` (2003).
Water reservoir Porous
ceramic Tensiometer
body Diaphragm Strain gauge
Cap
7·6 mm
[image:2.595.338.523.526.762.2]0·4 mm
Fig. 1. Schematic layout of Trento tensiometer
Oedometer cell for static compaction tests
The soil was statically compacted in the apparatus shown in Fig. 2. It consists of an oedometer cell, a loading pad and a pneumatic actuator. The oedometer cell was made im-permeable at its base by inserting a stainless steel sheet between the base and ring. Two holes were machined into the loading pad to install two tensiometers. An O-ring was positioned in the tensiometer hole to avoid evaporation of soil water from the measurement area. Tensiometers were kept in place by small caps (not shown in the figure), which
were tightened to the pad by means of three screws. A membrane obtained by cutting and pasting nitrile elastomer Bellofram rolling diaphragms was used to seal the annular gap between the loading pad and the oedometer ring. The membrane attachment was designed to minimise the volume of air enclosed by the membrane. A sphere was interposed between the loading pad and the ram to ensure that no moments were transferred to the loading pad.
The apparatus was equipped with a load cell for measur-ing the vertical force (2000 N capacity with a measured standard deviation of accuracy of 3 N) and one potenti-ometer displacement transducer for measuring the vertical displacements (34 mm travel with measured standard devia-tion of accuracy of 0.01 mm). An electrovalve connected to the laboratory air supply system was used to control air pressure in the pneumatic actuator. The oedometer ring had a diameter of 100 mm and height of 40 mm.
Transistor psychrometer
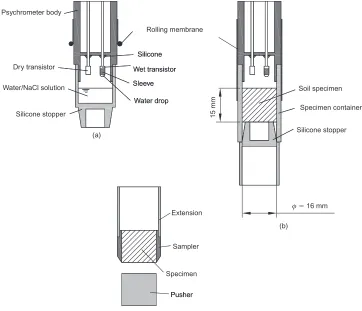
Total suction measurements were carried out using the transistor psychrometer shown in Fig. 3 (Woodburn et al., 1993; Bulut & Leong, in press). The original psychrometer probe was modified to improve measurement accuracy. The gap between the transistor shaft and the hole in the upper base of the measurement chamber was sealed with silicone. The plastic cap containing the filter paper discs saturated with NaCl solution used to calibrate the probe was replaced by a silicone stopper filled with free NaCl solution (Fig. 3(a)). The tape used to seal the gap between the psychrom-eter body and the cup containing the sample was replaced by a rolling membrane obtained by cutting silicone glove fingers (Fig. 3(b)). The plastic sampler was replaced by a stainless steel sampler with removable extension to cut and trim ‘hardened’ clay specimens (Fig. 3(c)).
φ⫽100 m
w⫽const.
O-ring
40 mm
Oedometer base Stainless steel sheet Oedometer ring
Loading pad Rolling membrane Tensiometer
Load cell Pneumatic
actuator Electrovalve
[image:3.595.49.277.52.276.2]Displacement transducer
Fig. 2. Schematic layout of oedometer cell for static compaction
Sleeve Psychrometer body
Wet transistor
Water drop Silicone
Rolling membrane
Water/NaCl solution
Silicone stopper
Sleeve Dry transistor Wet transistor
Water drop Silicone
Extension
Sampler
Pusher Specimen
Pusher
Soil specimen
Specimen container
Silicone stopper
φ⫽16 mm
15 mm
(a)
(b)
(c)
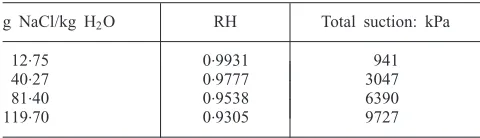
[image:3.595.108.470.439.750.2]Calibration was carried out by exposing the psychrometer probe to NaCl solutions of given concentration. A pipette was used to control the volume of the water drop to be placed on the wet bulb transistor (16l). Another pipette was used to control the volume of NaCl solution in the silicone stopper to ensure that the distance between the solution free surface and the probe was the same as the distance between the specimen surface and the probe. The relationships suggested by Romero (1999) were used to infer relative humidity from NaCl tration and total suction from relative humidity. NaCl concen-trations used to calibrate the psychrometer probes are given in Table 1. Calibration was performed with the probes inserted in a thermally insulated container, placed in turn in a room with air temperature controlled to 200.58C. Prior to calibration, the transistor probes were equilibrated overnight at zero total suction by exposing the transistors to demineralised water.
Each of the two probes used in the present investigation was calibrated five times over a period of 4 months, and the calibration curve for each sensor was obtained by using all data from these five calibrations. Standard deviations of the error in total suction measurement˜ł ¼ 200 kPa and˜ł
¼ 230 kPa were obtained respectively.
Mercury intrusion porosimeter (MIP)
MIP tests were carried out using a low-pressure CE Instruments Porosimeter Pascal 140 (pressure range 0.13– 400 kPa corresponding to entrance pore size range 4– 12.4m assuming mercury contact angle of 1478) in con-junction with a high-pressure Carlo Erba Porosimeter 2000 (pressure range 0.1–200 MPa corresponding to entrance pore size range 0.008–16m assuming mercury contact angle of 1478). The minimum pressure build-up rate for the Porosi-meter 2000 was about 2 MPa/min. Blank tests were per-formed for the two porosimeters to correct errors associated with system compressibility and temperature effects.
To freeze-dry specimens for MIP, liquid isopenthan (1608C melting point) was used in conjunction with liquid nitrogen (1898C boiling point). Drying was carried out using a lyophiliser, where sublimation occurred under abso-lute gas pressure of 5 Pa at the temperature of508C.
MATERIAL AND SPECIMEN PREPARATION
Speswhite kaolin with plastic limit wP ¼ 0.32 and liquid
limit wL ¼ 0.64 was chosen for the tests presented in this
paper. The grain size distribution showed it to have 0.20 silt fraction and 0.80 clay fraction.
Samples were prepared according to the procedure de-scribed by Tarantino & Tombolato (2005). Dry powdered kaolin was laid in a large plastic basin in layers of about 10 mm, and each layer was sprayed with demineralised water to reach the target water content. The moistened powder was hand-mixed, and saturated lumps were cut using four spatu-las attached together. The material was sieved through a 1 mm aperture sieve to reduce the aggregate size. This size was considered acceptable when compared with the 20– 25 mm specimen height. The moistened powder was
wrapped inside two sealed plastic bags, placed in a plastic container, and stored in a high-humidity room for at least 7 days.
For the compaction tests, the powder was placed in the oedometer and then compressed at a loading rate of 5 kPa/ min. For suction measurement using the transistor psychrom-eter, the powder was placed in the oedometer and then compressed to a given vertical pressure (300, 600, 900 or 1200 kPa) at a loading rate of 5 kPa/min. The sample was removed from the oedometer and a specimen was trimmed to 16 mm diameter and 15 mm height using the sampler shown in Fig. 3(c).
For the MIP tests, specimens were prepared according to the procedure discussed by Delage & Pellerin (1984). Liquid nitrogen was poured into a polystyrene box and, after boiling stopped, an aluminium container provided with a handle was immersed in the liquid nitrogen. After thermal equilibration, the container was removed from the nitrogen, filled with isopenthan, and rapidly re-immersed in the nitrogen. When the isopenthan started freezing at the contact with the wall of the container, a piece of soil of about 30–50 mm3 obtained by breaking the compacted sample was immersed in the isopenthan still liquid at the centre of the container. After about 10 s, the frozen sample was removed from the isopenthan and immersed in nitrogen for storage before lyophilising.
The frozen sample was then placed in a small plastic container previously cooled in nitrogen, which was covered with pierced plastic film and placed in the lyophiliser for 24 h. To verify that lyophilising time was adequate, one sample after lyophilising was oven-dried at 1058C for 48 h and a negligible change in mass was observed (,0.001 g). The freeze-dried soil sample was stored under vacuum by placing the plastic container in a vacuum plastic bag.
EXPERIMENTAL PROCEDURE Static compaction tests
The kaolin powder was placed in the oedometer ring up to its height (40 mm). After placing the loading pad on the powder, a vertical stress of 150 kPa was applied, and the membrane was set in place. Tensiometers were installed after applying a soil paste to the porous ceramic, and were allowed to equilibrate for typically 1–2 h. Prior to measure-ment, tensiometers were conditioned according to the proce-dure described by Tarantino (2004).
The loading path involved loading–unloading cycles to 300, 600, 900 and 1200 kPa (Fig. 4). The total vertical stress
[image:4.595.315.554.589.741.2]v was increased or decreased at the constant rate of 5 kPa/
Table 1. Concentrations of NaCl solutions used to calibrate psychrometer probes
g NaCl/kg H2O RH Total suction: kPa
12.75 0.9931 941
40.27 0.9777 3047
81.40 0.9538 6390
119.70 0.9305 9727
V
e
rtical stress
,
: kP
a
σv
0 150 300 450 600 750 900 1050 1200
Tensiometer insertion
d / dσ t⫽5 kPa/min
1 2
3 4
5
6 7
8
9 10
11
12
0 400 800 1200 1600
[image:4.595.56.296.707.776.2]Time: min
Fig. 4. Loading path in compaction tests. Numbers indicate first loading (1, 2, 5, 8, 11), unloading (3, 6, 9, 12) and reloading (4, 7, 10) vertical stresses
min, and each applied vertical stress was maintained con-stant for 30 min. The states of the specimen under quasi-zero vertical stress (14 kPa) were assumed to correspond to the states referred to as ‘as compacted’ in the literature. This state will be referred to as ‘post-compaction’ in this paper.
The loading rate was selected on the basis of preliminary tests carried out at loading rates of 20, 10 and 5 kPa/min. Fig. 5 shows two tests carried out at the loading rates of 5 and 20 kPa/min on specimens having water contents of 0.311 and 0.314 respectively. It can be seen that the matric suction changes at the end of the load increment or decre-ment for the test run at the loading rate of 20 kPa/min. In contrast, matric suction measured by the tensiometers did not exhibit discontinuities at a loading rate of 5 kPa/min, which was therefore considered adequate for testing. Load-ing rates slower than 5 kPa/min were not examined because they would have prolonged the test duration, thus increasing the risk of tensiometer cavitation.
After applying 150 kPa vertical stress, a calliper with 0.02 mm resolution was used to measure the distance be-tween the loading cap and a reference point. This made it possible to determine the initial height of the specimen. As the vertical displacement was monitored during the compac-tion process, the void ratio and hence the degree of satura-tion could be back-calculated at any stage of the test. As no drainage was provided during the test, water content re-mained constant during compaction and was measured at the end of the test.
Total suction measurements
The transistor probe was equilibrated overnight at zero total suction by exposing the transistors to demineralised water, and the output was adjusted to the initial zero read-ing. The specimen was placed in its container and the measurement chamber was assembled. The differential
volt-age output was continuously monitored, and the value re-corded after 1 h was related to total suction using the predetermined calibration curve.
Porosimeter tests
The soil sample, inserted in the dilatometer, was placed in the low-pressure porosimeter. After evacuation at 10 Pa absolute pressure, mercury was allowed to fill the dilat-ometer and was then intruded into the pores at the maximum pressure, 400 kPa. After removing the vacuum, the dilat-ometer was moved to the high-pressure porosimeter, where mercury was intruded at the maximum pressure of 200 MPa. Pressure was increased at a constant rate of about 2 MPa/ min and decreased at a constant rate of 6 MPa/min. Intrusion pressure was recorded, together with the volume of mercury intruded, and data were corrected using the blank test.
RESULTS OF COMPACTION TESTS
Compaction tests with continuous suction monitoring were carried out at seven different water contents: 0.215, 0.236, 0.254, 0.259, 0.275, 0.299 and 0.311. The compaction test at water contentw¼0.254 is shown in Fig. 6. The mechanical path is represented in terms of void ratio e against vertical total stress v. An irreversible virgin compression path and ‘reversible’ unloading–reloading paths (e.g. 2!3 and 3!4) can be clearly recognised. After every unloading–reloading cycle, the void ratio promptly recovered the virgin compres-sion curve.
The hydraulic path is represented in terms of degree of saturationSr against matric suctions. When the soil was first
compacted under constant water content, the soil was experi-encing the highest degrees of saturation and was therefore subjected to ‘main wetting’. The implicit assumption throughout this paper is that an increase in saturation due to
0 150 300 150 300 450
Tensiometer insertion
0 150 300 150 300 450
dσ√dt⫽20 kPa/min
1 1
2 2
Ma
tric suction,
: kP
a
s
V
e
rtical stress
,
: kP
a
σv
0 100 200 300
Time: min (a)
Tensiometer insertion
dσ√dt⫽5 kPa/min
0 100 200 300
[image:5.595.65.516.452.752.2]Time: min (b)
compression at constant water content is equivalent to in-creasing water content at constant void ratio according to Tarantino & Tombolato (2005).
Unloading and reloading paths (e.g. 2!3 and 3!4) caused the degree of saturation to decrease and increase respectively along ‘scanning’ curves. These scanning paths are essentially reversible. However, the suction recorded prior to unloading (e.g. point 8) is higher than the suction recorded at the end of the unloading–reloading cycle (e.g. point 10).
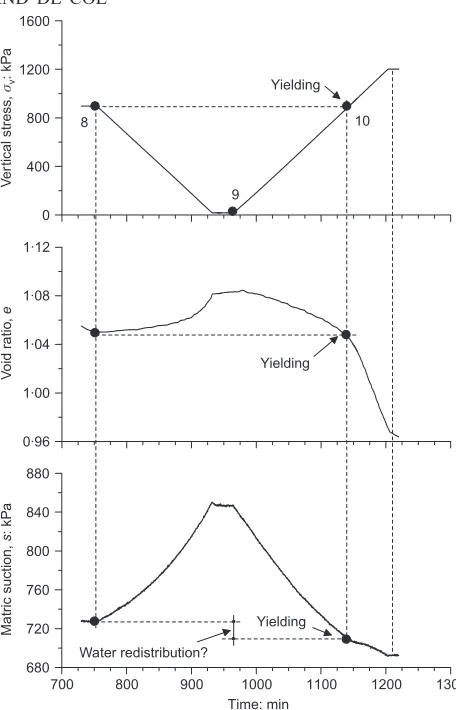
This behaviour is better illustrated in Fig. 7, where void ratio and suction changes upon an unloading–reloading cycle are plotted against time. Yielding occurred when the maximum past vertical stress was exceeded and void ratio was brought to values lower than the past minimum void ratio. At yielding, the suction was lower than the past minimum suction. This decrease in suction may be asso-ciated with redistribution of water between micro- and macropores, which occurred at nearly constant void ratio during the unloading–reloading cycle, or perhaps when the vertical stress was kept constant at quasi-zero vertical stress for 30 min. As a result, the ‘main wetting’ path would not represent states of full equilibrium. Apparently, water redis-tribution and meniscus rearrangement did not significantly affect the soil structure, as no change in yielding vertical stress was observed.
Another evidence of the dynamics of menisci is shown in Fig. 8, where the initial stage of loading is represented. When the vertical stress was initially increased by about 20 kPa (from 143 to 163 kPa) no significant volume change
was observed. This increase in preconsolidation vertical stress occurred after the specimen remained for 90 min under a vertical stress of 143 kPa. It is reasonable to assume that, during this time, menisci formed/rearranged within the pore space. It is interesting to note that the initial vertical stress increment (20 kPa) caused a change in matric suc-tion without any change in void ratio and hence degree of saturation. This would suggest that the vertical load incre-ment was initially carried on by menisci at inter-aggregate contacts, and that the subsequent change in void ratio oc-curred after ‘rupture’ of these menisci. These data would support the common assumption that meniscus water has ‘bonding’ effects on the soil skeleton (Jommi, 2000; Galli-poli et al., 2003b; Wheeleret al., 2003).
Post-compaction states are plotted in Fig. 9 in terms of dry density and compaction water content. This figure includes the states of the soil in the oedometer cell at quasi-zero vertical stress (14 kPa) and the states of the samples compacted in the oedometer cell and subsequently removed for total suction measurement using the transistor psychrom-eter. Samples for total suction measurement were compacted at vertical stress of 300, 600, 900 and 1200 kPa and nominal water contents of 0.08, 0.10, 0.12, 0.14 and 0.18. It can be seen that all data lie on the dry side of optimum. As discussed by Venkatarama Reddy & Jagadish (1993), it is not possible to compact soils statically on the wet side of optimum.
Matric or total suction was measured on each sample plotted in Fig. 9, and contours of equal suction are shown in Fig. 10 together with the numerical values of suction in kPa. Matric and total suction measurements are not differentiated. Matric suction, : kPa
(b)
s
0·3 0·4 0·5 0·6 0·7
Deg
ree of
sa
tur
a
tion,
Sr
Vertical stress, : kPa (a)
σv 0·8
1·0 1·2 1·4 1·6 1·8 2·0
V
o
id r
a
tio
,
e
1
2 4 3
6
9
5 7
8 10
11 12
1
2 3
4
5 6
7
8 9
10 11
12
0 400 800 1200 1600
[image:6.595.63.291.44.395.2]600 700 800 900
Fig. 6. Compaction test for specimen havingw 0.254: (a) void ratio against vertical stress; (b) degree of saturation against matric suction (the dashed line joins the states before unloading, 2–5–8–11)
680 720 760 800 840 880 0·96 1·00 1·04 1·08 1·12 0 400 800 1200 1600
Yielding Yielding
Yielding
8 10
9
Water redistribution?
700 800 900 1000 1100 1200 1300
Time: min
Ma
tric suction,
: kP
a
s
V
oid r
a
tio
,
e
V
e
rtical stress
,
: kP
a
[image:6.595.317.545.46.401.2]σv
Fig. 7. Void ratio and suction changes on an unloading– reloading cycle (specimen with w 0.254)
Galvani (2003) has shown that the osmotic component of suction is negligible for kaolin mixed with demineralised water.
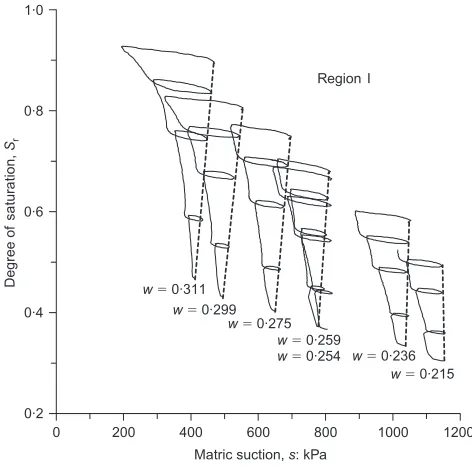
Contours of equal post-compaction suction reveal that the compaction plane can be divided into three regions. At water contents greater than 0.24 (region I), contours of equal post-compaction suction have positive slope: that is, post-compac-tion sucpost-compac-tion increases as degree of saturapost-compac-tion is increased at constant water content. At water contents lower than 0.24 (region II), contours of equal post-compaction suction have
negative slope: that is, post-compaction suction decreases as degree of saturation is increased at constant water content. At water contents lower than about 0.12–0.14 (region III), contours of equal post-compaction suction tends to become vertical: that is, post-compaction suction is not affected by soil density. The water content separating region II from region III, wm¼0.12–0.14, named the ‘microstructural
water content’ by Romero & Vaunat (2000), is consistent with the value wm¼0.14 back-calculated from shear
strength data by Tarantino & Tombolato (2005), the value wm ¼ 0.12 derived from the empirical equation suggested
by Romero & Vaunat (2000), and the MIP data as shown later in the paper.
The existence of regions II and III has already been demonstrated by Romero et al. (1999) and Barrera et al. (2000). Data shown in Fig. 10 suggest that a third region (region I) may exist in the compaction plane.
[image:7.595.50.268.49.388.2]The evidence that post-compaction suction may increase as the degree of saturation increases is clearly illustrated in Fig. 11, where the hydraulic paths for the seven compaction tests are plotted. The dotted lines joining the post-Time: min 760 770 780 790 800 810 Ma tric suction, : kP a s 1·4 1·5 1·6 1·7 1·8 1·9 V oid r a tio , e 100 150 200 250 300 V e rtical stress , : kP a σv 1 1 1 20 kPa 21 kPa
[image:7.595.306.532.57.224.2]90 100 110 120 130 140
Fig. 8. Initial stage of loading (specimen with w 0.254)
Sr⫽0·9
Sr⫽0·7
Sr⫽0·5
Sr⫽0·3
Sr⫽0·2 0·96 1·04 1·12 1·20 1·28 1·36 1·44
σv⫽1200 kPa
σv⫽900 kPa
σv⫽600 kPa
σv⫽300 kPa
MIP test Dr y density , ρd 3 : Mg/m
0 0·08 0·16 0·24 0·32 0·40
Water content,w
Fig. 9. Post-compaction dry density against water content of statically compacted kaolin. Dotted lines indicate contours of equal degree of saturation,Sr; circles indicate samples tested in mercury intrusion porosimeter
I
Water content,w
0·88 0·96 1·04 1·12 1·20 1·28 1·36 1·44 1·52 Dr s 400 kP a ⫽ 1000 kP a 1200 kP a 2000 kP a 5000 kP a
S⫽0·9
S⫽0·7
S⫽0·5
S⫽0·3
S⫽0·2
600 kP a 800 kP a 3000 kP a 432 446 462 471 550 693 1148 1046 2217 2698 2743 3850 4923 808 816 538 681 801 813 1014 1136 2963 3927 510 660 791 817 1030 1149 2021 2928 2344 3177 4377 5171 523 669 795 812 1015 1136 2056 2900 4954 II III y density , ρd 3 : Mg/m
0 0·08 0·16 0·24 0·32 0·40
1
Fig. 10. ‘Post-compaction’ suction data and contours of equal post-compaction suction. Solid lines refer to tensiometer meas-urements; dotted lines refer to psychrometer measurements
0·2 0·4 0·6 0·8 1·0
w⫽0·311
w⫽0·299
w⫽0·275
w⫽0·259
w⫽0·254 w⫽0·236
w⫽0·215 Region I Deg ree of sa tur a tion, Sr
0 200 400 600 800 1000 1200
Matric suction, : kPas
[image:7.595.46.278.430.604.2] [image:7.595.299.535.520.753.2]compaction states have positive slope at high water content, and tend to become vertical as compaction water content is reduced.
It is interesting to note that the degree of saturation always remained lower than 0.85, with the only exception of the last loading step on the specimen having the highest water content (w ¼ 0.311). At degrees of saturation less than 0.8–0.85 the air phase is likely to be continuous within the pore space. This assumption is corroborated by the tests carried out by Tarantino & Mongiovı` (2005) on the same material in a reconstituted state. If the air phase is contin-uous, no significant air overpressures are expected to build up upon loading. It was then assumed that air pressure remained close to the atmospheric value during the loading– unloading cycles.
The positive slope of the contours of post-compaction suction was explained by Tarantino & Tombolato (2005) by invoking the dependence of the ‘main wetting’ water reten-tion curve on void ratio. When the soil is compacted under constant water content to 600 kPa, the soil is experiencing the highest degrees of saturation and is therefore subjected to main wetting. After compression to 600 kPa vertical stress, the sample moves to point 5, situated on the main wetting curve associated with the void ratioein turn associated with the 600 kPa vertical stress (Fig. 12). Subsequent unloading causes a decrease in degree of saturation, and the resulting path is therefore a ‘scanning’ drying path to point 6. Reload-ing to a higher vertical stress first brReload-ings the specimen again to point 5 (5 7) along the ‘scanning’ wetting path. Then, as the previous vertical stress is exceeded, plastic compres-sion occurs and the main wetting curve moves upwards towards higher degrees of saturation. Since the main wetting curve represents the lower bound of the region of attainable states (Vaunatet al., 2000), it drags the specimen to point 8, situated on the curve corresponding to the void ratio e associated with the 900 kPa vertical stress.
[image:8.595.319.546.525.742.2]As shown in Fig. 12, the suction decrease during plastic compression (7!8) is less than that occurring if the soil skeleton were incompressible (79!89). As a result, the sub-sequent unloading to point 9 may bring the specimen to a suction that is higher than that recorded in 6 after unloading from the lower vertical stress.
Figure 12 assumes that mechanical and water retention behaviours are strongly coupled during compaction. To corroborate this assumption, an attempt was made to model compaction behaviour by formulating a mechanical–water retention coupled model.
MODELLING COMPACTION BEHAVIOUR Water retention model
To model ‘main wetting’ behaviour, data from the seven compaction tests lying on the main wetting paths (virgin compression) and having void ratios of 1.0, 1.2, 1.4, 1.6 and 1.8 were selected. These data are shown Fig. 13 in the plane suction s–degree of saturation Sr, and clearly show that
water retention curves are dependent on void ratio. These data were interpolated using the equation suggested by Gallipoliet al.(2003a) for the main wetting surface,
Sr¼
1 1þðełsÞn
m
(1)
whereeis the void ratio and,ł,mandnwere determined as best-fit parameters using the least-squares method. The main wetting curves at constant void ratio resulting from this interpolation are shown in Fig. 13 together with the experimental data. Psychrometer data are not included in Fig. 13, as these data do not belong to the main wetting surface. Psychrometer measurements were carried out on specimens after compaction, which are represented by point 6 in Fig. 12. The main wetting surface, which acts as lower boundary surface in the space suction, void ratio, and degree of saturation (Vaunat et al., 2000), is shown in Fig. 14.
To model ‘scanning’ behaviour, it was observed that scanning curves were fairly linear in the plane suction s– degree of saturation Sr, and that slopes were independent of
suction and degree of saturation (Fig. 15). The following equation was then used to model scanning behaviour:
Sr¼Sr0ksðss0Þ (2)
where s0 and Sr0 represent the point on the main wetting
surface from which the scanning curve detaches, and ks is
the slope of the scanning curve.
It is interesting to note that irreversible paths (main wetting paths) depend on void ratio, whereas reversible paths (scanning paths) appear to be independent of void ratio.
One-dimensional mechanical model
To model the virgin compression behaviour, an attempt was first made to select a suitable pair of generalised stress
Deg
ree of
sa
tur
a
tion
8⬘
9⬘
8
9
Post-compaction states
Main wetting curve (900 kPa)
e
Suction 6
5⫽7
Main wetting curve (600 kPa)
e
Fig. 12. Effect of void-dependent retention curve (‘main wet-ting’) on post-compaction suction (after Tarantino & Tombola-to, 2005)
Matric suction, : kPas
0·2 0·4 0·6 0·8 1·0
Deg
ree of
sa
tur
a
tion,
Sr
e⫽1·0
e⫽1·2
e⫽1·4
e⫽1·6
e⫽1·8
[image:8.595.63.287.573.739.2]0 400 800 1200
Fig. 13. Constant void ratio main wetting curves resulting from data interpolation (solid symbols, experimental data; dashed lines, extrapolation outside investigated suction range)
variables. Two pairs were examined according to Houlsby (1997): the net stress v and suction s, and the average skeleton stress v0 and modified suction s (Wheeler et al.,
2003). These latter variables are defined as
v0¼vþsSr
s ¼ns (3)
wherev is the total vertical stress,s is the suction,Sr is the
degree of saturation, and n is the porosity. Both these stress pairs can be extracted as work-conjugate stress variables from the rate of work input per unit volume of unsaturated soil, and the matter of adopting one or the other must be decided using criteria of convenience. Advantages in using
the average skeleton stress and modified suction are dis-cussed by Wheeleret al.(2003).
To represent the virgin loading surface using either pair of stress variables, only groups of void ratio data having approximately the same constant net stress were selected (average skeleton stress) and then plotted against suction (modified suction) as shown in Fig. 16.
Data in terms of net stress and matric suction (Fig. 16(a)) are not well ordered, whereas data in terms of average skeleton stress and modified suction (Fig. 16(b)) seem to define a regular surface in the space (v0,s,e). These latter
pairs of generalised stress variables were then used to model virgin compression following Wheeleret al.(2003).
To derive an equation for the one-dimensional virgin compression surface, tests on saturated specimens were first carried out. Specimens were compacted to 150 kPa vertical stress at constant water content and subsequently saturated by submersion with demineralised water. Experimental re-sults are shown in Fig. 17 for specimens compacted at water contents of 0.231, 0.294 and 0.303. All curves tend to converge at high vertical effective stresses. The dotted lines represent the virgin compression and the unloading lines having the equation
e¼ðN1D1Þ ºln9v
de¼ kd lnð 9vÞ (4)
where9v is the saturated effective stress, andN1D,º andk
are soil parameters. Saturated virgin compression could have also been represented by a power law. However, the logarith-1·1
1·2 1·3
1·4 1·5
1·6 1·7
1·8
e
0
200
400
600
800
1000
1200
s: kPa 1·0
0·9
0·8
0·7
0·6
0·5
0·4
0·3
[image:9.595.49.275.53.306.2]Sr
Fig. 14. Main wetting ‘lower boundary’ surface (interpolation data are plotted on the surface)
Matric suction, : kPas
0·2 0·4 0·6 0·8 1·0
Deg
ree of
sa
tur
a
tion,
Sr
[image:9.595.47.274.358.574.2]0 400 800 1200
Fig. 15. Compaction paths in the plane degree of saturation– matric suction. Dotted lines represent average scanning paths
0 400 800 1200
Modified matric suction, *: kPa (b)
s
1·0 1·2 1·4 1·6 1·8
0·8 1·2 1·6 2·0
V
o
id r
a
tio
,
e
0 400 800 1200 1600
Matric suction, : kPa (a)
s
V
oid r
a
tio
,
e
σv⫽190⫾6 kPa
σv⫽288⫾6 kPa
σv⫽434⫾6 kPa
σv⫽546⫾2 kPa
σv⫽717⫾5 kPa
σ⬙v⫽456⫾6 kPa
σv⬙⫽570⫾8 kPa
σv⬙⫽755⫾10 kPa
σv⬙⫽1006⫾4 kPa
[image:9.595.302.534.379.721.2]mic and power laws lead to the same accuracy in the stress range of interest for unsaturated modelling (9v ¼ 400–
1600 kPa).
In Fig. 16(b), data are replotted by scaling the modified suction s with the average skeleton stress v0and the void
ratio e with the void ratio in saturated conditions, es, at the
same average skeleton stress:
es¼ðN1D1Þ ºlnv0 (5)
All data appear to be consistent with a unique relationship (Fig. 18), which can be represented by the power function
e¼es 1þa s
v0
b
" #
(6) which involves only two additional parameters, a and b, apart from the parameters of the saturated model. Psychrom-eter data are not included in Fig. 18 because these data are associated with post-compaction states, which are not virgin loading states.
Equation (6) is plotted in Fig. 18, where it is compared with the experimental data. The virgin compression surface
defined by equation (6), which acts as upper boundary surface in the space average skeleton vertical stress, mod-ified suction, and void ratio is shown in Fig. 19.
To model unloading–reloading behaviour, it was observed that unloading curves were fairly linear in the plane (logv0,e)
and that their slope was independent of void ratio and average skeleton vertical stress (Fig. 20). In addition, this slope is consistent with the slope of the unloading line in saturated tests. The unloading–reloading behaviour was then repre-sented by the equation
de¼ kd lnð v0Þ (7)
This equation does not involve additional parameters apart from the parameter of the saturated model.
It is interesting to note that irreversible paths (virgin compression paths) depend on modified suction, which 0·6
0·7 0·8 0·9 1·0 1·1 1·2 1·3 1·4 1·5
wc⫽0·231
wc⫽0·294
wc⫽0·303
10 100 1000
Vertical effective stress,σ⬘v: kPa
V
oid r
a
tio
,
[image:10.595.59.291.48.258.2]e
Fig. 17. Oedometer tests on specimens compacted at different water contents and then saturated. Dotted lines represent virgin compression and unloading lines
1·2 1·6 2·0 2·4
V
o
id r
a
tio o
v
er ‘sa
tur
a
ted’ v
o
id r
a
tio
, /
e e
s
0 0·4 0·8 1·2 1·6
Modified matric suction over average skeleton stress, s*/σv⬙: kPa
Fig. 18. Void ratio (normalised to saturated void ratio) as a function of modified suction (normalised to average skeleton stress). Continuous line represents data interpolation by equa-tion (6)
2·0
1·8
1·6
1·4
1·2
1·0
e
400
500 600 700 800
900
1000
1200
1100
σ⬙v: kPa
200300 400500
600700 800
[image:10.595.319.552.54.279.2]s*: kPa
Fig. 19. Virgin compression boundary surface (interpolation data are plotted on the surface)
1000 0·8
1·0 1·2 1·4 1·6 1·8 2·0
V
oid r
a
tio
,
e
w⫽0·311
w⫽0·299
w⫽0·275
w⫽0·259
w⫽0·254
w⫽0·236
w⫽0·215
Average skeleton stress,σ⬙v: kPa
Fig. 20. Mechanical compression paths in the plane average skeleton stress–void ratio. Dotted lines indicate average unloading–reloading paths
[image:10.595.321.549.515.742.2] [image:10.595.64.289.565.733.2]accounts for the stabilising effects of menisci, as already suggested by Jommi (2000), Wheeler et al. (2003) and Gallipoliet al. (2003b). On the other hand, reversible paths (unloading–reloading paths) appear to be independent of modified suction, as also suggested by Wheeleret al. (2003) and Gallipoliet al.(2003b).
Modelling compaction behaviour
Using equations (1) and (6) to model irreversible paths and equations (2) and (7) to model reversible paths, compac-tion behaviour could be simulated by assuming constant water content and imposing the stress path shown in Fig. 4. Model parameters are summarised in Table 2.
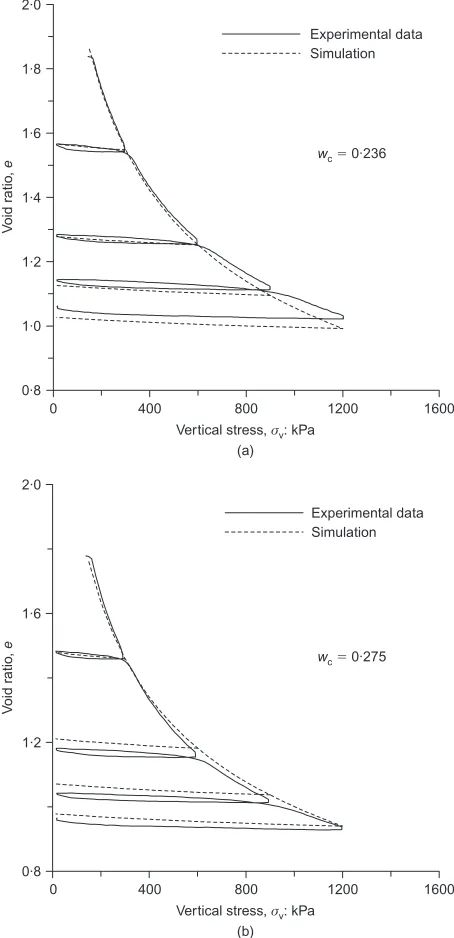
The simulation of hydraulic paths is shown in Fig. 21, and simulation of mechanical paths for two water contents is shown in Fig. 22. The fair agreement between simulation and experimental data is not surprising, as model parameters were calibrated using the same experimental data modelled in Fig. 21 and Fig. 22. However, three points are worth highlighting.
The coupled model correctly reproduces the positive slope of post-compaction lines and its progressive decrease as compaction water content decreases. This underlines the importance of coupling mechanical and water retention be-haviour in unsaturated soil constitutive models. Hydraulic paths shown in Fig. 21 cannot be simulated by the model of Alonso et al. (1990) or the models derived therefrom (Wheeler & Sivakumar, 1995; Cui & Delage, 1996; Rampi-no et al., 2000), as the hydraulic behaviour is modelled solely in terms of suction.
The coupled model presented in this paper, although limited to one-dimensional compression and ‘wetting’ and
‘scanning’ hydraulic paths, represents a step forward in the water retention–mechanical constitutive coupling as recently proposed in the literature. The model presented by Gallipoli et al. (2003b) has been validated using experimental values of degree of saturation, that is, without implementing a water retention model. The model presented by Wheeler et al. (2003) has been validated only from a qualitative stand-point.
Finally, the simulation of hydraulic paths is satisfactory for all compaction water contents with the exceptions of the tests at the lowest water content (w¼0.215). The discre-pancy between the experimental data and the simulation is in part justified by the inaccuracy of the model at high suctions owing to the low values of the derivative dSr/ds
[image:11.595.304.531.55.524.2](small errors in the void ratio, and hence in the degree of saturation, cause large errors in the predicted suction). Another possible reason is the change in the microstructure at lower water contents. This point is discussed in the next section.
Table 2. Model parameters
ł n m ks
0.004736 2.992 1.640 0.1970 0.00013
N1D º k a b
2.8587 0.1568 0.035 0.926 0.5374
Matric suction,sr: kPa 0·2
0·4 0·6 0·8 1·0
Deg
ree of
sa
tur
a
tion,
S
Experimental data Simulation
w⫽0·311
w⫽0·275
w⫽0·259
w⫽0·236
w⫽0·215
0 400 800 1200 1600
Fig. 21. Simulation of matric suction–degree of saturation paths. Thick lines join the ‘post-compaction’ state resulting from the simulation
Vertical stress, : kPa (a)
σv 0·8
1·0 1·2 1·4 1·6 1·8 2·0
V
oid r
a
tio
,
e
Experimental data Simulation
wc⫽0·236
0·8 1·2 1·6 2·0
Experimental data Simulation
0 400 800 1200 1600
wc⫽0·275
Vertical stress, : kPa (b)
σv
V
oid r
a
tio
,
e
0 400 800 1200 1600
[image:11.595.44.274.436.743.2]RESULTS OF MERCURY INTRUSION POROSIMETRY Samples tested in the mercury porosimeter tests are encircled in Fig. 9. For the sake of brevity, only samples encircled by solid lines are discussed in this section. Results of MIP tests on two samples compacted at the same water content (w¼0.259) and two different vertical stresses (600 kPa and 1200 kPa) are shown in Fig. 23 in terms of cumulative intrusion–extrusion volume and intrusion volume frequency.
The mercury intrusion–extrusion volume Vintruded=extruded
was made dimensionless by referring it to the volume of solids,Vs:
eMIP¼
Vintruded=extruded Vs
(8) The value of eMIP at the end of the intrusion stage can be
directly compared with the void ratio e determined in a traditional way by measuring the volume and water content of the sample from which the specimen for MIP was taken.
The pore entrance size d was determined from the intru-sion pressurepassuming pores of cylindrical shape:
d¼4THgcosŁ
p (9)
where THg¼0.48 N/m is the surface tension of mercury at
258C, andŁis the contact angle of the air/mercury interface at the junction with the kaolinite surface, which was as-sumed to be equal to 1478according to Diamond (1970). As suggested by Romero (1999), the frequency distribution was determined by calculating the incremental intrusion volume over pore size interval of constant width in the log scale (˜(logd)¼0.1).
From the cumulative intrusion volume in Fig. 23, it can be observed that e is slightly greater than eMIP (eMIP
0.95e), which suggests that the freeze-drying technique used for preparing specimens for MIP leads to minimum distur-bance of the pore structure. The gap between e andeMIP is
likely to be associated with the fraction of pore space not
intruded by mercury and the different amount of water removed by sublimation and oven-drying.
The intrusion volume frequency is bimodal—typical of soils compacted on the dry side of optimum (Delage et al., 1996, Romero et al., 1999). It is worth noting that an increase in the compaction vertical stress affects only the aggregate porosity with the modal size of the inter-aggregate pores shifting from 0.8m to 0.7m. The intra-aggregate porosity remains unchanged in both its modal size and volume (d¼0.13m).
The same conclusion can be drawn from the cumulative distribution if the non-constricted porosity is interpreted as a measure of intra-aggregate pore space according to Delage & Lefebvre (1984). The extrusion volumes of the two speci-mens are approximately the same and correspond to the same pore entrance size of about 0.18m, which can be assumed to delimit the region of inter-aggregate porosity from the region of intra-aggregate porosity. The cumulative distributions shown in Fig. 23 then suggest that the assump-tion made by Delage & Lefebvre (1984) holds fairly for the compacted kaolin tested in this programme.
Figure 24 shows the results of MIP tests on five samples compacted at the same vertical stresses (1200 kPa) and decreasing water contents (w¼0.311, 0.259, 0.215, 0.141 and 0.086). Also reported in the cumulative distribution is the water ratio ew of the sample from which the specimen
for MIP was taken, given by
ew¼wGs (10)
where w is the gravimetric water content and Gs is the
specific gravity. If ew is compared with the intra-aggregate
porosity (non-constricted porosity), it can be inferred that, at higher water contents, water fully saturates the intra-aggregate pores and partially fills the inter-intra-aggregate pores. At lower water contents water withdraws into the intra-aggregate pores, leaving the inter-intra-aggregate pores air-filled.
This corroborates the assumption that aggregates are saturated (at least over a range of water contents), often made in constitutive modelling of unsaturated soils having double-porosity structure (Gens & Alonso, 1992). Also, water is no longer present in the inter-aggregate pores at water contents lower than 0.141, which is the water content where contours of post-compaction suction become vertical in Fig. 10. As water fills only the intra-aggregate pores, suction is controlled only by intra-aggregate water, and is no longer affected by changes in soil density (inter-aggregate porosity). This mechanism has been suggested by Romero & Vaunat (2000), and the MIP data shown in Fig. 24 clearly support their interpretation.
The volume frequency distributions are shown in Fig. 25. Specimens with the higher water content (w¼0.311, 0.259 and 0.215) show two modal pore sizes at about 0.1–0.2m and 0.6–0.7m. As water content decreases, the modal sizes remain unchanged, but the intra-aggregate and inter-aggre-gate porosities redistribute. In particular, inter-aggreinter-aggre-gate porosity increases and intra-aggregate porosity progressively decreases. At lower water contents the intra-aggregate modal size eventually disappears (w¼0.141, and 0.086).
It may be then inferred that the microstructure remains essentially the same (bimodal with significant intra-aggregate porosity) over a relatively wide range of water contents, and this is consistent with the single set of parameters used to model compaction behaviour. According to the results by Simms & Yanful (2002) and Cuisinier & Laloui (2004), samples experiencing changes in micro- and macropore volumes without change in the micro- and macropore modes may reasonably be considered to be representative of the ‘same’ soil.
As water content decreases, the microstructure changes, in
Cumula
ti
v
e
intr
usion v
olume r
a
tio
,
eMIP
0 0·4 0·8 1·2
0 500 1000 1500
2000 w⫽0·259
σv⫽600 kPa
σv⫽1200 kPa
Intra-aggregate porosity
Inter-aggregate porosity
σv⫽600 kPa
σv⫽1200 kPa
e(1200 kPa)⫽0·993
e(600 kPa) ⫽1·136 Non-constricted
porosity
0·001 0·01 0·1 1 10 100
Intr
usion v
olume frequency
,
/
(lo
g
)
∆∆
edMIP
0·001 0·01 0·1 1 10 100
[image:12.595.61.292.495.742.2]Entrance pore size, : mdµ
Fig. 23. Comparing intrusion volume frequency ratios of sam-ples compacted at same water content and different vertical stresses
the sense that it evolves to a mono-modal pore size distribu-tion. This probably justifies the discrepancy observed be-tween the simulated and experimental hydraulic path at the water content of 0.215.
CONCLUSIONS
This paper has presented an experimental investigation of the static compaction behaviour of non-active clay. Post-compaction states of samples compacted on the dry side of optimum over a wide range of water contents and vertical stresses have been investigated, and three water content regions were identified. As the degree of saturation is in-creased at constant water content by the compaction process,
post-compaction suction increases at higher water contents (region I), decreases at medium water contents (region II), and remains constant at lower water contents.
Evidence of the positive slope of contours of post-compaction suction in the post-compaction plane at higher water contents (region I) has clearly been provided by the hydrau-lic paths followed by samples compacted at constant water content and subjected to loading–unloading cycles. This behaviour, which is not intuitive at first sight, has been demonstrated to be associated with the coupling between mechanical and water retention behaviour.
To this end, a coupled mechanical water retention model has been formulated. Irreversible one-dimensional mechani-cal paths were modelled by a boundary surface in the space 0
0·4 0·8 1·2
Intrusion
Extrusion
0 0·4 0·8 1·2
Intrusion
Extrusion
0 0·4 0·8 1·2
Intrusion
Extrusion
0 0·4 0·8 1·2
Intrusion
Extrusion
0 0·4 0·8 1·2
Intrusion
Extrusion Entrance pore size, : m
(a)
d µ
Cumula
ti
v
e
intr
usion v
o
lume r
a
tio
,
eMIP
⫽ e 0·965
ew⫽0·78
Intra-aggregate porosity
Inter-aggregate porosity
0·001 0·01 0·1 1 10 100
Entrance pore size, : m (b)
dµ
Cumula
ti
v
e
intr
usion v
o
lume r
a
tio
,
eMIP
⫽ e 0·993
ew⫽0·675
Intra-aggregate porosity
Inter-aggregate porosity
0·001 0·01 0·1 1 10 100
Entrance pore size, : m (c)
d µ
Cumula
ti
v
e intr
usion v
o
lume r
a
tio
,
eMIP e⫽1·049
ew⫽0·560
Intra-aggregate porosity
Inter-aggregate porosity
0·001 0·01 0·1 1 10 100
Entrance pore size, : m (d)
dµ
Cumula
ti
v
e intr
usion v
o
lume r
a
tio
,
eMIP e⫽1·14
ew⫽0·366
Intra-aggregate porosity
Inter-aggregate porosity
0·001 0·01 0·1 1 10 100
Entrance pore size, : m (e)
dµ
Cumula
ti
v
e
intr
usion v
o
lume r
a
tio
,
eMIP e⫽1·220
ew⫽0·223
Intra-aggregate porosity
Inter-aggregate porosity
[image:13.595.48.536.52.585.2]0·001 0·01 0·1 1 10 100
average skeleton vertical stress, modified suction and void ratio. Irreversible hydraulic ‘wetting’ paths were modelled by a boundary surface in the space suction, void ratio, and degree of saturation. The model correctly simulated the positive slope of contours of post-compaction suction and its decrease as the compaction water content decreases.
This study has been completed by investigating the pore size distribution of compacted samples through MIP tests. By interpreting the extruded mercury volume as a measure of intra-aggregate porosity, it has been shown that aggre-gates remain saturated and water fills the inter-aggregate pores at high and medium compaction water contents. At low water contents water fills only the aggregate pores, and this is consistent with post-compaction suction that is no longer affected by changes in soil density.
The pore size frequency distribution was shown to remain bimodal with significant intra-aggregate pore volume in the same range of water contents where compaction behaviour could be modelled using a single set of parameters. As compaction water content decreases, the pore size distribu-tion becomes mono-modal, and this may explain why the hydraulic path followed by the sample compacted at the lowest water content could not be correctly simulated.
ACKNOWLEDGEMENTS
The authors wish to thank Professor Roberto Dal Maschio for kindly allowing the use of the mercury intrusion porosi-meter. They also wish to thank Dr Christian Hoffmann for the helpful comments on the paper.
NOTATION
a, b parameters for one-dimensional normal compression in unsaturated state
d pore entrance size e void ratio
eMIP void ratio derived from mercury intrusion
porosimetry
es void ratio in saturated conditions at same average
skeleton stress ew water ratio
Gs specific gravity
k parameter for one-dimensional unloading–reloading in saturated state
k0, s0,Sr0 parameters in ‘scanning’ expression forSr
m, n,,ł parameters in ‘main wetting’ expression forSr
n porosity
N1D, º parameters for one-dimensional normal consolidation in saturated state
p mercury intrusion pressure s matric suction
s modified suction Sr degree of saturation
THg surface tension of mercury
w water content wL plastic limit
wm microstructural water content
wP liquid limit
Ł contact angle of air/mercury interface v vertical total stress
v0 vertical average skeleton stress ł total suction
REFERENCES
Ahmed, S., Lovell, C. W. & Diamond, S. (1974). Pore sizes and strength of compacted clay. J. Geotech. Engng Div. ASCE 100, No. GT4, 407–425.
Alonso, E. E., Gens, A. & Josa, A. (1990). A constitutive model for partly saturated soils.Ge´otechnique40,No. 3, 405–430. Barrera, M. (2002). Estudio experimental del comportamiento
hidro-meca´nico de suelos colapsables. PhD thesis, Universitat Polite`cnica de Catalunya, Barcelona, Spain.
Barrera, M., Romero, E., Lloret, A. & Gens, A. (2000). Collapse tests on isotropic and anisotropic compacted soils. In Experi-mental evidence and theoretical approaches in unsaturated soils: Proceedings of an international workshop(eds A. Tarantino and C. Mancuso), pp. 3345. Rotterdam: A. A. Balkema.
Bulut, R. & Leong, E. C. (0000) (in press). Indirect measurement of suction. Geotech. Geol. Engng, Special Issue on ‘Laboratory and Field Testing of Unsaturated Soils’.
Cui, Y. J. & Delage, P. (1996). Yielding and plastic behaviour of an unsaturated compacted silt.Ge´otechnique46,No. 2, 291–311. Cuisinier, O. & Laloui, L. (2004). Fabric evolution during
hydro-mechanical loading of a compacted silt. Int. J. Numer. Anal. Methods Geomech.28, No. 6, 483–499.
Delage, P. & Pellerin, F. M. (1984). Influence de la lyophilisation sur la structure d’une argile sensible di Que´bec.Clay Miner.19, No. 2, 151–160.
Delage, P., Audiguier, M., Cui, Y. J. & Howat, D. (1996). Micro-structure of a compacted silt.Can. Geotech. J.33, No. 1, 150– 158.
Diamond, S. (1970). Pore size distributions in clay. Clays Clay Miner.18, 7–23.
Gallipoli, D., Wheeler, S. J. & Karstunen, M. (2003a). Modelling the variation of degree of saturation in a deformable unsaturated soil.Ge´otechnique53, No. 1, 105–112.
Gallipoli, D., Gens, A., Sharma, R. & Vaunat, J. (2003b). An elasto-plastic model for unsaturated soil incorporating the effects of suction and degree of saturation on mechanical behaviour. Ge´otechnique53, No. 1, 123–136.
Galvani, A. (2003). Resistenza a taglio di un argilla non satura ricostituita in laboratorio. Laurea thesis, Universita` degli Studi di Trento, Italy.
Gens, A. & Alonso, E. E. (1992). A framework for the behaviour of unsaturated expansive clays.Can. Geotech. J.33,No. 1, 11–22. Gens, A., Alonso, E. E., Suriol, J. & Lloret, A. (1995). Effect of
structure on the volumetric behaviour of a compacted soil.Proc. 3rd Int. Conf. on Unsaturated Soils, Paris1, 83–88.
Houlsby, G. T. (1997). The work input to an unsaturated granular material.Ge´otechnique47, No. 1, 193–196.
Jommi, C. (2000). Remarks on the constitutive modelling of unsaturated soils. In Experimental evidence and theoretical ap-proaches in unsaturated soils: Proceedings of an international workshop (eds A. Tarantino and C. Mancuso), pp. 139–153. Rotterdam: A. A. Balkema.
Mancuso, C., Vassallo, R. & Vinale, F. (2000). Effects of moulding water content on the behaviour of an unsaturated silty sand. In Unsaturated Soils for Asia (eds H. Rahardjo, D. G. Toll and E. C. Leong), pp. 545–550. Rotterdam: A. A. Balkema.
Rampino, C., Mancuso, C. & Vinale, F. (2000). Experimental behaviour and modelling of an unsaturated compacted soil.Can. Geotech. J.37, No. 4, 748–763.
Romero, E. (1999). Characterisation and thermo-hydro-mechanical
Entrance pore size, : md µ
0 500 1000 1500 2000
Intr
usion v
olume frequency
,
/
(lo
g
)
∆∆
edMIP
w⫽0·311
w⫽0·259
w⫽0·215
w⫽0·141
w⫽0·086
[image:14.595.63.290.45.207.2]0·001 0·01 0·1 1 10 100
Fig. 25. Frequency mercury intrusion porosimeter tests of samples compacted at same vertical stress (óv 1200 kPa) but different water contents
behavior of unsaturated Boom clay: An experimental study. PhD thesis, Technical University of Catalonia, Spain.
Romero, E. & Vaunat, J. (2000). Retention curves in deformable clays. In Experimental evidence and theoretical approaches in unsaturated soils: Proceedings of an international workshop (eds A. Tarantino and C. Mancuso), pp. 91–106. Rotterdam: A. A. Balkema.
Romero, E., Gens, A. & Lloret, A. (1999). Water permeability, water retention and microstructure of unsaturated Boom clay. Engng Geol.54, Nos 1–2, 117–127.
Simms, P. H. & Yanful, E. K. (2002). Predicting soil-water char-acteristic curves of compacted plastic soils from measured pore-size distributions.Ge´otechnique52, No. 4, 269–278.
Sivakumar, V. & Wheeler, S. J. (2000). Influence of compaction procedure on the mechanical behaviour of an unsaturated com-pacted clay. Part 1: Wetting and isotropic compression. Ge´otech-nique50, No. 4, 359–368.
Tarantino, A. (2004). Panel report: Direct measurement of soil water tension. In Proc. 3rd Int. Conf. on Unsaturated Soils, Recife3, 1005–1017.
Tarantino, A. & Mongiovı`, L. (2002). Design and construction of a tensiometer for direct measurement of matric suction. In Proc. 3rd Int. Conf. on Unsaturated Soils, Recife1, 319–324. Tarantino, A. & Mongiovı`, L. (2003). Calibration of tensiometer for
direct measurement of matric suction. Ge´otechnique53, No. 1, 137–141.
Tarantino, A. & Mongiovı`, L. (2005). Development of an apparatus to investigate the stress variables governing unsaturated soil behaviour.Geotech. Test. J.28, No. 2, 151–160.
Tarantino, A. & Tombolato, S. (2005). Coupling of hydraulic and mechanical behaviour in unsaturated compacted clay. Ge´otechni-que55, No. 4, 307–317.
Vanapalli, S. K., Fredlund, D. G. & Pufhal, D. E. (1999). The influence of soil structure and stress history on the soil-water characteristics of a compacted till. Ge´otechnique 49, No. 2, 143–159.
Vaunat, J., Romero, E. & Jommi, C. (2000). An elastoplastic hydro-mechanical model for unsaturated soils. In Experimental evi-dence and theoretical approaches in unsaturated soils: Proceed-ings of an international workshop (eds A. Tarantino and C. Mancuso), pp. 121–138. Rotterdam: A. A. Balkema.
Venkatarama Reddy, B. V. & Jagadish, K. S. (1993). The static compaction of soils.Ge´otechnique43, No. 2, 337–341
Wheeler, S. J. & Sivakumar, V. (1995). An elasto-plastic critical state framework for unsaturated soil. Ge´otechnique 45, No. 1, 35–53.
Wheeler, S. J. & Sivakumar, V. (2000). Influence of compaction procedure on the mechanical behaviour of an unsaturated com-pacted clay. Part 2: Shearing and constitutive modelling. Ge´o-technique50, No. 4, 369–376.
Wheeler, S. J., Sharma, R. S. & Buisson, M. S. R. (2003). Coupling of hydraulic hysteresis and stress–strain behaviour in unsatu-rated soils.Ge´otechnique53, No. 1, 41–54.