fluid-loaded microplates
Zhangming Wu, Mike T Wright, Xianghong Ma
Biomedical Engineering Research Group, Aston University, Birmingham B4 7ET, UK
E-mail: [email protected]
Abstract. An experimental testing system for the study of dynamics behavior of fluid-loaded rectangular micromachined silicon plates is designed and presented in this paper. In this experimental system, the base excitation technique combined with Pseudo-Random signal and cross-correlation analysis is applied to test fluid-loaded microstructures. Theoretical model is also derived to reveal the mechanism of such experimental system in the application of testing fluid-loaded micro-structures. The dynamic experiments cover a series of testings of various microplates with different boundary conditions and dimensions, both in air and immersed in water. This paper is the first work that demonstrates the ability and performances of base excitation in the application of dynamic testing of microstructures that involves a natural fluid environment. Traditional modal analysis approaches are used to evaluate natural frequencies, modal damping and mode shapes from the experimental data. The obtained experimental results are discussed and compared with theoretical predictions. This research experimentally determines the dynamic characteristics of the fluid-loaded silicon microplates, which can contribute to the design of plate based microsystems. The experimental system and testing approaches presented in this paper can be widely applied to the investigation of the dynamics of microstructures and nanostructures.
1. Introduction
Experimental investigation of dynamic behaviours of microstructures plays a fundamental role in the field of MEMS, and is especially useful in preliminary testing and verification of the design principles of microsystems. The experimental evaluation of dynamic characteristics also become very necessary in determining the natural vibration response of microstructures and validation of theoretical models [17]. However the dynamic testing of a micro scale structure always involves great challenges, as it lacks direct approaches of excitation and measurement[9]. The mechanical resonant frequencies of microstructures are typically in the range from kHz to MHz, and even GHz[17], and the traditional modal analysis facilities are difficult to excite and measure responses at such high frequencies. Moreover, due to the miniature dimensions it is difficult to directly apply the physical external loads or attach extra sensing element on the testing microstructures. Therefore conventional excitation tools (such as electric shaker and hammer) and mechanical sensors (like accelerometer), which are commonly used in the modal testing of macro-structures, are not appropriate for microstructures. Consequently alternative excitation and measurement techniques and tools have been developed for the dynamic testing of microstructures.
In general, the following excitation approaches have been used in testing the microstructures: (1)Electrostatic actuation[12, 4, 28]. It was extensively applied to drive MEMS devices with integrating electrodes on the surface of microstructures. (2)Piezoelectric actuation. Piezoelectric materials such as aluminum nitride (AlN), zinc oxide (ZnO) and Lead zirconate titanate (PZT) are widely applied as MEMS actuators due to their unique advantages of large actuation force and low power consumption [20, 31, 30]. (3)In the cases of actuation desiring large force and large displacement [13], electromagnetic method can be adopted to excite microstructures by implanting magnetic materials within the actuators [33]. However, the low frequency bandwidth limits its applications in stimulation of microstructures[17]. (4)Other techniques including electrothermal excitation[6, 8] and acoustic excitation[1] have also been applied to drive microstructures for dynamic testings.
from the facility and environment can be reduced. Nevertheless the dynamics testing of microstructures involving a fluid environment using base excitation has not been reported before this work.
Non-contact measurement and high frequency excitation are desired to measure the vibrational frequency responses of microstructures. The Laser Doppler Vibrometer (LDV) is one of the most popular non-contact device and had been extensively used in the experimental dynamic analysis of microsystems[27]. When one apply LDV in a microsystem, the laser beam is usually projected on the surface of objects through a microscope and the size of focused laser spot can be reduced to as small as 1µm. Therefore LDVs are capable to provide highly accurate point measurement on the motion of microstructures.
The choice of input excitation is important as it determines the experimental accuracy and efficiency in the dynamic testings of structures. The most commonly used excitation signals for modal analysis are random, pseudo random, burst random, sine chirp and stepped sine [2]. As the fluid-loaded isotropic microplate is a fairly linear system pseudo-random excitation is employed in the dynamic experiments. Pseudo-random signal is naturally a set of frequency spectral lines over a wide frequency band [2] and has almost the same properties as white noise in terms of covariance function. Lowrey has demonstrated that when employing pseudo-random excitation signals and cross-correlation identification method in the dynamic analysis of plate systems, there are the advantages of noise immunity, small amplitude disturbances and the avoidance of resonance excitation[19]. Rufer et al [26] also presented a Built-In-Self-Test implementation for the mechanical and thermal characteristics evaluation of cantilever MEMS structures through using pseudo-random sequence to simulate the impulse excitation. Due to the ergodic, repetitious and deterministic nature of pseudo-random signals the testing system can achieve a deterministic response over a wide frequency band, which is ideal for the scanning measurements of microstructures.
The aim of dynamic analysis of a structure is mainly to determine each vibrational mode, which is always characterized by natural frequency, damping ratio and mode shape. Curve fitting methods[24] are usually applied to extract the modal parameters from one or a set of measured data. A detailed dynamic theory and modal parameter estimation methods for base excitation were developed and presented by Beliveau
In the experiment system designed for the dynamic testing of fluid-loaded microplates, an ultrasonic transducer is used for base-excitation and the micro scanning laser vibrometer (Polytec MSV-400) is used to record the vibration signal of the microplate. MSV-400 Vibrometer is developed specially for the vibrational analysis of MEMS devices, and its fast, accurate and non-contacting properties makes it an ideal tool for studying micro structure dynamics. MSV-400 can achieve picometer vibration resolution and up to 20 MHz bandwidth.
This paper first presents the apparatus design of the base-excitation experiments on the dynamics testing of microplates. It is followed by the mathematical model of the testing system, and analysis of pseudo-random excitation signal and cross-correlation techniques in modal testing of microplates. Lastly, RFP curve fitting approaches were applied to extract modal parameters that include resonant frequencies, modal damping ratios and modal constants from the measured FRF spectrums.
The motivation of this work is to use the microplate as a biosensing platform. There are many types of electro-mechanical biosensing transducers, such as surface acoustic wave (SAW), quartz crystal microbalances (QCM) and various micromachined cantilevers. SAW based biosensors implement the biosensing function through detecting the changes in surface acoustic waves induced by the absorption of biomolecules on the sensing surface[18]. The SAW devices are usually operated at very high frequencies, and thus high mass sensitivity can be potentially obtained[18]. The quartz crystal microbalancs measure the additional surface mass loading via the decrease of resonance frequency (Bulk Acoustic Wave) and have been widely applied in gas sensors. More recently some experiments have also demonstrated that QCM systems can be used in sensing DNA and proteins[10]. Nevertheless, both SAW and QCM devices experiences difficulties when applied to stand MEMS fabrication[18] or integrating with MEMS devices[10]. Microcantilevers have attracted significant interest in the field of biosensing and are believed to be a promising platform for future biosensors. Microcantilevers can have over two orders of magnitude greater sensitivity compared to other types of biosensor devices (SAW, QCM etc)[11]. They also are suitable for batch fabrication and are easy to integrate etc[23]. The microplates (diaphragms or membranes) as biosensing platform are similar to the microcantilevers. However microplates have advantages of larger sensing area, higher sensitivity in liquid and less fragility[5, 21, 35].
2. Experimental Testing System
2.1. Fabrication of Rectangular Microplates
The microplates were fabricated from silicon on insulator (SOI) wafers with 5µm
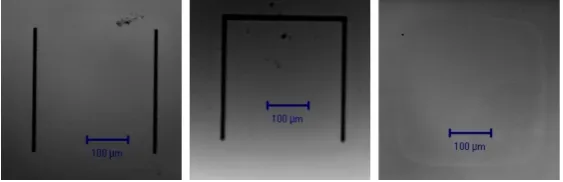
then created also by DRIE, again using the buried oxide as stop layer. Finally the buried oxide layer was removed by dry etching from the back side of the wafer. Three different boundary conditions of microplates were fabricated and tested in our experiments as shown in Figure 2. All of these microplates are designed to be square with lengths between 100µm to 400µm. However due to nature of the microfabrication process, the length and width of each microplates are hardly to be the precise desired value. True dimensions of each fabricated microplate are also measured for the corresponding theoretical simulations.
Figure 1. Schematic plot of micromachined silicon plate
Figure 2. Laser scanning images of 300µm×300µm×5µm microplates (C-F-C-F, C-F-F-F, C-C-C-C)
2.2. Experimental Setup
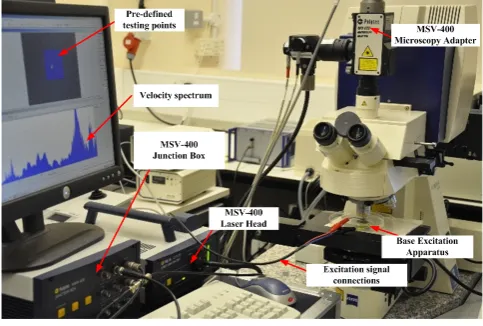
An experimental system has been designed for the dynamic characteristics measurement of micro-plates in air or immersed in water. Figure 3 shows this testing system. The petri dish containing the base excitation facility is situated on the stage of a microscope, which is used to visualize the microplates and accurately localize the laser spot for the velocity measurement. The laser vibrometer (MSV-400) is connected to the microscope through mounting its adapter on the camera port of microscope. The embedded signal generator in MSV-400 is used to provide excitation signals (pseudo random sequences), the signal output port on the junction box of MSV-400 connects the electrode wires of actuator in the petri dish.
[image:5.595.154.436.362.453.2]and 10mm wide silicon die, in which the microplate is embedded at the center, is inserted into the trapezoid slot and can be tightly clamped. Different with previously published base-excitation testing systems that were developed for MEMS structures by other researchers[32, 22], the proposed and employed base-excitation apparatus herein is compact and small in size. One benefit of this compressed device is appropriate to place under a normal up-right microscopy, in which the testing space is always very limited. The key components in this device are the silicon die holder (jig) and the piezo-actuator. This plastic jig is made from resin by using the 3D prototyping machine SLA. After the fabrication it is required to place under a oven with temperature of 70 ∼ 80◦C for 1 ∼ 2 hours, in order to enhance its strength and rigidity. The resonant frequency of piezo-actuator determines the frequency band of dynamic testings in this experimental system, which is up to 2MHz.
[image:6.595.173.415.371.534.2]Figure 5 illustrates the signal flow in each of this modal testing experiment. The excitation signal returns back to pro-analyzer (embedded in MSV-400) as a reference signal, and then it is cross-correlated with the original measured response from the laser vibrometer. Ultimately the frequency response functions of the testing microplate are obtained from the cross-correlation result by performing FFT.
Figure 3. Experimental testing system
Figure 4. Base excitation apparatus
Figure 5. Schematic diagram of experimental signal flow
3. Mathematical Model of Testing System
3.1. Theory of Base Excitation Testing On Microplates
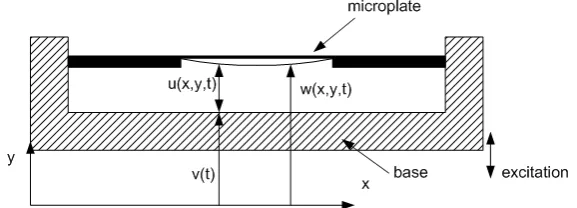
Mathematical modelling of the base excitation testing system designed for microplates is similar to previous pertinent work[3, 15, 7, 22]. Formulation derivation of the vibration of fluid-loaded microplates stimulated by base excitation are specially discussed in this section. Figure 6 illustrates the motion of a microplate in the testing of a base excitation system. The vibration of an isotropic thin-film rectangular microplate can be expressed in Eq. 1. Here w(x, y, t) indicates the function of absolute plate deflection. The boundary conditions of clamped edges of microplate that continuously linked with the rigid base are changed into Eq. 2 (as example the clamped edge is along x= La). On the other hand, the boundary condition of free edges of microplates in base excitation system remain the normal forms as in [16].
D(∂ 4w
∂x4 + 2
∂4w
∂x2y2 +
∂4w
∂y4) +ρph
∂2w
∂t2 =F(x, y, t) (1)
(w) x=La
=v(t),
(
∂w ∂x
)
x=La
[image:7.595.179.407.291.423.2]Figure 6. Schematic plot of micromachined silicon plate
Applying the new boundary conditions into Eq. 1, the deflection function of
w(x, y, t) then can be solved. However it would be an intractable process due to non-homogeneous of the new boundary conditions[22]. In order to change the boundary conditions to be homogeneous, relative motion of the microplate to the excited base is then induced. All system motions are assumed to be mainly along the vertical direction of the base excitation apparatus, therefore the relative motion of microplate u(x, y, t) to the excited base can be expressed as,
u(x, y, t) =w(x, y, t)−v(t), u˙(x, y, t) = ˙w(x, y, t)−v˙(t) (3)
The governing equation of relative motion of microplate with the homogeneous boundary conditions can then be solved through a routine process as in [16]. The characteristic equation for the relative motion of based-driven microplate is expressed in the following form considering a simple harmonic motion at frequency ω,
M Wmn(ωmn2 −ω2) =Fmn+ω2ρphCmnv(t) (4)
where M is the mass of plate and ωmn is the plate natural frequency in vacuo of (m, n) mode. Fmn is the generalized force and can be represented in the form,
Fmn = ∫ La
0 ∫ Lb
0
F δ(x−x0)δ(y−y0)Xm(x)Yn(y)dx dy (5)
Cmn is a scaling constant,
Cmn = ∫ La
0 ∫ Lb
0
Xm(x)Yn(y)dxdy (6)
The last term of Eq. 4 represents the base excitation force acting on the microplate. It can be seen that base excitation force is an inertial force of base motion scaled by the integral of normalized mode shapes[22]. The external force Fmn equates zero when the experiment is executing in vacuo. In the case that the whole base excitation system immerses in fluid (air or water), the external force Fmn indicates the fluid-loading force on the testing microplate. The effect of fluid can be described as adding an added mass term and an additional damping term into Eq. 4,
[
(M +Ma)(ωmn2 −ω
2) + 2jζ
mnωmnω ]
If substituting the solution of the coefficient for each mode shape function of Eq.7 into Eq. 1, the relative motionu(x, y, t) can be evaluated. Consequently the theoretical model for the vibration of base-driven fluid-loading microplate is set up.
Due to the importance and convenience of using the frequency response function (FRF) in the practical experimental modal analysis, a mathematical model on FRFs of the base-excited microplate is derived here. For the relative vibration of microplate, the mechanical force and damping force are functions of relative displacement and relative velocity respectively, while the virtual external force depends on the absolute acceleration of microplate[3]. The governing equation Eq. 7 of relative vibration of microplate can also be written in the following matrix form,
[M]{u¨−v¨}+ [C]{u˙}+ [K]{u}= [F] (8)
where the matrices [M], [C] and [K] are the mass, viscous damping and stiffness of microplate respectively.
If Eq.(8) is transfered into the frequency domain, we can obtain the following equation,
U(ω) =H(ω)V(ω)
H(ω) = ω 2
−ω2[M] +iω[C] + [K] (9)
whereH(ω) is frequency response function, it can be directly applied to perform the modal analysis of microplate. However both relative displacement U(ω) of microplate and displacement of base V(ω) are not the direct measurements in the experimental system. Therefore the velocity based frequency response function is adopted, which is determined in the following form[9],
Hv(ω) = ˙
U(ω) ˙
V(ω) = ˙
W(ω) ˙
V(ω) −1 (10)
As ˙W(ω) and ˙V(ω) are the direct output of vibrometer, the modal parameters of microplate can be extracted from the velocity based frequency response function.
3.2. Pseudo-random Excitation Signal and Correlation Techniques
The usage of pseudo-random signal in structural modal testing is close to its application in system identification[25], that correlation functions have to be induced to process the measurement of system response. The left part of Figure 5 shows the signal conversion in the dynamic testing system, in which y(t) is the direct measurement (system response), x(t) is the excitation signal and also the reference signal used for post-processing. The testing system is fairly linear, deterministic and also follows superposition principle [25]. Therefore the system response (vibration of microplate) can be modeled by an impulse response function h(t). Once the model of impulse response function h(t) is built up, the complete dynamic responses caused from any excitation input can be determined by using convolution integral[19].
The following gives a brief derivation on how to determinate a system natural model
h(t) from the direct system measurement y(t) in a pseudo-random stimulated testing system. The cross-correlation function Rxy(τ) of system output y(t) and input x(t) is defined in the following form[25],
Rxy(τ) = ∫ ∞
0
Rxx(τ −λ)h(λ)dλ (11)
where τ is the time delay in cross-correlation and Rxx is the autocorrelation function of pseudo-random signal x(t). The pseudo-random signal can be designed to approximate white noise, then the auto-correlation function of x(t) approaches a impulse function,
Rxx(τ−λ) =S0δ(τ) (12)
where S0 is the power spectral density of pseudo-random signal. Then Eq. 11 becomes a simple linear form and the system model function h(τ) can be expressed in the form,
h(τ) = Rxy(τ)
S0
(13)
As a result the system model functionh(τ) can be directly evaluated as a proportion of the cross-correlation function of system inputx(t) and outputy(t). Applying Fourier transform to the above functions, the frequency system response H(f) can also be obtained as to be proportional of Rxy(f).
Figure 7 demonstrates the pseudo-random signal employed to excite the microplates in this work, including three plots that are one period of pseudo-random sequence, its autocorrelation function and its power spectrum respectively. It can be seen that autocorrelation function is ideally an impulse and the distribution of power spectrum is fairly uniform over the frequency range less than clock frequency fc = 1/∆t. The pseudo-random signal here has the following parameters: sequence length is N = 16384 and clock period is ∆t = 58e−6s.
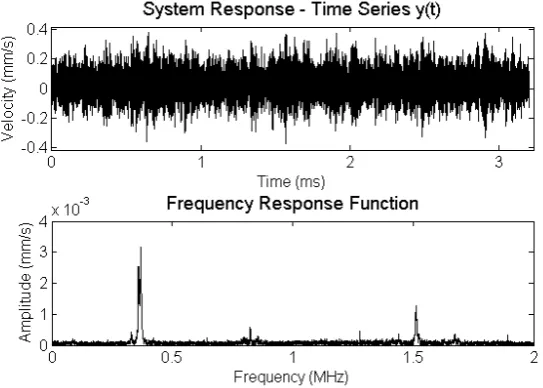
of frequency response function, which are obtained from the Fourier transformation of the correlation result between original time series and pseudo-random signal. Resonant peaks of the testing microplate are distinctly appeared in this FRF plot.
[image:11.595.153.425.445.639.2]Figure 7. A sample of pseudo-random signal used in testing
Figure 8. An example of microplate experimental data
4. Modal Parameters Estimation
to convert the data into the forms of relative motion. Nevertheless resonant peaks are already very dominant in each plot of these absolute velocity FRFs. Therefore approximate modal parameters can be directly estimated from those original data, in which strong noises and feak peaks also exist. As mentioned previously, vibration shapes of the testing microplate at each frequency can be automatically reconstructed in the software provided by MSV-400. The vibration shape at each frequency peak can be used to identify and eliminate the fake resonance modes, as well as to more accurately localize the resonance frequencies. Approximate resonant frequencies and damping ratios were calculated in a simply process of SDOF modal analysis.
Figure 9. Original measured ˙W(ω) of a 300µm×300µm×5µmC-F-C-F microplate
[image:12.595.175.402.507.702.2]Figure 11. Original measured ˙W(ω) of a 300µm×300µm×5µmC-C-C-C microplate
The Rational Fraction Polynomials (RFP) curve fitting method, which is developed by Richardson and Formenti[24], is used here to more accurately estimate the modal parameters. Before performing the curve fittings, the original FRF signals are smoothed with using an order of 3 Savitzky-Golay filter, for the purpose of noise reduction. When applying the RFP method to curve fitting the experimental FRFs, the number of modes that appear in the frequency band has to be specified in advance. Examples in Figure 12 and 13 demonstrate that acceptable PRF curve fitting results at most resonant modes were achieved. In both of these two figures, the upper plots are the case testing in air
and the lower plots are in water. It also shows lower natural frequencies and higher dampings when microplates are vibrating in water than in air.
5. Results Comparison
Figure 12. Curve fitting results of microplates (C-F-C-F) experimental data by using RFP methods
Table 1. Theoretical and experimental results on natural frequencies of a C-F-C-F microplate(kHz)
In Vacuo In Air In Water
Modes Theo. Expe. Theo. Expe.
1st 436.80 433.3 371.87 130.40 117.2 2nd 537.59 534.5 542.19 227.98 278.1 3rd 911.98 909.6 929.06 453.65 405.0
and corresponding theoretical predictions on damping ratios in Table 4 are at the same order of magnitudes. The discrepancies are mainly due to that the damping ratios measurement are easily effected by ambient noise and system errors. Nevertheless both numerical results and experimental results reveal that high resonant modes of microplate suffer less dampings, which is related to be high Q-factors.
Figure 13. Curve fitting results of microplates (C-F-F-F) experimental data by using RFP methods
Table 2. Theoretical and experimental results on natural frequencies of a C-F-F-F microplate(kHz)
In Vacuo In Air In Water
Modes Theo. Expe. Theo. Expe.
1st 75.9 75.4 73.1 23.9 25.0
2nd 195.3 194.8 191.9 84.5
-3rd 475.7 474.1 464.4 199.9 200.0
Table 3. Theoretical and experimental results on natural frequencies of a C-C-C-C microplate(kHz)
In Vacuo In Air In Water
Modes Theo. Expe. Theo. Expe.
[image:15.595.149.436.678.757.2]Table 4. Theoretical and experimental results on damping ratios of the three types of 300µm×300µm×5µmmicroplates in water
C-F-F-F C-F-C-F C-C-C-C
Modes Theo. Expe. Theo. Expe. Theo. Expe. 1st 2.83% 2.13% 2.38% 1.47% 3.21% 1.81%
2nd - - 0.21% 0.27% 0.20% 0.32%
3rd(4th) 0.38% 0.26% 0.17% 0.18% 0.02% 0.08%
Figure 14. Mode shapes comparison between theoretical and experimental results of three different immersed microplates
6. Conclusion
micro-structures. It proves again that the base-excitation method is able to stimulate the dynamic information of a microstructures in a normal damping ambient (in air), or even under a very high damping circumstance (in water). It also demonstrates the distinct advantages of using pseudo-random excitation signal in the process of experimental testing of microstructures.
This paper also mathematically presented the theory behind the base excitation on microplates, and the work principle of pseudo-random excitation signal and correlation techniques. Those formulations are useful to guide the optimal design of experiments and further applications to other micro-structures.
A series of different types and sizes of microplates were tested, measured and analysed in this work, both in air and in water. The modal parameters (natural frequencies, mode shapes and damping ratios) of fluid-loaded microplates extracted from experimental FRF measurements are compared with the theoretical results, and they matched very well. Additionally, the obtained experimental data provide important information to fully understand the dynamic characteristics of fluid-load microplates, and are also very useful in the design of related microsystems. Finally it comes to the conclusion that the proposed experimental system and methodologies in this paper provide a convenient and fast way in the field of dynamics testing of microstructures.
References
[1] Y.M. Amraoui and N.A.J. Lieven. Noncontacting excitation and measurement of light structures.
Journal of Vibration and Acoustics, 125(1):114–119, 2003.
[2] P. Avitabile. Modal space: back to basics [modal analysis]. Experimental Techniques, 29(2):15–16, 2005.
[3] J.G. Beliveau, F.R. Vigneron, Y. Soucy, and S. Draisey. Modal parameter estimation from base excitation. Journal of Sound and Vibration, 107(3):435–49, 1986.
[4] D.J. Burns and H.F. Helbig. Non-destructive resonant frequency measurement on mems actuators.
Journal of Microelectromechanical Systems, 8(4):473–482, 1999.
[5] E. T. Carlen, M. S. Weinberg, C. E. Dub, A. M. Zapata, and J. T. Borenstein. Micromachined silicon plates for sensing molecular interactions. Applied Physics Letters, 89(17):173123–173124, 2006.
[6] B. Charlot, S. Mir, F. Parrain, and B. Courtois. Electrically induced stimuli for mems self-test.
Proceedings 19th IEEE VLSI Test Symposium, pages 210–215, 2001.
[7] Yuan-Fang Chou and Li-Chung Wang. On the modal testing of microstructures: its theoretical approach and experimental setup. Journal of Vibration and Acoustics, 123(1):104–109, 2001. [8] N. Dumas, F. Azais, L. Latorre, and P. Nouet. Electro-thermal stimuli for mems testing in fsbm
technology. Journal of Electronic Testing: Theory and Applications, 22(2):189–198, 2006. [9] D.S. Epp, O.B. Ozdoganlar, P.M. Hansche, and T.G. Carne. A base excitation test facility for
dynamic testing of microsystems. Proc. 22nd Int. Modal Analysis Conf. (IMAC) (Dearborn, MI, 2629 January 2004), page 2629, 2004.
[10] L. Nicu etc. Resonating piezoelectric membranes for microelectromechanically based bioassay: detection of streptavidin-gold nanoparticles interaction with biotinylated dna. Sensors and Actuators B, 110(1):125–36, 2005.
[12] D.J. IJntema and H.A.C. Tilmans. Non-destructive resonant frequency measurement on mems actuators. Sensors and Actuators A, A35(2):121–128, 1992.
[13] M. Khoo and C. Liu. Micro magnetic silicone elastomer membrane actuator. Sensors and Actuators A, 89(3):259–266, 2001.
[14] Wen-Pin Lai and Weileun Fang. Novel bulk acoustic wave hammer to determinate the dynamic response of microstructures using pulsed broad bandwidth ultrasonic transducers. Sensors and Actuators A, 96:43–52, 2002.
[15] Jyh-Chiang Lee and Yuan-Fang Chou. Driven-base modal parameter estimation for continuous structure. Proceedings 9th International Modal Analysis Conference (IMAC), 1:711–718, 1991. [16] A.W. Leissa. The free vibration of rectangular plates. Journal of Sound and Vibration, 31(3):257–
293, 1973.
[17] R.M. Lin and W.J. Wang. Structural dynamics of microsystemscurrent state of research and future directions. Mechanical Systems and Signal Processing, 20(5):1015–43, 2006.
[18] K. Lnge, B. E. Rapp, and M. Rapp. Surface acoustic wave biosensors: A review. Analytical and Bioanalytical Chemistry, 391(5):1509–1519, 2008.
[19] M.J. Lowrey. Use of correlation techniques in vibration studies of plate systems. Experimental Mechanics, 29(2):476–481, 1975.
[20] Jian Lu, Tsuyoshi Ikehara, Yi Zhang, Takashi Mihara, Toshihiro Itoh, and Ryutaro Maeda. Characterization and improvement on quality factor of microcantilevers with self-actuation and self-sensing capability. Microelectronic Engineering, 86(4-6):1208–1211, 2009.
[21] Liviu Nicu and C. Ayela. Micromachined piezoelectric membranes with high nominal quality factors in newtonian liquid media: A lamb’s model validation at the microscale. Sensors and Actuators B (Chemical), 123(2):860–868, 2007.
[22] O.B. Ozdoganlar, B.D. Hansche, and T.G. Carne. Experimental modal analysis for microelectromechanical systems. Experimental Mechanics, 45(6):498–506, 2005.
[23] R. Raiteri, M. Grattarola, H.-J. Butt, and P. Skladal. Micromechanical cantilever-based biosensors.
Sensors and Actuators B, 79(2-3):115–126, 2001.
[24] M. H. Richardson and D. L. Formenti. Parameter estimation from frequency response measurements using rational fraction polynomials. Proceedings of the International Modal Analysis Conference, pages 167–181, 1982.
[25] A.W. Roberts and W.H. Charlton. Determination of natural responses of mechanical systems using correlation techniques. Experimental Mechanics, 15(1):17–22, 1975.
[26] L. Rufer, S. Mir, E. Simeu, and C. Domingues. On-chip pseudorandom mems testing. Journal of Electronic Testing: Theory and Applications, 21(3):233–241, 2005.
[27] Clarence W. De Silva. Vibration and Shock Handbook. CRC Press, 2005.
[28] N.F. Smith, D.M. Tanner, S.E. Swanson, and S.L. Miller. Non-destructive resonant frequency measurement on mems actuators. 2001 IEEE International Reliability Physics Symposium Proceedings. 39th Annual (Cat. No.00CH37167), pages 99–105, 2001.
[29] V.L. Spiering, S. Bouwstra, and R.M.E.J. Spiering. On-chip decoupling zone for package-stress reduction. Sensors and Actuators A (Physical), A39(2):149–57, 1993.
[30] S.M. Swei, P. Gao, and R. Lin. A dynamic analysis for the suspension structure in hard disk drives using piezofilm actuators. Smart Materials and Structures, 10(2):409–413, 2001.
[31] H.A.C. Tilmans, D.J. IJntema, and J.H.J. Fluitman. Single element excitation and detection of (micro-)mechanical resonators. TRANSDUCERS ’91. 1991 International Conference on Solid-State Sensors and Actuators. Digest of Technical Papers (Cat. No.91CH2817-5), pages 533–537, 1991.
[32] X.D. Wang, N. Li, T. Wang, M.W. Liu, and L.D. Wang. Dynamic characteristic testing for mems micro-devices with base excitation. Measurement Science and Technology, 18(6):1740–7, 2007. [33] C.J. Wilson and D.B. Bogy. An experimental modal analysis technique for miniature structures.
Journal of Vibration and Acoustics, 118(1):1–9, 1996.
distributed mass loading. Proceedings A of the Royal Society, 465(A):205–216, 2009.