A simple but precise method for quantitative measurement
of the quality of the laser focus in a scanning optical microscope
J . T r ¨a g ˚a r d h∗, K . M a c R a e∗,†, C . T r a v i s†, R . A m o r∗, G . N o r r i s∗, S . H . W i l s o n∗,†, G . - L . O p p o†& G . M c C o n n e l l∗
∗Centre for Biophotonics, Strathclyde Institute for Pharmacy and Biomedical Sciences, University of Strathclyde, Glasgow, U.K
†Department of Physics, University of Strathclyde, Glasgow, U.K
Key words. Beam characterization, knife-edge measurement, microscopy, resolution.
Summary
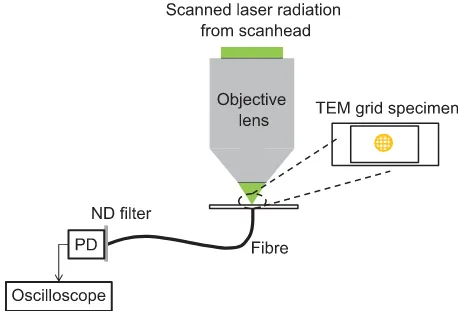
We report a method for characterizing the focussing laser beam exiting the objective in a laser scanning microscope. This method provides the size of the optical focus, the diver-gence of the beam, the ellipticity and the astigmatism. We use a microscopic-scale knife edge in the form of a simple trans-mission electron microscopy grid attached to a glass micro-scope slide, and a light-collecting optical fibre and photodiode underneath the specimen. By scanning the laser spot from a reflective to a transmitting part of the grid, a beam profile in the form of an error function can be obtained and by repeating this with the knife edge at different axial positions relative to the beam waist, the divergence and astigmatism of the postob-jective laser beam can be obtained. The measured divergence can be used to quantify how much of the full numerical aper-ture of the lens is used in practice. We present data of the beam radius, beam divergence, ellipticity and astigmatism ob-tained with low (0.15, 0.7) and high (1.3) numerical aperture lenses and lasers commonly used in confocal and multiphoton laser scanning microscopy. Our knife-edge method has sev-eral advantages over alternative knife-edge methods used in microscopy including that the knife edge is easy to prepare, that the beam can be characterized also directly under a cover slip, as necessary to reduce spherical aberrations for objectives designed to be used with a cover slip, and it is suitable for use with commercial laser scanning microscopes where access to the laser beam can be limited.
Introduction
In microscopy, the resolving power is the most important feature of the optical system and influences the ability to
Correspondence to: J. Tr¨ag˚ardh, Centre for Biophotonics, Strathclyde Institute for
Pharmacy and Biomedical Sciences, University of Strathclyde, 161 Cathedral Street,
Glasgow G4 0RE, U.K. Tel:+44-141-548-4645; fax:+44-141-548-4887; e-mail:
distinguish between fine details of a specimen. According to the Abbe equation, modified by Rayleigh, the lateral resolution rlatis given by
rla t =
0.61λ
N.A., (1)
while the axial resolutionraxis given by
ra x=
2nλ
(N.A.)2, (2)
whereλis the wavelength,nis the refractive index and N.A. is the numerical aperture of the objective lens (Abbe, 1884; Ditchburn, 1991). These equations are based on the beam profile of a focused plane wave. With reference to Eqs. (1) and (2), for high-resolution optical microscopy, it is clearly advan-tageous to use the full numerical aperture of the lens. In laser scanning microscopy, this is usually achieved by overfilling the objective lens. However, most commercial modern micro-scopes are inaccessible to all but the manufacturers’ service engineers and the user has little or no control over the exci-tation beam diameter at the back focal plane of the objective lens. Simple and low-cost methods are needed for the user to evaluate not only the resolution but also the propagation of the laser beam.
The current standard for measuring the resolution of a laser scanning microscope involves excitation of fluorescently la-belled beads and then analysing the resultant fluorescence im-age (Oldenbourget al., 1993; Cox & Sheppard, 2004; Zucker, 2006). This technique gives resolution data through decon-volution of the fluorescence image but since data are only obtained at the point of light–matter interaction, the propa-gation of the beam is not visualized, and hence information regarding effective numerical aperture of the objective lens is not revealed.
A TEM00beam, which is the beam profile expected for most
lasers used for laser scanning microscopy, has a spatial profile that is very nearly Gaussian and the profile does not change as
C
2015 The Authors
it propagates. The beam divergenceθfor an ideal, diffraction-limited Gaussian laser beam is given by
θ = λ/n πw0
, (3)
wherew0is the beam waist radius (where the intensity is 1/e2
times the maximum value). The propagation of such an ideal Gaussian beam can be described by
w(z)=w0
1+
λz nπw2
0
2
, (4)
wherew(z) is the position-dependent beam radius andzis the distance along the direction of propagation. In practice, how-ever, no laser achieves this theoretically ideal performance level. The divergence expected from a beam focussed by a lens is given by the numerical aperture
N.A.=nsi nθ (5)
and a measured divergence lower than this indicates that the full N.A. is not utilized, possibly because the back aperture of the lens is underfilled.
In practice, the propagation of the laser beam is investigated by scanning the beam across an aperture or knife edge that precedes a photodetector. For a Gaussian beam, the measured power as a function of knife-edge position has the shape of a Gauss error function. From the resultant Gauss error function and according to Siegmanet al. (1991), the distance between knife-edge positions corresponding to the values of 10% and 90% transmission of the beam intensity can be multiplied by 1.561 to provide a value for the beam diameter for an ideal Gaussian beam. By performing the knife-edge measurement at several z-positions, it is then possible to plot the evolution of the beam radius with respect to propagation distance and obtain the beam divergence along with the beam waist radius. Although it is possible to measure submicron beam radii on an optical bench (Firesteret al., 1977; Chapmanaet al., 2008), performing knife-edge measurements on a commer-cial laser scanning microscope is not trivial because of the limited accessibility to the laser beam exiting the objective. This is particularly problematic for short working distance objectives. Work using highly precise Ronchi gratings (Cohen et al., 1984; Cannonet al., 1986) has shown that micron-scale measurements can be made in an optical microscope using reflection imaging, but submicron measurements have not been demonstrated using this technique, presumably because of the low resolution of the gratings. For submicron measure-ments, Schneider & Webb (1981) proposed the use of different methods, including reflection from an aluminium coating on a glass slide and fluorescence excitation of a subresolution bead moving through the focus. However, the reflection method proposed by Schneider and Webb involves the manufacture of a thin film specimen, while the fluorescence measurement involves deconvolution methods to extract the optical focus information. In the work of Marchenkoet al. (2011), a thin
periodic gold nanostructure was used as a knife edge that was scanned across the laser beam to give detailed measurements of highly focused beam radii. However, this method required fabrication of metal nanostructures deposited on a photodiode surface and facilities for fabricating such structures are usually not available in-house in microscopy laboratories, making the structures difficult to obtain. Xieet al. (2013) used a simpler specimen for their double knife edge: a highly polished sili-con wafer mounted on top of a photodiode. This device, while potentially offering a knife edge with a very low curvature, is, however, comparatively thick, about 100 microns, thus contributing a significant diffraction loss. Moreover, since this double knife-edge method cannot be used with a cover slip, or indeed with a water-dipping objective lens, spherical aberra-tions may give misleading results for the most commonly used objective lenses for laser scanning microscopy.
We propose here a simpler knife-edge method to measure the beam divergence, submicron beam waist, ellipticity and astigmatism of the postobjective radiation in a laser scanning microscope which is also compatible with objective lenses re-quiring a cover slip. We have used an inexpensive and basic but precise specimen comprising a commercially available re-flective transmission electron microscopy (TEM) grid attached to a standard glass slide as the knife edge. The beam exiting the objective lens is translated across the knife edge by perform-ing an XT line scan usperform-ing the in-built galvanometer mirrors within the commercial laser scanning microscope. We collect the light transmitted through the hole of the TEM grid by plac-ing an optical fibre directly under the glass slide, and relayplac-ing the transmitted light to a large area photodetector. We can, using the method described above, measure the radius of the beam leaving the microscope objective lens. From the beam waist and divergence angle, it is then possible to evaluate the effective numerical aperture of the objective lens. Since the method is based on a transmission measurement, it allows separate characterization of the excitation optics, without the effect of the detection optics (most notably the pinhole).
Experiment
Fig. 1. A Leica SP-5 scanning system (not pictured) directed the scanned radiation to the objective lens. The postobjective radiation was then inci-dent on a specimen comprising a TEM grid mounted on histomount and sandwiched between a type 1.5 cover slip and a standard glass microscope slide. Using high optical zoom, the laser radiation transmitted through a single hole in the grid in XT line scan imaging mode was collected us-ing an optical fibre and sent to a large-area photodiode connected to an oscilloscope for capture of data.
same size as a microscope slide, but with a hole in the cen-tre (Chroma Technologies, Bellow Falls, VT, U.S.A.) through which the fibre was fed. The output from the fibre was collected by a Si photodiode (DET100A/M, Thorlabs) with a 50 k resis-tor connected across the detecresis-tor output, which was attached to a digital oscilloscope (TDS3242B, Tektronix, Beaverton, OR, U.S.A.) for data capture. The knife-edge specimen was a copper TEM grid with a square lattice of holes, each 40μm square (Athene mesh, Agar Scientific, Stansted, U.K.), which was placed on a glass microscope slide. A mounting medium of refractive index approximately 1.5 (Histomount) was applied to the grid specimen, and then a type 1.5 cover slip was added. The mounting medium was allowed to solidify overnight be-fore using the specimen.
To set up the system for measurements of the beam, it was first necessary to align the position of the fibre relative to the objective lens. The laser scanning microscope was set to re-flection xyz mode, with low laser power (<100μW average power after the objective lens for 488 nm, and with<1 mW for 800 nm) and the spectral detection range of the scanning microscope was set to the laser wavelength±3 nm. The lateral position of the microscope stage holding the fibre in the mount was optimized to obtain a centred reflection image of the fibre core.
After this alignment, the knife-edge specimen was placed directly on top of the fibre and fibre adaptor plate. The axial position of the objective lens was then changed to bring the reflection image of the TEM grid into focus. The TEM grid specimen was manually rotated to be square relative to the field of view. An optical zoom was then applied to bring only one hole of the grid into view, surrounded by around 50% of
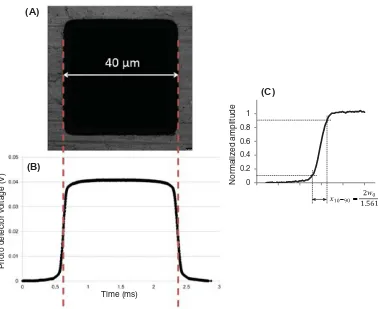
the width of the metallic grid, as shown in Figure 2(A). Next, the image acquisition mode was changed to provide a line scan across the centre of the square hole, and the line speed set to 10 Hz. This provided a high-resolution repeating trace on the oscilloscope of the laser radiation transmitted by the hole of the grid relative to the position of the blocking bars (Fig. 2B). This gave a simple means to optimise the axial position of the TEM grid specimen, with the in-focus specimen providing, as one should expect, the most rapid change from reflected to transmitted light, since the sample is then in the same plane as the beam waist.
Traces were obtained for the specimen in focus, correspond-ing to the beam waist, and also in the far field, i.e. at least five times beyond the expected Rayleigh range of the beam, by moving the axial position of the objective lens. This provided a range of Gauss error curves, such as the example shown in Figure 2(C). The time interval between the 10% and 90% amplitudes of the error functions was retrieved, and after con-version to distance, the beam radiusw(z) could be measured, as described in the Introduction, and plotted with respect to propagation distancez.
In order to obtain the divergence, we measured the actual beam waist and the far field beam diameterw(z). Using ba-sic trigonometry, the actual beam divergence could be calcu-lated from these values. The beam propagation could be easily compared with the theoretical ideal case, Eq. (4), with the divergence derived from the manufacturer’s quoted value of numerical aperture, and the beam waist given by Eq. (3). These measurements were performed for different wavelengths and objective lenses.
The ellipticity and astigmatism in the beam was measured by rotating the scan direction using the microscope control-ling software, (Leica LAS AF, Leica). The TEM grid was imaged scanning at angles of 0oand 90o, giving line scans
perpendic-ular to each side of the grid square and thus providing data for thexandydirections of the beam.
Results
Photo detector voltage (V)
Time (ms)
0 0.2 0.4 0.6 0.8 1
Normalized amplitude
(C)
(B) (A)
[image:4.595.103.481.80.389.2]x w
[image:4.595.42.544.480.585.2]Fig. 2. (A) A grey-scale laser scanning reflection image of a TEM grid with a 40μm diameter hole, imaged at 488 nm using the 5x/0.15 N.A. objective. (B) The corresponding data acquired using the fibre, photodiode and oscilloscope. This is used to obtain an accurate conversion of the data captured in the time domain on the oscilloscope to the distance measured in the specimen plane. (C) A normalized Gauss error curve obtained for the 5x/0.15 numerical aperture lens, used for measuring the 10% and 90% cut-off values from which the beam radius w(z) can be obtained.
Table 1. Measured beam waists and effective N.A. for different objective lenses and wavelengths commonly used in confocal and multiphoton laser scanning microscopy
Objective lens Wavelength (nm) Beam waist (nm) Theoretical beam waist (nm) Effective N. A.
5×(0.15 N.A.) 488 1840±38 1030 0.141±0.002
10×(0.4 N.A.) 488 900±61 378 0.309±0.009
20×(0.7 N.A.) 488 439±4 200 0.356±0.002
20×(0.7 N.A.) 800 556±8 328 0.395±0.003
40×(0.75 N.A.) 488 327±11 183 0.47±0.02
40×(1.3 N.A.) oil 488 169±2 100 0.291±0.006
40×(1.3 N.A.) oil 800 265±5 163 0.32±0.03
Note:The theoretical beam waist values are calculated from Eq. (3) and assume use of the full N.A. with appropriate immersion media. The effective N.A. is calculated from Eq. (5), using the measured divergence. The errors in the beam waste are the standard deviation of measurements at three positions very close to the focus.
small effective N.A. Images of fluorescent beads taken using 488 nm excitation and the 20x/0.7 N.A. objective (Movie S1 and Fig. S1) had a width in agreement with the beam radius measured using our knife-edge method, confirming that the larger than theoretically expected beam radius is not an arte-fact of the method. This also holds for the 40x/0.75 N.A. and 40x/1.3 N.A. objectives (Movies S2 and S3 and Figs. S2 and
S3), illustrating that the method gives a reasonable value for the overall beam radius, even for objective lenses, where the paraxial approximation is not strictly valid.
(A) (B)
[image:5.595.63.542.79.436.2](D) (C)
Fig. 3. Experimental data of the evolution of the beam radius for the (A) 5x/0.15 N.A., (B) 10x/0.4 N.A., (C) 40x/0.75 N.A., and (D) 40x/1.3 N.A. lens used with a 488 nm laser. The data points (filled diamonds) are presented with the ideal beam propagation for the N.A. of the respective lens. (thick solid line). The data set below thex-axis (open diamonds) is a mirror image of the measured data, to more clearly illustrate the beam propagation.
as small as 169 nm. The errors are the standard deviation of measurements at three positions very close to the focus. The effective N.A. was calculated from the measured divergence.
The beam size at the entrance pupil of the objective is large enough to fill all objective lenses, save the 10X 0.4 N.A. objec-tive, which is slightly under-filled. The beam profile is, how-ever, neither flat (approximating a plane wave) nor a truncated Gaussian, and this could have a negative impact on the quality of the focus.
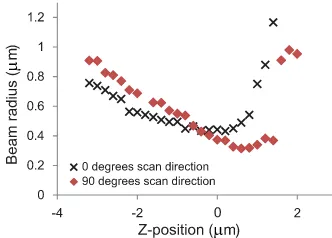
Beam propagation data to measure ellipticity and astigma-tism for a wavelength of 488 nm using a 20x/0.7 N.A. ob-jective lens are presented in Figure 4. Ellipticity in the focused beam was evident through the evolution of the beam radius at 0oand 90o. The measured beam waists for each axis of the beam were 440±4 nm and 315±6 nm at 0oand 90o,
re-spectively, yielding an ellipticity of 0.72±0.02. This observed ellipticity of the beam is possibly introduced by the scanning system and the prism-based scan rotation. With regards to astigmatism, the two foci were separated by 1±0.1μm.
Fig. 4. Direct measurement of the ellipticity and astigmatism for a 20x/0.7 N.A. objective lens at a laser wavelength of 488 nm. The figure shows the beam radius with respect to propagation distancezmeasured at 0orotation
of the scan direction (crosses) and at 90odegrees (diamonds).
Discussion
[image:5.595.347.513.497.616.2]under filling the objective, thus using less than the full N.A., or that the beam is not brought to a diffraction limited focus due to aberrations in the objective lens itself or the beam condition-ing optics in the microscope. This will have a negative impact on the achievable resolution in an acquired image. For exam-ple, with the 20x/0.7 N.A. objective, which is a convenient choice for both confocal and multiphoton laser scanning mi-croscopy, the beam waist was nearly twice as large as expected at both 488 nm and 800 nm. This would have a substantial impact not only on the lateral resolution, but also on the sec-tioning capability. Also, the measured astigmatism (shown in Fig. 4) negatively impacts on the confocal range of the source, and reduces the effectiveness of the source for excitation of fluorescence.
The errors in Table 1 are a measure of the noise in the measurement, for example, due to the intensity noise of the laser of about 1%. The error in the measurement can be small in comparison to a standard knife-edge measurement, since the movement of the scanning galvanometer mirrors and ax-ial movement of the objective lens are accurate and stable. Furthermore, a suitably rapid scan speed can be chosen to overcome any problems with vibration at subkilohertz fre-quencies, which often reduces the precision of measurements with fluorescent beads or gold nanoparticles (M ¨uller et al., 2003).
In choosing the conversion factor between the 10/90 width of the error function and the beam radius, we have assumed in our method that the beam profile is Gaussian, which is in reasonable agreement with the shape of the measured error function traces. Small differences could be due to, for example, spherical aberrations. Beams of other shapes than Gaussian can be analyzed by this knife-edge type method by choosing appropriate clip values and conversion factors (Siegmanet al., 1991), since this method makes no assumptions about the beam shape.
We have used the paraxial approximation throughout our analysis, but we have also considered the effects of nonparax-ial focusing with low and high N.A. lenses. From the work by Nemoto (1990), the quantity used to measure the degree of de-viation from Gaussian propagation iskw0/2, where k is the
wavenumber. Forkw0/2>4, the paraxial approximation is
perfectly valid, but for values ofkw0/2 smaller than this, the
optical electric field increasingly deviates from the paraxial approximation. Forkw0/2<1, the paraxial approximation
completely fails. For the 5x/0.15 N.A. lens,kw0/2 is larger
than 10 and thus the paraxial approximation is valid. For the 10x/0.4 N.A. lens,kw0/2=3.4, and the paraxial
approxi-mation is reasonably valid. For the higher N.A. objectives with N.A.=0.7 and N.A.=1.3, values forkw0/2 of 1.82 and
1.38 can be reached for a theoretically minimal beam waist, implying that the paraxial approximation needs corrections to accurately describe the beam propagation. According to Nemoto (1990), the error in the optical electric field can be on the order of 10%. However, Kang & L ¨u (2005) calculate
the deviations from the paraxial approximation of the far-field divergence andw0. From this,w0is less than 10% larger for
both objectives. For the objective lens with N.A.=0.7, the di-vergence has a minimal deviation from what is expected from the paraxial approximation. For the objective lens with N.A.= 1.3, however, the divergence could be substantially less than that expected from the paraxial approximation, at least for the theoretically minimal beam waist. Experimentally, we also ob-serve more deviations from the paraxial approximation for the objective with N.A.=1.3. We also note that Eq. (3) assumes that the divergence angle is small, which is not the case for higher N.A. objectives. A complete description of the focussing beam for high N.A. objectives would also need to take into ac-count the beam profile at the entrance pupil of the objective, which for this microscope is not similar to a plane wave. We therefore appreciate that a nonparaxial analysis of the beam propagation may yield slightly different values to those we present here, but it will not change the general observations presented.
The N.A. of the light collecting fibre (0.48) was smaller than the N.A. of the higher N.A. objectives. The associated loss in light collection efficiency of the high-angle components will lead to a retrieved beam radius that is larger than the actual beam radius (Firesteret al., 1977), and this effect is more pronounced for higher N.A. objectives. Firesteret al., however, calculate this error to be about 10% for a collection N.A. as small as one-third of the N.A. of the beam, assuming an objective N.A. of 0.9. Furthermore, since theeffectiveN.A. of all objectives is smaller than the N.A. of the collection fibre, these errors are likely minimal. Even in the unlikely scenario of collecting only the on-axis light, the error is about 15% (Firesteret al., 1977).
For higher N.A. objectives, it could be necessary to con-sider the interaction of the metal knife edge with the electric field of the light, in line with Marchenkoet al. (2011). Again, these errors are less than about 10%, and if the exact shape of the knife edge is known, these can be corrected for in the analysis (Huberet al., 2013). The knife edge should ideally be infinitely sharp on the scale of the beam diameter, but a somewhat graded transmission such as that in our real knife edge would only result in a slight overestimation of the beam radius (Cannonet al., 1986). We also note that for the 1.3 N.A. objective, diffraction from the knife edge is visible as a small but abrupt change in the beam diameter and a slightly different divergence after the focus (see Fig. S4).
slip, it is also optically very similar to real samples imaged with the microscope, and should therefore give a reasonable representation of the spot size, without introducing further aberrations. If the knife-edge specimen is prepared with a TEM grid mounted on a slide without a cover slip, it may be possi-ble to measure the properties of the beam for a water-dipping objective lens.
Conclusion
We have reported a useful, low-cost knife-edge method for accurately measuring the size of the optical focus, beam diver-gence and ellipticity of the postobjective optical radiation in a laser scanning microscope. Our method can be performed at laser wavelengths currently used in both confocal and multi-photon laser scanning microscopy because of the broadband reflectivity of the copper TEM grid, and at power levels used in optical microscopy since no damage to the specimen re-sults. The method is also suitable for use with microscopes where there is limited access to the laser beam. This approach is likely to be a useful tool in both the routine maintenance of laser scanning microscopes and in their development.
Acknowledgements
This work was funded by the Engineering and Physical Sciences Research Council (EP/I006826/1). The data asso-ciated with this research is available at http://dx.doi.org/ 10.15129/6bc7c405-9cef-4e73-af88-7eb039093514.
References
Abbe, E. (1884) A note on the proper definition of the amplifying power of a lens system.J. R Microsc. Soc.4, 348–351.
Cannon, B., Gardner, T.S. & Cohen, D.K. (1986) Measurement of 1μm diameter beams.Appl. Optics25, 2981–2983.
Chapmana, J.J., Norton, B.G., Streed, E.W. & Kielpinski, D. (2008) An auto-mated submicron beam profiler for characterization of high numerical aperture optics.Rev. Sci. Instrum.79(9), 0951061–0951064. Cohen, D.K., Little, B. & Luecke, F.S. (1984) Techniques for measuring 1
μm diam Gaussian beams.Appl. Optics23(4), 637–640.
Cox, G. & Sheppard, C.J.R. (2004) Practical limits of resolution in confocal and non-linear microscopy.Microsc. Res. Techniq.63(1), 18–22. Ditchburn, R.W. (1991)Light, pp. 228. Dover, New York.
Firester, A.H., Heller, M.E. & Sheng, P. (1977) Knife-edge scanning mea-surements of subwavelength focused light beams.Appl. Optics16(7), 1971–1974.
Huber, C., Orlov, S., Banzer, P. & Leuchs, G. (2013) Corrections to the knife-edge based reconstruction scheme of tightly focused light beams.
Opt. Express21(21), 25069–25076.
Kang, X. & L ¨u, B. (2005) The M2 factor of nonparaxial Hermite-Gaussian beams and related problems.Optik116(5), 232–236.
Marchenko, P., Orlov, S., Huber, C., Banzer, P., Quabis, S., Peschel, U. & Leuchs, G. (2011) Interaction of highly focused vector beams with a metal knife-edge.Opt. Express19(8), 7244–7261.
Mittmann, W., Wallace, D.J., Czubayko, U.,et al. (2011) Two-photon calcium imaging of evoked activity from L5 somatosensory neurons in vivo.Nat. Neurosci.14(8), 1089–1093.
M ¨uller, M., Schmidt, J., Mironov, S.L. & Richter, D.W. (2003) Construction and performance of a custom-built two-photon laser scanning system.
J. Phys. D Appl. Phys.36, 1747–1757.
Nemoto, S. (1990) Nonparaxial Gaussian beams.Appl. Optics29(13), 1940–1946.
Oldenbourg, R., Terada, H., Tiberio, R. & Inou´e, S. (1993) Image sharpness and contrast transfer in coherent confocal microscopy.J. Microsc.172, 31–39.
Schneider, M.B. & Webb, W.W. (1981) Measurement of submicron laser beam radii.Appl. Optics20(8), 1382–1388.
Siegman, A.E., Sasnett, M.W. & Johnston, T.F. (1991) Choice of clip levels for beam width measurements using knife-edge techniques.IEEE J. Quantum Elect.27(4), 1098–1104.
Wang, C., Qiao, L., He, F., Cheng, Y. & Xu, Z. (2011) Extension of imaging depth in two-photon fluorescence microscopy using a long-wavelength high-pulse-energy femtosecond laser source.J. Microsc.243(2), 179– 183.
Xie, X., Li, L., Wang, S., Wang, Z. & Zhou, J. (2013) Three-dimensional measurement of a tightly focused laser beam. AIP Advances 3(2), 022110-1–022110-7.
Zucker, R.M. (2006) Evaluation of confocal microscopy system perfor-mance.Methods Mol. Biol.319, 77–135.
Supporting Information
Additional Supporting information may be found in the online version of this article at the publisher’s website:
Fig. S1.A cross-section through an in-focus fluorescent bead (thick green line) taken from Movie S1, a Gaussian withw0
=0.35μm (thick dashed line) and an Airy function with full width at half maximum of 0.41μm (thin black line). The figure illustrates that the beam radiusw0measured with our
knife-edge method (0.439μm at 0°and 0.315μm at 90° scan angle) is in reasonable agreement with the beam radius derived from measurements on fluorescent beads. The images in Movie S1 were acquired using 488 nm excitation and the 20x/0.7 N.A. objective.
Fig. S2.A cross-section through an in-focus fluorescent bead (thick green line) taken from Movie S2 and a Gaussian with w0=0.34μm (thick dashed line). This width corresponds to
an illumination spot size of w0=295 nm convoluted with
the fluorescent bead (diameter 200 nm). The figure illustrates that the beam radiusw0measured with our knife-edge method
(327±11 nm) is in reasonable agreement with the beam radius derived from measurements on fluorescent beads. The images in Movie S2 were acquired using 488 nm excitation and the 40x/0.75 N.A. objective.
Fig. S3.A cross-section through an in-focus fluorescent bead (thick green line) taken from Movie S3 and a Gaussian with w0=0.246μm (thick dashed line). This width corresponds
to an illumination spot size of w0=178 nm convoluted with
that the beam radiusw0measured with our knife-edge method
(169±2 nm) is in reasonable agreement with the beam radius derived from measurements on fluorescent beads. The images in Movie S2 were acquired using 488 nm excitation and the 40x/1.3 N.A. objective.
Fig. S4.Experimental data of the evolution of the beam ra-dius for the 40x/1.3 N.A., lens used with a 800 nm laser. The data points (filled diamonds) are presented with the ideal beam propagation for the N.A. of the lens. (thick solid line). The data set below thex-axis (open diamonds) is a mirror image of the measured data, to more clearly illustrate the beam propaga-tion. The data illustrate the effect of diffraction from the knife edge, which results in a small but abrupt change in the beam diameter and a slightly different divergence after the focus.
Movie S1. A Z-stack of images of 200 nm fluorescent beads (Fluoresbrite, Polysciences Inc., Warrington, PA, USA)
mounted in Vectashield acquired using 488 nm excitation, a detection range of 500–580 nm and the 20x/0.7 N.A. objective. The images are separated with 100 nm in thez -direction. The astigmatism is clearly visible as the sample is moved through the focus.
Movie S2.A Z-stack of images of 200 nm fluorescent beads (Fluoresbrite, Polysciences Inc.) mounted in Vectashield ac-quired using 488 nm excitation, a detection range of 500– 570 nm and the 40x/0.75 N.A. objective. The images are separated with 340 nm in thez-direction.