1
DETERMINATION OF FRICTION FACTOR BY RING COMPRESSION TESTING AND FE ANALYSIS
MICHAL GZYLa, *,ANDRZEJ ROSOCHOWSKIb,LECH OLEJNIKc, KAMIL SIKORAd, MUHAMMAD JAWAD QARNIa
a
Advanced Forming Research Centre, University of Strathclyde, 85 Inchinnan Drive, Renfrew PA4 9LJ, United Kingdom
bDesign, Manufacture and Engineering Management, University of Strathclyde, James Weir Building, 75
Montrose Street, Glasgow G1 1XJ, United Kingdom
cInstitute of Manufacturing Technology, Warsaw University of Technology, ul. Narbutta 85, 02-524 Warsaw,
Poland
d
Department of Applied Computer Science and Modelling, AGH University of Science and Technology, al. Mickiewicza 30, 30-059 Kraków, Poland
*Corresponding author: [email protected]
Abstract
The goal of this study was to examine performance of various lubricants for aluminium alloy AA5083. Conventional ring compression tests were conducted at 200 °C. Samples were compressed to 50% of the initial height with a constant ram velocity 0.5 mm/s using a servo-controlled hydraulic press. The optimization procedure was implemented in self-developed software to identify friction factors from experiments. The application launches remotely finite element (FE) simulations of ring compression with a changing friction factor until a difference between experiment and numerical prediction of the internal diameter of the sample is smaller than 0.5%. FE simulations were run using Forge3 commercial software. The obtained friction factor quantitatively describes performance of a lubricant and can be used as an input parameter in FE simulation of other processes. It was shown that application of calcium aluminate conversion coating as pre-lubrication surface treatment reduced friction factor from 0.28 to 0.18 for MoS2 paste. It was also revealed that commercially
available graphite-based lubricant with an addition of calcium fluoride applied on conversion coating of calcium aluminate had even lower friction factor of 0.11
Key words: friction, FE simulation, ring compression
1. INTRODUCTION
In most metal forming operations, friction between dies and a workpiece has a significant effect on material flow, deformation force, surface quality of a final product and die wear. Additionally, properly defined friction is an important input parameter for commonly used numerical simulations of metal forming processes. Coulomb and shear friction laws (the latter is also known as Tresca law) are traditionally used in finite element (FE) modelling; they are given by equations (1) and (2), respectively (Joun et al., 2009):
N
t
, (1)
mk t
2
where: σt – frictional stress, σN – normal stress, k – shear flow stress, μ – Coulomb’s coefficient of friction, m – friction factor.
Prediction of frictional stress made by the two laws can be significantly different and selection of the way of describing friction should be made carefully with respect to the nature of a particular forming operation. Both laws give rather an estimation of frictional effects than an accurate prediction and are not suitable for some applications, e.g. Coulomb law significantly overestimates friction in extrusion process while shear friction law cannot predict the sticking region near the neutral point in rolling (Joun et al., 2009).
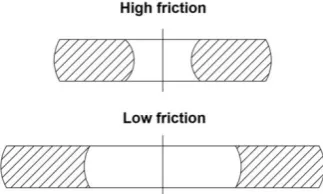
The most common method of identifying either friction factor or friction coefficient is uniaxial compression of ring samples. The method was proposed for the first time by Kunogi (1956) and the idea was to establish a relation between friction on tool-ring interface and a change of the internal diameter of a ring during compression. It was shown that the internal diameter of the compressed ring was decreasing along with increase of friction, as shown in figure 1. Then, Male and Cockroft (1965) experimentally obtained calibration curves for various friction coefficients, which display a relation between the reduction of inner diameter and the reduction of height of the ring. Those curves were widely used to identify friction coefficients for various materials. However, it was shown more recently that the shape of a friction calibration curve could be also affected by material properties and it was recommended to generate individual curves for each material (Sofuoglu et al., 2000; Camacho et al., 2013).
Fig. 1. Effect of friction on sample appearance after the ring compression test.
The goal of the current work was to identify friction factors for commercially available lubricants from ring compression testing of aluminium alloy AA5083 at 200 °C. An inverse analysis was incorporated to accurately define friction factor in each test; an optimization procedure was run until numerical results fitted experimental data. The effectiveness of pre-lubrication surface treatment in friction reduction was also investigated in this study.
2. EXPERIMENTALPROCEDURE
[image:2.595.227.389.408.505.2]3
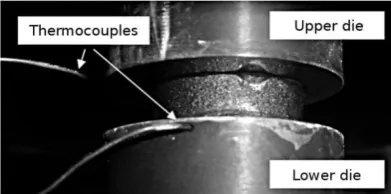
[image:3.595.199.395.214.311.2]dies used to deform specimens had 25 mm diameter and were made of a Vanadis® 23 tooling steel. They were heated up to 205 °C by band heaters with a power of 250 W each, temperature of the dies was slightly higher than targeted 200 °C in order to compensate eventual heat loss on the surface. The ring sample was kept between the dies for 1 minute before testing to heat it up. During this time, the upper die was compressing the sample with a force of 0.5 kN to enhance conductive heat transfer and to obtain similar thermal conditions on both sides. Two controlling thermocouples, with 0.5 mm diameter, were located in the centre of each die, 1 mm below its surface, as shown in figure 2.
Fig. 2. The sample placed between dies with attached thermocouples just before compression.
4
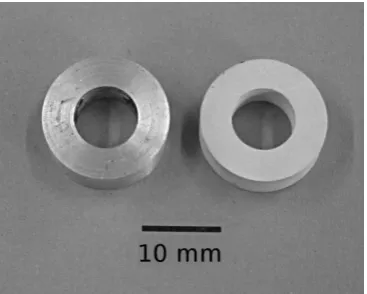
Fig. 3. Ring samples from aluminium alloy 5083: as-machined (left) and after conversion coating (right).
Table 1. Details of lubricants used in the current study and experimental plan
Lubricant name Main ingredients Comments Conversion coating No conversion coating
Rocol® dry moly paste MoS2 grey oil-based paste + +
Molykote® HTP solid
paste unknown white oil-based paste +
Loctite® 8008 copper paste based on copper particles +
Loctite® 8009 graphite, calcium fluoride
grey paste based on graphite
and calcium fluoride +
Formkote® T-50 graphite black solid film lubricant +
3. FEANALYSIS
3.1 Details of simulations
Three-dimensional elastic-plastic FE simulations of ring compression were performed in this study using Forge3 ver. 7.3 commercial package. Dimensions of the sample were the same as in the experiment. Flow stress for AA5083 was introduced using an analytical equation:
4
1 ) exp
exp(mT 2 3 m
A m m , (3)
where: T – temperature, ε – strain, – strain rate, A, m1-m4 – material coefficients; A = 445.93, m1 = -0.00119 , m2 = 0.17172, m3 = 0.01604, m4 = -0.00953.
[image:4.595.63.528.301.438.2]5
conductivity, specific heat capacity and density of AA5083 were 250 W/mK, 1230 J/kgK and 2800 kg/m3, respectively. Simulations were run in order to investigate: (1) thermal conditions in the ring during heating and deformation; (2) an effect of material properties on friction calibration curves.
3.2 Thermal conditions
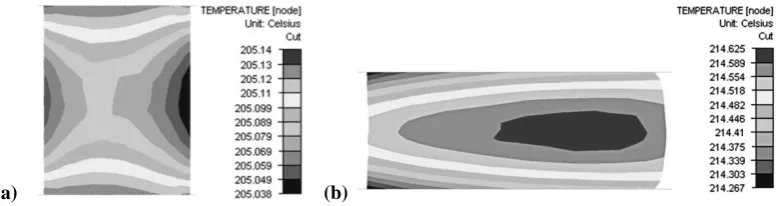
Temperature has a significant influence on material flow stress and performance of a lubricant; therefore, it is important to have a good control on temperature stability. FE modelling was performed in this work to simulate sample heating before testing and heat generation due to plastic deformation. It was shown in figure 4a that temperature within the ring was stable at 205 °C after 1 minute of heating from the dies. Side walls of the ring are cooler than the interior; however, the difference of 0.1 °C is considered negligible. Predicted temperature within the sample was the same as temperature recorded by the thermocouple placed in the die before deformation began. Then, temperature increase due to plastic work was also calculated by FE model and compared with experimental readings. It was predicted that temperature exceeded 214 °C in the sample compressed to 50% of the initial height, as shown in figure 4b. At the same time, the thermocouple placed in the die recorded 212 °C, which gives a reasonably good agreement between simulation and experiment.
(a) (b)
Fig. 4. Temperature field in cross section of ring predicted by FE simulation before testing (a) and after 50% height reduction (b). The axis of symmetry of the displayed ring is on the left.
3.3 Effect of material properties on friction calibration curves
[image:5.595.104.495.380.483.2]6
influence friction curves. The biggest difference was observed for low friction factors, the investigated curves tended to bring closer to each other along with increasing friction factor. The comparison of AA5083 and AA1050 confirmed that more accurate results can be obtained when friction factor curves are generated for individual materials.
(a)
[image:6.595.177.419.151.447.2](b)
Fig. 5. Calibration friction curves for aluminium alloys 1050 deformed at room temperature and 5083 deformed at 200 °C obtained from FE simulations (a) and flow stress curves used in the simulations (b).
4. OPTIMISATIONPROCEDURE
An optimisation procedure was run in a self-developed application in order to determine friction factors of the lubricants used in experiments. The developed application automatically lunched ring compression simulation in Forge3 at each step of the optimisation procedure. The rings were compressed in FE simulation to 50±3% of the initial height; exact values of height reductions were taken from experiments. Inner diameter of the compressed ring obtained from FE simulation was compared with the measured inner diameter at each step of optimisation. The procedure was run until error, Φ, was smaller than 0.5%:
% 5 . 0 % 100
exp exp
D D
D FE
, (4)
where: Dexp – experimental inner diameter of the compressed ring measured after testing,
7
The goal function, Φ, was minimised by changing friction factor, m, in FE simulation at each iteration step, n. The value of friction factor was modified according to the following equation: 1 1 5 . 0 n n n n n d d k d m m , FE FE D D D D k exp exp if , 1 if , 1
, (5)
where d is a step size, reduced at each iteration step. Initial friction factor and step size were
[image:7.595.115.480.255.390.2]m0=0.5 and d0=0.25.
Figure 6 shows a schematic diagram of the optimisation procedure.
Fig. 6. Schematic diagram of the optimisation procedure.
5. EXPERIMENTALRESULTS
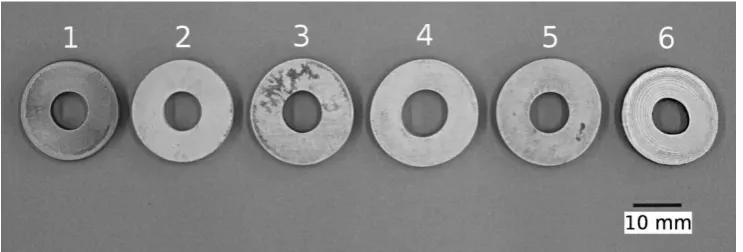
The tested samples are displayed in figure 7. It is apparent that the biggest internal diameter among them was obtained when combination of conversion coating and Loctite 8009 was used (sample 4 in figure 7). It is also clearly visible that sample coated only with Rocol paste (MoS2) has the smallest internal diameter (sample 6 in figure 7), which indicates
[image:7.595.113.485.602.728.2]high frictional effect. It is worth noting that thin layer of calcium aluminate applied during conversion coating still remained after testing, which was revealed after cleaning the samples with white spirit. It suggests that the coating is resistant to the elevated temperature of 200 °C in these working conditions.
8
(without conversion coating). Samples 2-5 were coated with a layer of calcium aluminate before applying a lubricant.
Identification of friction factors was performed for all tested samples to allow quantitative comparison between the lubricants. The calculated friction factors for the tested lubricants are shown in figure 8. The lowest friction, m = 0.104, was reported for a conversion coated sample lubricated with Loctite 8009. Combination of conversion coating and other lubricants resulted in friction factor varying from 0.181, measured for copper-based Loctite 8008, to 0.235, obtained after brushing with Molykote. Two variants of Rocol (MoS2) were
used, with and without pre-lubrication surface treatment by conversion coating. It was revealed that applied surface treatment decreased friction factor from 0.28 to 0.183. Graphite-based solid film lubricant (Formkote) gave the second worst result among conducted experiments; therefore, it is not recommended for aluminium alloys processed at 200 °C.
Fig. 8. Friction factors obtained after running the optimisation procedure.
6. SUMMARY
The goal of the current study was to determine friction factors for various lubricants using a ring compression test. The material tested was aluminium alloy AA5083 deformed at ~200 °C. It was shown through FE modelling that friction calibration curves depend on the flow stress of a material; therefore, new curves were generated in this work instead of using the standard ones. The friction factors were determined using the optimisation procedure implemented in the self-developed software. The presented approach enables obtaining accurate value of the sought parameter in an automated way. Moreover, the developed software can be modified to solve other optimization problems requiring FE simulation results as an input data at each iteration step.
In the experimental part of this work, it was shown that friction factor can vary from 0.1 to 0.3 for different commercially available lubricants. It was revealed that application of pre-lubrication conversion coating can reduce friction factor from 0.28 to 0.18 for MoS2-based
9
be focused on simultaneous identification of flow stress curves and friction factors from uniaxial compression tests of cylinders and rings.
REFERENCES
Camacho, A.M, Torralvo. A.I., Bernal, C., Sevilla, L., 2013, Investigations on friction factors in metal forming of industrial alloys, Procedia Engineering, 63, 564-572.
Clausen, A.H., Børvik, T., Hopperstad, O.S., Benallal, A., 2004, Flow and fracture characteristics of aluminium alloy AA5083–H116 as function of strain rate, temperature and triaxiality, Materials Science and Engineering A, 364, 260–272.
Joun, M.S., Moon, H.G., Choi, I.S., Lee, M.C., Jun, B.Y., 2009, Effects of friction laws on metal forming processes, Tribology International, 42, 311-319.
Kunogi, M., 1956, A new method of cold extrusion, Journal of the Scientific Research Institute, 50, 215-246. Male, A.T., Cockcroft, M.G., 1965, A method for the determination of the coefficient of friction of metals under
condition of bulk plastic deformation, Journal of the Institute of Metals, 93, 38-46.
Naka, T., Yoshida, F., 1999, Deep drawability of type 5083 aluminium-magnesium alloy sheet under various conditions of temperature and forming speed, Journal of Materials Processing Technology, 89-90, 19-23. Rosochowski, A., Olejnik., L., 2011, Incremental equal channel angular pressing for grain refinement, Materials
Science Forum, 674, 19-28.
Sofuoglu, H., Gedikli, H., Rasty, J., 2000, Determination of friction coefficient by employing the ring compression test, Journal of Engineering Materials and Technology, 123, 338-348.
Streszczenie
Celem niniejszej pracy było zbadanie przydatności różnych smarów dla obróbki plastycznej stopu aluminium AA5083. Standardowe testy spęczania próbek pierścieniowych zostały wykonane w temperaturze 200 °C. Próbki zostały spęczone do 50% początkowej wysokości ze stałą prędkością przesuwu narzędzia 0.5 mm/s. Testy zostały przeprowadzone na prasie hydraulicznej z serwonapędem. Procedura optymalizacyjna została zaimplementowana w samodzielnie opracowanej aplikacji w celu zidentyfikowania współczynników tarcia na podstawie wyników prób spęczania. Aplikacja zdalnie uruchamia symulację metodą elementów skończonych (MES) procesu spęczania próbki pierścieniowej ze zmieniającym się współczynnikiem tarcia dopóki różnica pomiędzy wewnętrzną średnicą próbki otrzymaną z eksperymentu oraz z symulacji numerycznej nie jest mniejsza niż 0.5%. Symulacje MES zostały wykonane w komercyjnym pakiecie Forge3. Otrzymane współczynniki tarcia pozwalają na ilościową ocenę przydatności użytego smaru oraz mogą być bezpośrednio użyte w symulacji MES. Wykazano, że dla smaru na bazie MoS2 zastosowanie powłoki konwersyjnej glinianu