Sensitivity of space and time on scanning LiDAR data
correlation and the implications on synchronisation of bi-static
systems
A. Cassola
1, A. Oldroyd
1, B. Gribben
2, N. Adams
2, B. Gellatly
3, M. Stickland
41: Oldbaum Services Ltd., Unit 13a, Alpha Centre, Stirling University Innovation Park, Stirling FK9 4NF,UK (tel: +44 (0)1786 469639, email: [email protected]);
2: Frazer Nash Consultancy, UK; 3: The Carbon Trust, UK; 4: University of Strathclyde, UK
SUMMARY
When possible, running a cross comparison between two or more instruments that are out on the field is an important check for accuracy, consistency and reliability of the instruments in question. As part of the Carbon Trust OWA Offshore wakes campaign, two scanning LiDAR systems were deployed to give near full coverage of the host offshore wind farm.
As part of the programme, periodic checks were performed to give confidence on how each system was performing, and to confirm that system output remained consistent. The LiDARs were several kilometres apart and the scan patterns were not synchronised temporally or spatially. It was, however, possible to pick out data points from the two LiDAR datasets that could be used for such a cross comparison based on their spatial and temporal separation. The line of sight velocities were compared for certain beam angle scenarios.
A cross comparison of radial wind speeds from the two LiDARs is carried out as a base case. The effect of time offsets and azimuth angle offsets between the LiDARs on the relationships between radial wind speed values in the base case is explored. Results showed that unintended or unknown temporal or spatial offsets lead to uncertainty in measurements from a bi-static system. The synchronisation of the LiDARs in both the time and space domains seems essential to help reduce measurement uncertainty when engaging a bi-static system.
INTRODUCTION
The use of remote sensing techniques relying on the detection of backscattered light waves, such as ground-based LiDAR (Light Detection And Ranging), for wind energy applications has become more and more common over the past years. A LiDAR is a device that measures wind speeds by emitting a laser beam into the atmosphere and calculating the Doppler shift in backscatter from the laser when it interacts with particles that are entrained in the air. The wind speed measured is only the component of the wind velocity vector that lies along the beam, which is called the radial velocity or the line of sight (LOS) velocity, vLOS.
their lower costs when compared with high met masts, especially offshore and on complex terrain [2].
Other LiDAR systems that have been developed for wind measuring purposes for wind energy applications include nacelle based LiDARs, which are used, for instance, for wind turbine power curve measurements [3] and power performance assessments [4], and scanning LiDARs, for example, for wind turbine wake measurements [5].
The laser beam from a LiDAR is only capable of sensing radial wind speeds. By orientating the beam from one device in different directions a horizontal wind vector can be calculated using the radial wind speed values measured at the different beam headings. LiDAR profilers and nacelle based LiDARs are both capable of determining a wind speed vector (be it a 3-D or a 2-D vector) over a short time period, however a scanning LiDAR does not do this. A scanning device has its beam constantly pointing in one direction out of its scan head. The scan head rotates to perform 2-D scans by varying either its azimuth angle or its elevation angle to perform PPI (plan position indicator) or RHI (range height indicator) scans respectively, or the beam can be made to stare in one direction (LOS mode) while collecting data, in each case recording radial wind speed values.
It is possible to combine beams from several scanning LiDARs so that they sample the same volume of air. In doing so, a 3-D wind vector for that packet of air can be reconstructed from the radial wind speed values and the beam geometries. This can be done using a bi-static scanning LiDAR system, under the assumption that the wind has no vertical component, by having the beams scan the same volume of air simultaneously. However, a question can be raised as to how certain one can be that the beams point in exactly the right direction at an exact time. There is always some uncertainty to any measurement that is made. The subject of data measurement and collection always goes hand in hand with the matter of uncertainty budgets or calculations that such tasks bring along. Scanning LiDARs are relatively novel devices in the wind energy sector, and certain aspects of uncertainties brought about by their measurements are still being studied. The uncertainty chain linking all the processes and parameters involved in sampling data is extensive (system uncertainty, coordinate transformation uncertainty, in-situ uncertainty, etc.). The objective of this exercise was to look at data from a bi-static LiDAR system out on site and identify some uncertainties linked to the space and time in which the LiDARs measured in relation to each other.
The effect of inaccuracies in azimuth angle and timestamp readings on vLOS measurements from two LiDARs that are sampling the same space and time were looked into by producing a series of correlations for the vLOS values from the systems based on certain criteria and on the base case of the LiDARs pointing their beams at each other.
SETUP
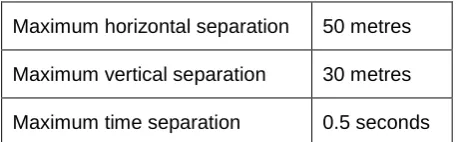
Figure 1 - Horizontal and vertical distance between the LiDAR units
The scanning LiDARs ran pre-defined sets of scan patterns passing through several cross sections of the wind farm as well as parts of the free stream sectors through a combination of PPI, RHI and LOS scans. In PPI mode the LiDAR scans a range of azimuth angles while keeping a constant elevation angle and in RHI mode the LiDAR beam’s azimuth angle is fixed while its elevation angle changes. The LOS mode is a staring mode during which the beam points in a fixed direction.
COMPARISON OF RADIAL WIND SPEEDS
A comparison of vLOS values from two (or more) LiDARs measured very near each other in
space and time from a volume of air within reach of the systems cannot be done unless the wind direction at the measurement locations is known. The tests conducted in this case were based solely on data from the two systems in situ (azimuth & elevation angles, range, vLOS, timestamp and CNR (carrier to noise ratio) values) – no external data were used. Therefore, only measurement points for when the two W200S units had their beams pointing roughly in the direction of the other system at approximately the same time could be compared against each other because the radial component of the wind on both beams was expected to be almost equal (and opposite) in magnitude, since, in theory, we would expect a correlation coefficient of -1 when comparing radial wind speeds from the two scanning units if these were measuring the exact same volume of air at precisely the same time while their beams pointed at each other. We’ll refer to the azimuth angles for the met mast and transformer LiDARs when their beams were directed at each other as θM0 and θT0 respectively (θT0 = θM0 + 180°).
The way to go about comparing data points was to look for data from the LiDARs that met such spatial and temporal criteria. Other constraints such as a maximum horizontal and vertical separation between pairs of data points, as well as qualitative criteria such as CNR levels, were applied.
The first test carried out was to compare vLOS values from the LiDARs when their azimuth angles (θM and θT) were equal to θM0 and θT0 (±2°) and were sampling nearly the same volume
of air along range gate/s almost simultaneously, i.e. and ; and . Instances when the elevation angle for both systems was between
0° and 5° were picked.
The reason for using a range of values within 4° for the angles was that for an extremely narrow range the resulting dataset would be empty or have very few data points. Using a small range was necessary to have a reasonable number of data points to work with.
Maximum horizontal separation 50 metres Maximum vertical separation 30 metres Maximum time separation 0.5 seconds
Table 1 – Spatial and temporal criteria for base case comparison
Met mast LiDAR Transformer LiDAR
~6.2km
[image:3.595.184.413.659.730.2]For this base case the dataset that was compared contained pairs of radial wind speed values (corresponding to readings from the two LiDARs) such that the elements of each pair satisfied the criteria in Table 1 with respect to one another (in addition to the angle conditions).
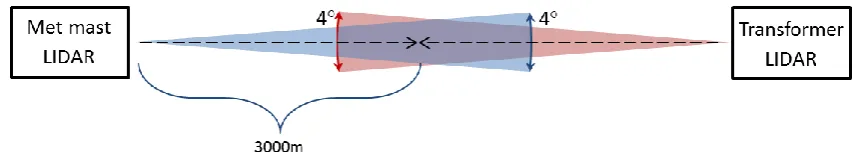
Figure 2 – Range of azimuth angles (along xy-plane) and range gate from met mast LiDAR used for cross comparison test
TIMESTAMP OFFSET
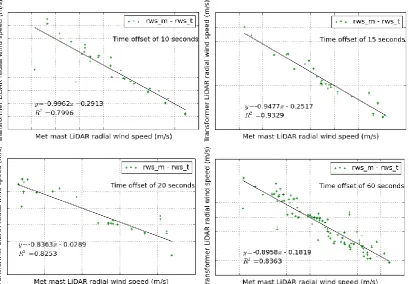
Scanning LiDARs in a bi-static configuration that are synchronised will read the same time and will both record timestamps relative to the same time reference. The second test was to look at what effect an offset between the measurement times of the met mast and transformer LiDARs might have on the vLOS comparison, i.e., when the LiDARs sample volumes of air that are in close proximity to each other at slightly different times.
The same spatial criteria as in the base case were used in this test. The temporal criteria changed – the maximum time separation was set to 60 seconds. Comparisons were made for different time offsets at 1 second intervals with a tolerance of ±0.5s. So, for example, for a 10 second offset the difference between met mast LiDAR timestamp and transformer LiDAR timestamp must be between 9.5 and 10.49 seconds.
AZIMUTH ANGLE OFFSET
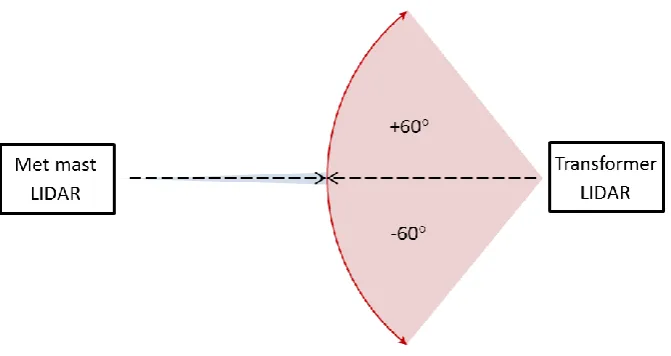
This case tries to reflect the hypothetical situation when two systems take a measurement at approximately the same time and supposedly at the same location but in actuality one LiDAR records the wrong azimuth angle (LiDAR reads θM0 or θT0 when the scan head bearing is off by
a number of degrees). The same criteria as the base case are used except for the azimuth angle range of the transformer LiDAR. In this case the range for azimuth angle θT is θT0 - 60° to
θT0 + 60 . Comparisons for different angle offsets (ΔθT) were made.
[image:4.595.80.509.133.214.2]Figure 3 – For the azimuth angle offset case the transformer LiDAR had an azimuth angle between θT0 - 60° and θT0 + 60°
RESULTS
Comparisons for the base case test show that there is a good relationship between vLOS values from the two LiDARs. As expected the correlation coefficient is close to -1.
Several CNR thresholds were applied to determine whether the relationship varies in any way but also to see how the population of the dataset decreases. The correlation coefficients did not change much and neither did the R2 value except for the threshold of -21dB. The R2 improved but the data set population suffered greatly (Figure 4).
[image:5.595.128.464.84.262.2]Figure 4 – Correlations of vLOS from the two LiDARs (3000m from met mast LiDAR) at various CNR thresholds
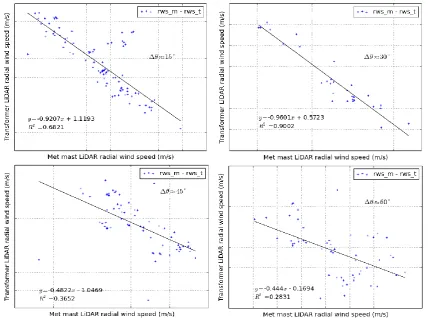
[image:6.595.93.503.418.702.2]For the case of an azimuth angle offset (and with a time difference of no more than 1 second between elements of data point pairs from the LiDARs) the correlations veered away from the results for the base test as the hypothetical difference in azimuth angle (ΔθT) between the actual
scanning head angle and that recorded by the system grew.
Correlations were very similar to the base case for ΔθT up to 20°. At ΔθT > 20° the relationship
between vLOS values started to deviate from the base test results, though even at some greater
ΔθT values the relationship was still good (example at ΔθT ≈ 30°) . With ΔθT > 30° the
[image:7.595.85.514.219.537.2]correlations values deviated even more as shown for ΔθT≈ 45° and ΔθT≈ 60° in Figure 6.
Figure 6 – vLOS comparisons at various azimuth angle offsets (3000m from met mast LiDAR and CNR threshold of -27dB)
DISCUSSION
The results for the base test comparison of vLOS values are close to what was expected giving correlation coefficients close to -1. Selecting data points from two LiDARs for when they point their beams at each other gives a way of comparing radial wind speed values output by the scanning units in an absolute manner. The wind direction need not be known in such case because almost the same wind velocity component is projected onto each of the beams.
As the beams begin to veer away from θM0 and θT0 the measurement locations along one beam
For some given azimuth angles θM and θT for when the beams intersect the relationship
between vLOS values, at close proximity to the intersection, from the LiDARs will vary as wind direction changes because of the cosine relationship between the wind velocity vector and LiDAR beam orientation.
If a cross comparison exercise is intended to be carried out between two or more scanning LiDARs using only the data from these instruments, then a well-planned dedicated set of scan patterns should be written to program the LiDARs accordingly where the beams point at the other system/s. Otherwise, if other scan patterns for other analysis purposes are used, as done in this exercise, it might be possible to look for points within the data when the beams almost point at each other. Of course, the scan patterns for each system must include the appropriate azimuth and elevation angles for this to be possible.
In the case that LiDARs in a bi-static system are meant to sample some volume simultaneously but one of the LiDARs has a time offset with respect to the other system, then, if a wind vector were to be reconstructed using the two vLOS values and beam geometries, the resulting vector might not be necessarily correct. The results showed that a 60 seconds offset between two LiDARs sampling volumes that were close did change the relationship between vLOS values. This implies that if the LiDARs are not in synch then this will add further uncertainty to any calculations or processes which will make use of the vLOS values from the bi-static system. In a similar way, further uncertainties come into play when measurements from a bi-static system, in which one (or both) LiDAR gives inexact or incorrect beam angle readings, are used for calculations or analysis work. As the results show, an azimuth angle offset for the transformer LiDAR from what, hypothetically, the angle reading was meant to be gives incorrect radial wind speed measurements for the intended measurement location.
REFERENCES
1. Gottschall J, Courtney MS, Wagner R, Jørgensen HE, Antoniou I. Lidar profilers in the context of wind energy – a verification procedure for traceable measurements. Wind Energy 2012; 15:147-159.
2. Antoniou I, Courtney M, Jørgensen HE, Mikkelsen T, von Hünerbein S, Bradley S, Piper B, Harris M, Marti I, Aristu M, Foussekis D, Nielsen MP. Remote sensing the wind using Lidars and Sodars. In Proceedings of the European Wind Energy Conference, Milan, Italy, May 2007.
3. Wagner R, Pedersen TF, Courtney M, Antoniou I, Davoust S, Rivera RL. Power curve measurement with a nacelle mounted lidar. Wind Energy (2013), Published online, DOI: 10.1002/we.1643.
4. Wagner R, Courtney M, Pedersen TF. Power performance measured using a nacelle-mounted lidar. Dewi Magazin no. 43, August 2013.
5. Iungo GV, Wu Y, Porté-Agel F. Field measurements of wind turbine wakes with lidars. J. Atmos. Oceanic Technol., 30, 274–287.