A Lack of Planets in 47 Tucanae from
a Hubble Space Telescope Search*
The Harvard community has made this
article openly available.
Please share
how
this access benefits you. Your story matters
Citation
Gilliland, Ronald L., T. M. Brown, P. Guhathakurta, A. Sarajedini,
E. F. Milone, M. D. Albrow, N. R. Baliber, et al. 2000. “A Lack
of Planets in 47 Tucanae from a Hubble Space Telescope
Search.” The Astrophysical Journal 545 (1): L47–51. https://
doi.org/10.1086/317334.
Citable link
http://nrs.harvard.edu/urn-3:HUL.InstRepos:41397451
Terms of Use
This article was downloaded from Harvard University’s DASH
repository, and is made available under the terms and conditions
applicable to Other Posted Material, as set forth at http://
L47
A LACK OF PLANETS IN 47 TUCANAE FROM A HUBBLE SPACE TELESCOPE SEARCH1
Ronald L. Gilliland,2
T. M. Brown,3
P. Guhathakurta,4
A. Sarajedini,5
E. F. Milone,6
M. D. Albrow,2
N. R. Baliber,7
H. Bruntt,8
A. Burrows,9
D. Charbonneau,3,10
P. Choi,4
W. D. Cochran,7
P. D. Edmonds,10
S. Frandsen,8
J. H. Howell,4
D. N. C. Lin,4
G. W. Marcy,11
M. Mayor,12
D. Naef,12
S. Sigurdsson,13
C. R. Stagg,6
D. A. Vandenberg,14
S. S. Vogt,4
and M. D. Williams6
Received 2000 August 25; accepted 2000 October 10; published 2000 November 28
ABSTRACT
We report results from a large Hubble Space Telescope project to observe a significant (∼34,000) ensemble of
main-sequence stars in the globular cluster 47 Tucanae with a goal of defining the frequency of inner orbit, gas giant planets. Simulations based on the characteristics of the 8.3 days of time series data in the F555W and F814W
Wide Field Planetary Camera 2 (WFPC2) filters show that∼17 planets should be detected by photometric transit
signals if the frequency of hot Jupiters found in the solar neighborhood is assumed to hold for 47 Tuc. The experiment provided high-quality data sufficient to detect planets. A full analysis of these WFPC2 data reveals∼75 variables, but no light curves resulted for which a convincing interpretation as a planet could be made. The planet frequency in 47 Tuc is at least an order of magnitude below that for the solar neighborhood. The cause of the absence of close-in planets in 47 Tuc is not yet known; presumably the low metallicity and/or crowding of 47 Tuc interfered with planet formation, with orbital evolution to close-in positions, or with planet survival.
Subject headings: binaries: eclipsing — globular clusters: individual (NGC 104, 47 Tucanae) —
planetary systems — techniques: photometric
1.INTRODUCTION
The discovery of 51 Peg b (Mayor & Queloz 1995) in a remarkably tight orbit of 4.2 days around its Sun-like host star challenged prevailing theoretical views and impelled rapid pro-gress in expanded radial velocity (RV) surveys that have now resulted in about 50 planet detections (see recent review by Marcy, Cochran, & Mayor 2000). The existence of inner orbit, gas giant planets (hot Jupiters) enables a highly efficient photo-metric search for planets, since with tight orbits (0.04–0.05 AU) hot Jupiters present about a 10% chance of transiting the host star given random orbital inclinations. Indeed, the transiting planet of HD 209458 was observed (Charbonneau et al. 2000;
1Based on observations with the NASA/ESA Hubble Space Telescope
ob-tained at STScI, which is operated by AURA, Inc., under NASA contract NAS5-26555.
2Space Telescope Science Institute, 3700 San Martin Drive, Baltimore, MD
21218; gillil@stsci.edu.
3High Altitude Observatory, National Center for Atmospheric Research,
P.O. Box 3000, Boulder, CO 80307; NCAR is sponsored by the National Science Foundation.
4UCO/Lick Observatory, University of California at Santa Cruz, Santa Cruz,
CA 95064.
5Astronomy Department, Wesleyan University, Middletown, CT 06459. 6Physics and Astronomy Department, University of Calgary, Calgary, T2N
1N4, Canada.
7Department of Astronomy, University of Texas at Austin, Austin, TX
78712.
8Institute for Physics and Astronomy, Aarhus University, DK-8000, Aarhus
C, Denmark.
9
Department of Astronomy, University of Arizona, 933 North Cherry Av-enue, Tucson, AZ 85721.
10Harvard-Smithsonian Center for Astrophysics, 60 Garden Street,
Cam-bridge, MA 02138.
11Department of Astronomy, University of California, Berkeley, 601
Camp-bell Hall, Berkeley, CA 94720.
12Observatoire de Gene`ve, CH-1290 Sauverny, Switzerland.
13Department of Astronomy, Pennsylvania State University, 525 Davey
Lab-oratory, University Park, PA 16802.
14
Department of Physics and Astronomy, University of Victoria, Victoria, BC, V8W 3P6, Canada.
Henry et al. 2000) “on schedule,” just as the ensemble of RV-detected hot Jupiters neared the point of a 50% expectation for transits. HD 209458b verified the theory of Guillot et al. (1996) predicting somewhat extended radii of∼1.2–1.4 RJ as a result
of retarded cooling due to high irradiance from the host star. A transit depth of 1.7% and a duration of 3.0 hr for HD 209458b repeating every 3.525 days present an enticing photometric signal.
In 1998 when the number of detected extrasolar planets was
∼10, of which four were hot Jupiters (defined herein as Porb! days), we proposed (in the “scientifically risky” category) to 5
use the Wide Field Planetary Camera 2 (WFPC2) on the Hubble
Space Telescope (HST) to observe a large ensemble of stars in
47 Tuc. Our target was selected (1) to provide an ideal spatial and brightness distribution of stars matching HST capabilities and (2) to shed insight into understanding the origins of
plan-ets by observing a system with reduced metallicity [Fe/H] p
20.7,[a/Fe]p0.4dex (Salaris & Weiss 1998). Our proposed field, with the crowded core of 47 Tuc on the PC1 CCD of WFPC2, provides some 40,000 main-sequence targets [giants are not of interest since the transit depth is equal to (R R/ )2,
P ∗
where RP and R∗ are the planet and star radii, respectively]. Saturation on the bright end occurs near the cluster turnoff where stellar radii are rapidly increasing and thus the expected signal is dropping anyway. Stars far down (∼4 mag) the main sequence remain viable targets since a rising signal from falling stellar radii would balance declining signal-to-noise ratio (S/N) for these fainter stars. The frequency of hot Jupiters (nine are now known) in the solar neighborhood is about 1%, with about a 10% chance per system of random orbital inclinations yielding transits; the 47 Tuc ensemble should thus provide on the order of one planet per 1000 surveyed stars.
2.OBSERVATIONS
L48 LACK OF PLANETS IN 47 TUCANAE Vol. 545
Fig.1.—Color-magnitude diagram of 46,422 stars from all four WFPC2 CCDs. The box along the main sequence over17.1!V!21.6 shows the selection domain for the 34,091 stars reported herein (PC1 box extended to ). Numerical entries provide predicted transit depths in magnitudes
Vp16.1
and duration (central passage) in hours assuming aPorbp3.8day planet with .
Rp1.3 R
J
∼2–3 hr transit timescale) coverage. Our 8.3 days (120 orbits
of HST, GO-8267) of continuous observation spanned 1999 July 3–11, the only data gaps resulting from Earth occultations and passages through the South Atlantic Anomaly (SAA). We chose the F555W and F814W filters for the primary time series with 160 s exposures (cycled every 4 minutes in each), yielding
saturation near V∼17.1 at cluster turnoff. These two filters
were alternated in a sequence typically consisting of 6#
and during each SAA free orbit. Visibility
F555W 6#F814W
periods impacted by the SAA were alternately devoted to one
or the other filter. With the orbital period of HST of ∼96.4
minutes, each transiting system of interest should display at least two consecutive transits over the 8.3 days in each of two filters. (Transits should be gray, while chance superposition of a main-sequence star and a large-amplitude but faint eclipsing binary, which in superposition mimics a planet transit in depth, would display very red signals.) The number of 160 s exposures obtained was 636 for F555W and 653 for F814W. We took care to design the observations with significant margin such that minor changes in one or even several assumptions re-garding number of stars, realized photometric precision, planet radius and hence signal amplitude, or assumed frequency of systems would not jeopardize a robust result.
The primary consideration in detection margin is the ratio of signal amplitude to the time series precision multiplied by (for Gaussian noise) the square root of the number of data points during transits. Time series precisions reach nearly the Poisson
limit, e.g., atVp18.4in 160 s an S/N of 200 (or 0.0053 mag
rms) results in the F555W filter. The length of transits (including
reduction byp/4 for average chord lengths) in hours (geometry
plus Kepler’s third law) and probability in percent of transits per existing system given random inclinations are
21/3 1/3
ttranp1.412M∗ R P ,∗ orb
21/3 22/3
Pr p23.8M R P , (1)
tran ∗ ∗ orb
whereM∗andR∗are in solar units and Porbis in days. For a
47 Tuc star at Vp18.4 M, ∗p0.81, andR∗p0.92
(Berg-busch & Vandenberg 1992), t p2.20 hr (up to 2.80 for
tran
central passages) for Porbp3.8 days and Prtranp9.6%. The
transit depth (assumingR p1.3 R) is predicted to be 0.022
P J
(about 4 j per observation), yielding an 11.5 j detection per
transit per filter. Overall this example would provide about a 23j detection.
3.ANALYSES AND TIME SERIES EXAMPLES
Full discussion of the analysis steps will appear in R. L. Gilliland et al. (2000, in preparation); here we provide only a sketch of steps relevant to reaching Poisson noise–limited re-sults for undersampled, dithered, crowded field photometry with the added complication of frame-to-frame focus drift. We do not believe that any software packages previously described in the literature would be up to the specialized and stringent requirements of this project and have therefore developed our own procedures and codes. Gilliland et al. (1995) discuss issues relevant to precise time series photometry for undersampled and dithered HST data; the steps to robust cosmic-ray elimi-nation using a polynomial expansion of the detected intensity as a function of (x, y) offsets to create an oversampled mean model remain central to the processing (for further details see Gilliland, Nugent, & Phillips 1999).
Initial frame-to-frame offsets are determined by point-spread function (PSF) fits to four relatively isolated stars in each frame. For each pixel a “surface” fit of intensity as a function of subpixel (x, y) offsets is formed with iterative elimination of multisigma positive deviations (cosmic rays). The frame-to-frame offsets are then adjusted by solving for the (x, y) offsets in a least-squares sense that provide a best match for evaluation of the analytic model (using only pixels on bright, unsaturated stars) to each frame. The image model and registration (including plate scale changes) solution are iterated two or three times to convergence. Absolute photometry has been performed on four oversam-pled, co-added images using DAOPHOT II (Stetson 1992). A typical PSF FWHM is 1.4 pixels; PC and WF CCD plate scales are 00.046 and 00.1 per direct pixel, respectively. Figure 1 shows the color-magnitude diagram (CMD) of 47 Tuc developed from our deep, well-dithered, co-added images in F555W (101,760 s) and F814W (104,480 s). Zero points of the instrumental mag-nitudes have been adjusted to best match 47 Tuc V, I fiducials (Kaluzny et al. 1998) near main-sequence turnoff. Stars have been excluded if (1) nominal apertures (69 pixel PC, 45 pixel WF) touch saturated pixels from neighbors, (2) apertures include any bad pixels flagged in the data quality files (except saturation), (3) greater than 90% of the light in the aperture comes from wings of brighter nearby neighbors, or (4) more than 1% of the frames in both F555W and F814W show saturation in the core
( 2 21). For the results discussed further below
gainp14e DN
only the 34,091 stars falling within a bright main-sequence box as shown were analyzed for time series.
The state-of-the-art crowded field, time series photometry now involves creation of difference images (e.g., Alcock et al. 1999; Alard 1999), where for well-sampled, ground-based CCD data excellent gains over classical PSF fitting in direct images are realized. With good difference images nonvariable objects are removed (except for residual, unavoidable Poisson noise), leaving any variables clearly present as isolated (positive or negative) PSFs even if the variable was badly blended with brighter stars in the direct images. Extraction of precise relative photometry changes for any star in a difference image can be handled with either aperture photometry or PSF fitting, and precise knowledge of the PSF is much less critical for the difference images relative to attempting photometry on blended stars in the direct image.
Fig.2.—Final time series quality shown as standard deviation of intensity changes divided by the mean intensity for each star in the WFPC2 F555W bandpass. The lower curve defines the expected precision limit based on Pois-son noise for isolated stars and background plus readout noise. Deviations to higher values usually follow from either real variables or increased (back-ground) Poisson noise from near neighbors. The upper detection limit curve defines the line below which transits are predicted to provide greater than 6.5jdetection for two transits in each filter; at this threshold no false alarms should arise.
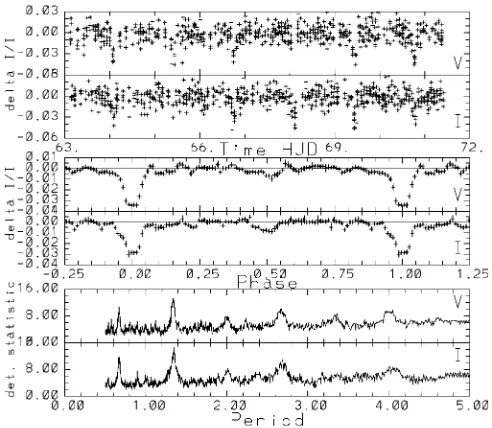
Fig.3.—Top panels: Direct V and I light curves. Middle panels: Same as top panels, but phased at 1.340 days after smoothing over 0.036 bins (error bars show standard error from scatter within bins). Transit depths are as ex-pected for a 1.3 RJplanet and 0.77 R,star. This demonstrates excellent
sen-sitivity to transits; however, as discussed in the text, this is a diluted eclipsing binary signal, not a planet. Bottom panels: Transit detection statistic described in § 4.
using the intensity of the (x, y) analytic model evaluated at the position of each individual frame. Such images, however, showed large residuals at each star in many images as a result
of focus changes. The 2mm “breathing” of HST due to changing
thermal stresses over orbits leads to a full amplitude redistri-bution of light inside to outside of a 1 pixel radius of∼20%. We have added the extra step of solving for a compensation kernel such that when convolved onto the analytic I(x, y) model it best matches individual frames. An iteration is now adopted over this focus compensation, the registration solution, and the (x, y) intensity analytic model. Difference images can now be formed accounting for (x, y) offsets and focus changes; variable stars become obvious in movies of such images that were in-visible in direct image movies.
A time series was created by fitting a PSF at the known position of individual stars in each image. Normalization was performed using counts as a function of magnitude based on
archival calibration images of the standard GRW170D5824.
Each time series was cleaned by removing any changes linearly correlated with an ensemble average term and nine vectors comprising all terms through cubic in (x, y) offsets. This de-correlation step usually does not provide much change for the inherently excellent HST time series.
Figure 2 shows the resulting time series rms of relative in-tensities (magnitudes would be larger by a factor of 1.086) for each of 34,091 stars in the F555W filter (F814W results are similar). The lower curve shows the ideal photometry limit:
our results are usually within ∼10%–15% of this. The upper
“detection limit” curve is a function of assumed planet radius, stellar radius along the main sequence, length of transits, and density of sampling such that a (Gaussian noise) rms value
falling below this curve would provide greater than 6.5j
de-tection for two transits in each filter. The steep dropoff of the detection capability on the bright end results from increasing stellar radii near turnoff, creating a lower predicted transit sig-nal. At the faint end smaller stellar radii produce deeper but shorter transits, the S/N for which is overtaken by the loss in time series S/N in the sky background–limited regime.
Figure 3 shows a time series that presents a close
approxi-mation to expectations for a planet transit. The star has Vp
, V2 , and two neighbors brighter by ∼2.5 mag
19.01 Ip0.89
at 00.5 separation. Decreases of ∼3% can be seen repeating
every 1.34 days in both the direct V- and I-band time series
(a combined 28 j detection). Predicted transit depths from a
planet at 1.3 RJare 0.030 as seen. A 4jsignificant secondary
eclipse at phase 0.5 suffices for arguing that this is not a planet. Moreover, analysis of the saturated neighboring stars shows that one is a large-amplitude eclipsing binary at the same period and phase. The light curve plotted results from the eclipsing binary PSF wings at the position of the faint star, providing a diluted signal of an ordinary variable; this is not a planet candidate.
4.TRANSIT SEARCH AND DETECTION EFFICIENCY
To search for multiple transits, we fold the time series of each individual star in each filter with sufficient trial phases and periods within 0.5–8.3 days to densely cover phase space. We then convolve the folded time series with the theoretical light curve corresponding to nominal transits. The convolution is normalized so that, for a white-noise input, the convolution values are normally distributed with unit variance. Possible transits are indicated by period-phase combinations with large positive values of the convolution (see Fig. 3). Since the noise in the HST data is close to white, we selected a threshold of 6.3j, which should yield&1 false alarm for the entire search space given Gaussian statistics (e.g., Bevington 1969). A de-tailed description of procedures and results will appear in T. M. Brown et al. (2000, in preparation).
[image:4.612.320.566.65.279.2] [image:4.612.46.288.65.181.2]L50 LACK OF PLANETS IN 47 TUCANAE Vol. 545
Fig.4.—Left panel: Detection frequency averaged over periods from sim-ulations as a function of assumed planet size. Right panel: Same as left panel, but as a function of orbital period atRp1.2 RJ.
that extensive image reduction and time series extraction steps used did not damage real transit signals. Our procedures cor-rectly retained evidence of transits through the image pro-cessing and time series levels of the analysis.
A more extensive test inserted artificial transits directly into the time series of about 10,000 randomly chosen stars. These are enough samples to estimate the dependence of our detection efficiency on planetary radius and orbital period for the actual noise characteristics of our time series as a function of V. Fig-ure 4 shows that the percentage of correctly categorized transit light curves depends strongly on assumed planet radius and more moderately on orbital period. The theoretical expectation (Guillot et al. 1996) is that (irradiated) planet radii vary only slowly as a function of mass. Indeed, planets with sub-Jovian
mass may have slightly larger radii than a 1 MJplanet. Also,
over the 2 orders of magnitude mass range from planets to brown dwarfs to stars at the main-sequence threshold, radii are not expected to vary by more than 10%–20%. This lack of radius dependence on mass would be a hindrance if trying to interpret a handful of weak signals as planets (rather than stars), but for a null result it implies a lack in the sample of any transiting planets, brown dwarfs, or very late M dwarfs.
Assuming an occurrence rate for close-in giant planets that is the same as in the solar neighborhood (0.8%–1.0%) and a 10% probability of favorable orbital alignment, there should be about 30 transiting planets among our sample of 34,091 stars. Assum-ing planet radii of 1.3 RJ and a typical period of 3.5 days and
allowing for the actual distribution of V magnitudes (stellar radii and time series noise) in our sample, the number of planets actually detected should have been about 17. Since we saw none, we may conclude (with very high confidence) that in so far as giant planet occurrence is concerned, the solar neighborhood and 47 Tuc represent different populations.
5.ASTROPHYSICAL INTERPRETATION
It was noted (Gonzalez 1997) with the first planet detections that host stars tend to be considerably more metal rich than the average star surveyed in the solar neighborhood. This cor-relation has been maintained (Laughlin 2000) with a much larger sample now available. A correlation with metallicity could, however, be either cause or effect. It could be that lower metallicity in proto–planetary nebulae causes a lower frequency of planet formation as a result of fewer dust grains for nucle-ation. It could be that higher metallicity in systems with a remaining close-in planet is an effect of inward migration of metal-rich planets onto the star (Lin, Bodenheimer, & Rich-ardson 1996), thus polluting the thin outer convective layer. Our 47 Tuc results are at least consistent with the hypothesis that lower metallicity biases against formation of hot Jupiters.
47 Tucanae is a massive cluster with a density∼103M
,pc2
3
at 19from the core (Gebhardt & Fischer 1995; a typical location for our observations). In such a crowded environment, close encounters can result in dynamical interactions, particularly with passing binary systems, which lead to large changes in orbital parameters (Heggie 1975). Sigurdsson (1992) considered the or-bital stability problem for high-mass ratio systems (in the context of pulsar planets) specifically for 47 Tuc conditions and con-cluded that orbits as short as 5 days would be quite stable against disruption or forced merger even in the most dense core region. An avenue for destroying hot Jupiters in the crowded 47 Tuc core arises from consideration of tidal dissipation (S. Sigurdsson, D. N. C. Lin, & R. L. Gilliland 2000, in preparation) within the planet. In this scenario star-planet encounters with binaries can induce an eccentric planet orbit. Dissipation of the stellar tidal disturbance within the planets drains their orbital energy. Internal heating may cause the planets to expand and provide positive feedback to a disruptive process. Critical to this scenario is the actual frequency of close binaries in 47 Tuc, which will be a valuable side product of our survey for planets (M. D. Albrow et al. 2000, in preparation). Alternative scenarios have been pos-tulated where crowding limits planet formation (Armitage 2000). We have shown that planets like 51 Peg b that are found in
∼1% of local stars surveyed must be an order of magnitude
rarer in the lower metallicity, crowded stellar environment ex-tant in the center of 47 Tucanae. This represents a significant result delineating where planets exist. Further observations of stars in different circumstances will be necessary to learn whether the dominant influence in reducing the planet fre-quency is low metallicity, a crowded environment, or some combination of these or other factors.
We thank Merle Reinhart and Patricia Royle at STScI for assistance in scheduling these unique observations. This work was supported in part by STScI grant GO-8267.01-97A to the Space Telescope Science Institute and by several STScI grants from the same proposal to co-I institutions.
REFERENCES Alard, C. 1999, A&A, 343, 10
Alcock, C., et al. 1999, ApJ, 521, 602
Armitage, P. J. 2000, A&A, submitted (astro-ph/0007044) Bergbusch, P. A., & Vandenberg, D. A. 1992, ApJS, 81, 163
Bevington, P. R. 1969, in Data Reduction and Error Analysis in the Physical Sciences (New York: McGraw-Hill), 46
Charbonneau, D., Brown, T. M., Latham, D. W., & Mayor, M. 2000, ApJ, 529, L45
Gebhardt, K., & Fischer, P. 1995, AJ, 109, 209
Gilliland, R. L., Edmonds, P. D., Petro, L. D., Saha, A., & Shara, M. M. 1995, ApJ, 447, 191
Gonzalez, G. 1997, MNRAS, 285, 403
Guillot, R., Burrows, A., Hubbard, W. B., Lunine, J. I., & Sauman, D. 1996, ApJ, 459, L35
Heggie, D. C. 1975, MNRAS, 173, 729
Henry, G. W., Marcy, G. W., Butler, R. P., & Vogt, S. S. 2000, ApJ, 529, L41 Kaluzny, J., Wysocka, A., Stanek, K. Z., & Krzemin´ski, W. 1998, Acta Astron.,
48, 439
Laughlin, G. 2000, ApJ, submitted (astro-ph/0008223)
Lin, D. N. C., Bodenheimer, P., & Richardson, D. C. 1996, Nature, 380, 606
Marcy, G. W., Cochran, W. D., & Mayor, M. 2000, in Protostars and Planets IV, ed. V. Mannings, A. P. Boss, & S. Russell (Tucson: Univ. Arizona Press), 1285
Mayor, M., & Queloz, D. 1995, Nature, 378, 355 Salaris, M., & Weiss, A. 1998, A&A, 335, 943 Sigurdsson, S. 1992, ApJ, 399, L95