BCN
IC
HPBRS
coMMtsstoil 0F THE EURopEAil COiltMtlt$TtEs o D|REGT0BATE-GEI$ERAL FoB ECotIoMlc AllD FltIAilClAt AFFAInS
No
44 March 1986of firms'
manPower exPectationspoLicy imPLications -.
.{
9;
NerbInternaL Paper
redi
ctive
vaLue"Economic Papers"
are
written
by
the
Staff of
the
Directorate-GeneraLfor
Economic and FinanciaLAffairs, or
byexperts
workingin
associationwith
them.
The "Papers"are
intendedto
increase awarenessof
thetechnicat
work being done bythe
staff
andto
seek comments and suggestionsfor further anatyses.
They maynot
be quoted withoutauthorisation.
Views expressed represent exctusiveLythe
posjtionsof
the
author and donot
necessarity
correspondwith
thoseof
the Commissionof
the
EuropeanCommunities.
Comments and enquirjesshouLd be addressed
to
.^Ih" Directorate-GeneraI
for
Economic and FinanciaLAffairs,
i__Commissionof
the
European Communities,2OO, rue
de
ta
Loi"'# >
~ 'i.c-£;(',.!1-/·.U f r:-~ t:.. N° 44 March 1986
\,
~Predictive
value of firms' manpower expectationsand policy implications ~ G. Nerb
, I
Internal Paper
The author is grateful to Mr. W. Naggl ,(Munich University) for his collaboration on Chapter II and to Mr. B. Meganck (Banque Nationale de Belgique, Brussels>, Mr. C.P.H. Burton CCBI, London) and
Mr. Devilliers CINSEE, Paris) for making available extensive statistical material
J • .;l. • I
II/111/86-EN
CCC'
Jl1J/
I INTRODUCTION
Und~r the ~onventional econometric estimating procedures
fluctuations in manpower levels are explained and predicted in a two-stage
process. With given business expectations regarding the prospective trends
in production and real wages, the manpower levels aimed at by firms in the
long term are dependent on the marginal productivity of Labour, which in
turn is determined by an appropriate production function. Because of the
costs of recruiting, training and dismissing labour, actual manpower Levels
adjust to the desired medium-term levels with a time lag. Both in theory
and in econometric practice, this adjustment process is carried out on an
1
ad hoc basis using a separate adjustment function
Attempts have been made to improve such short-term employment functions by using models to capture the cyclically fluctuating relationship
between production and employment 2• But, these too have failed to produce
any significant improvement in the predictive quality of such estimating
functions. It is clearly not possible to explain with models, let alone
forecast, short-term fluctuations in labour productivity (defined here as
output per person employed). The main reason probably is that firms are
largely autonomous in their employment behaviour, i.e. independent of the trend in production. This finding has been established inter alia in special
studies which demonstrated that firms' willingness to hold on to their
employees at times of depressed economic activity is dependent to a quite
significant degree on their medium-term growth prospects. Even in the
event of a cyclical recovery of demand, these medium-term expectations
1
2
See, for example, A.J. Phipps, "The Relationship Between Output and Employment in British Manufacturing Industry", Oxford Bulletin of Economics and Statistics, vol. 37 (1975), and R.M. Solow, "Short-run Adjustment of Employment to Output", in J.N. Wolfe (e.d.>, Value, Capital and Growth, Edinburgh, 1968.
See, for example, F.P.R. Brechling and P. O'Brien "Short-Term
are a crucial factor in firm's decisions whether or not to increase their
workforce 3• A whole range of exogenous variables are therefore at work
and should be taken into account in any efficient forecasting model.
In the opinion of forecasters, the fundamental weakness of
such conventional econometric estimating methods thus lies in the need to
make a forward assessment of the exogenous variables. Spitznagel therefore
draws the following conclusion from his extensive empirical investigations
"Since forecasts are generally conditional in nature, the purpose of future
research must be to shift the.level of conditionality backwards
in order to reduce uncertainties in the 'if' components. This can be done
by endogenizing exogenous variables and/or by incorporating predetermined
variables· or quantitative or qualitative leading indicators in
econometric models" (translation) 4
This paper sets out to examine whether predetermined exogenous
variables such as those which are empirically obtained in the form of manpower
plans 5 from the business surveys conducted among firms in most Community
countries, can help improve forecasts of the demand for labour. It is
confined to the employment trend in industry since this is the only sector in most Community countries in which surveys of manpower plans are
carried out on a regular basis, in general three times a year (January/
February, June/July and October/November) and with a time horizon of
three to four months 5• Although in the Community an average of only
around one third of the total employed labour force is now working in
3
G. Nerb, "Beschaftigungspolitische Verhaltensweisen der Unternehmen
-Ergebnisse ~on Ifo-umfragen", in Langerfristige Perspektiven fur den
Arbeitsmarkt in der Bundesrepublik Deutschland, Beihefte der Konjunkturpolitik, vol. 25, 1978, pp. 45 et seq., and id.,
Konjunkturverlauf und Arbeitsmarkt. Erkenntnisse aus U~rnehmer
umfragen fur die Arbeitsmarktpolitik, Ifo-S~hnelldienst, November 1982
4 E. Spitznagel, "Ansatze zur Prognose konjunktureller Schwankungen
der Nachfrage nach Arbeitskraften" Allgemeines Statistisches Archiv, 2, 1976, p. 212.
5
The expressions "manpower plans" and "manpower expectations" are used synonymously in this paper. The term "expectation" is therefore
3
-industry, the decision to concentrate on this sector appears justified, at
least for the purposes of short-term analysis building and construction
apart, it is here that cyclical fluctuations in employment have usually
been sharpest.
The study embraced the following Community countries : Belgium,
Germany, France, the Netherlands and the United Kingdom. No time series
are available for manpower expectations in the other Community countries or those that are available do not cover a sufficiently long period.
Generally speaking, the period investigated covers the years
1969-81; however, as the necessary data were not always available, shorter
periods had to be taken in some cases. In the case of Germany, for example,
the study covers the period up to the autumn of 1979 only since, after
that date, the surveys were conducted at quarterly intervals, and not
every four months as previously. For methodological reasons, linkage of the two periods proved difficult and was not undertaken 6
In Chapter II, a number of hypotheses are tested using empirical
data. In line with the theory of rational expectations, the starting
hypothesis is that firms make optimal use of all the information available
when preparin~ their manpower plans. The best forecasting values would
therefore be obtained by direct reliance on manpower plans. In order to test
this hypothesis an alternative estimation was carried out using other
determinants. Care was taken that only such values of the determinants were
used as were available when the manpower plans were presented. The rational
expectations hypothesis was also tested by incorporating in an estimating
function both the manpower plans and the values of a number of
employment-relevant determinants that were available at the time the plans were
presented. The other hypotheses were concerned with the forecasting
superiority of manpower plans in implementation functions and lastly
-somewhat modestly - with the usefulness of manpower plans in employment functions.
6
On this point and on the period investigated, see details in Chapter
Generally speaking it was found that while firms• manpower
plans do not meet the requirements of the ratiqnal expectations theory if
7
"rational" is narrowly defined as, for example by Muth ,manpower
expectations do not seem to be auto-regressive either. They can best be
described as "modestly-rational" or "semi-rational". This is to indicate
that firms clearly do rely on the information available at the time when forming their expectations and drawing up their plans. Probably on cost-benefit grounds, however, they do not use all of it and what they do use
does not appear to be processed in as optimum a way as the proponents of the
rational expectations theory imagine. The adjustment process,too,is clearly
slower and more erratic than is assumed in the strict version of the theory.
All in all, the investigation revealed that firms• manpower
plans normally make an important contribution to improving forecasts of cyclical
fluctuations in the number of persons employed. However, because of the
semi-rational nature of manpower plans, it is advisable in an estimating
function to use other factors along with empirically ascertained (survey) data.
Taking the example of Germany, Chapter III Looks at the relation-s hip between manpower expectationrelation-s and other burelation-sinerelation-srelation-s relation-survey variablerelation-s.
It will be seen that although a relatively close link exists between
production expectations and manpower expectations, this link
does not seem to be stable over the cycle. The same is true of the
relationship between manpower plans and views on the current business
situation. This is a further argument in favour of eliciting information
on manpower plans.through a direct question. Another interesting discovery
is that, contrary to neoclassical theory, there seems to be no close link
between manpower planning and the wage trend (change in real hourly wages>.
7 J.F. Muth, "Rational Expectations and the Theory of Price Movements",
Econometrica, vol. 39 (1961) pp. 315 et seq •• A useful review of the
theory of rational expectations can be found in T.J. Sargent and N. Wallace, ·"Rational Expectations and the Theory of Economic Policy",
5
-This must not, however, be taken to mean that the wage trend has no bearing
on the manpower trend. Other investigations have in fact identified a
significant relationship between wages and changes in employment in the
medium term of two to three years. In the short term, however, any such
relationship is clearly overshadowed by a number of other factors 8
Lastly, an attempt is made in Chapter IV to fit the study's
findings into the discussion of the theory of rational expectations. The
conclusion reached in the study, namely that empirically ascertained plans
and expectations are not rational in the strict sense of the term, means
that we cannot forecast such plans and expectations but must rely on
continuous, empirical collection of the relevant data 9• The implication
for economic policy is that empirically ascertained plans and expectations
are as it were macroeconomic market research findings that should be
carefully studied in order to determine whether the policy being pursued is tending to produce a stabilization of positive expectations in the
economic sector concerned.
By way of conclusion, the study looks at the implications which
the existence of "semi-rational" expectations has for the choice of
economic policy strategies. One strategy - which can be described as
Keynesian and demand-oriented- endeavours to make use of the limited
8
See, for example, H. Lehment,Der Einfluss der Lohnpolitik auf Produk-tion, Beschaftigung und Preise in der Bundesrepublik Deutschland seit 1973, Kieler Diskussionsbeitrage No 82, 1982.
9
Similar inferences ~an be drawn from other empirical studies,
espe-cially : K. Aiginger, "Empirical Evidence On The Rational Expectations Hypothesis Using Reported Expectations", paper presented to the World Congress of Econometric Societies, Aix-en-Provence, 1980.
F. Papadia and V. Basano, EEC-DG II inflationary expectations - Survey based inflationary expectations for the EEC countries, Economic
Paper No 1 (Internal paper>, 1981.
P. Praet, A Comparative Approach to the Measurement of Price Expecta-tions, Universite Libre de Bruxelles, D.T. (80) 27, 1980 (Internal paper>.
I. Wolters, Zum Zusammenhang zwischen Preiserwartungen des Ifo-Konjunkturtests und der tatsachlichen Preisentwicklung, Discussion Paper No 179-81, Institut fur Volkswirtschaft und Statistik,
10
trade-off that exists, at least in the short term , between the inflation
rate and the unemployment rate.
Th~ other ·strategy - advocated in particular by the proponents
of the so-called new classical macro-theory - focuses exclusively on
influencing the "natural" rate of unemployment, i.e. that degree of
underemployment which occurs under given structural conditions Cin
parti-cular, a given real wage Level, a given capital stock and a given supply
and demand structure) even when capital stock utilization is at a
cyclically normal level. The waiver of discretionary monetary and fiscal
policy measures, which is associated with this strategy, appears Logical
if, Like the proponents of the new classical macro-theory, we deny that
there is any trade-off between inflation and unemployment even in the
short term. Yet the findings of this study and of other empirical work have demonstrated that the basis for an economic policy strategy of this kind,
namely the assumption of strictly rational expectations, is unduly rigourous. However, even where expectations are "modestly rational" and
point, at least in part, to a trade-off between inflation and unemployment,
there are perfectly sound arguments in favour of pursuing an exclusively
'supply-oriented strategy of this kind. For a variety of reasons, it is
considered appropriate in this study to combine both economic policy
strategies in the situation of underemployment currently facing the
Community countries. But pursuit of the first strategy should not be
overdone as it often was in the past and is still being advocated by some Keynesians today. The policy of demand stimulation should be pursued only
until the "natural" Level of unemployment has been reached Cin Germany this
is equivalent to some 6.5 X at the moment 11
>;
it is not possible to force the actual level of unemployment below its "natural" level for any sustainedperiod of time.
10
This follows from the semi-rational nature of empirical expectations.
11
The Phillips c4rve would be vertical in the short term too only if expectations were strictly rational; there would then be no such trade-off in the short term.
For a more detailed analysis of the "natural rate of unemployment" CNRU) see G. Nerb, Konjunkturverlauf und Arbeitsmarkt. Erkenntnisse aus
(2)
7
-Because of the high level of hard-core unemployment in all
Community countries, a policy of demand stabilization must be accompanied
by a supply-side policy aimed at Lowering the "natural" unemployment rate. It is also essential to take back-up Labour market measures to
reduce the labour force potential (in particular, cuts in the working
week and in the Length of working life, job-sharing schemes and other 12
arrangements for part-time working)
II MANPOWER EXPECTATIONS HYPOTHESES FORMULATED AND TESTS CARRIED OUT
According to the theory of rational expectations, business
plans should provide the best possible forecast of the future trend of
employment. Long before this new theory was propounded, Modigliani and Cohen, in a somewhat more cautious manner, pointed out that empirically
collected planning data were normally superior to other forecasting
procedures 13
Empirical planning data can be used for forecasting purposes
either direct or in the form of so-called implementation functions.
Where no such data are available, forecasts are usually compiled by using
regression analysis to determine the relationship between the target
variable and the possible determinants during a particular base period
12
13
A useful an~lysis of the case for the various economic policy strategies, albeit one that comes to a different conclusion from that reached in this study, can be found in : L. Haberle,
Wirtschaftspolitik bei rationalen Erwartungen - Konsequenzen einer kritischen Analyse der Theorie rationaler Erwartun en fur die Wahl wirtschaftspolitischer Strategien, Untersuchungsreihe es Instituts fur Wirtschaftspolitik, No. 49, Universitat Koln, 1982.
F. Modigliani and K.J. Cohen, The Role of Anticipations and Plans in Economic Behavior and their Use in· Economic Analysis and
and then applying this to the forecasting period. The relationship observed
need not, however, be stable over time. It will, in fact, be unstable
whenever the structural approach does not take proper account of all the
factors. The reason for any misspecification may be that the path of the
target variable is influenced not only by the objective variables that have
been explicitly taken into account but also by subjective factors such as
assessments and other determinants. Such subjective factors cannot, however, be properly forecast using existing econometric methods.
By contrast, the use of empirically collected planning data
should present distinct advantages. It is fair to assume that the
determinants in question (assessments, sentiment) are already included in
such data, properly weighted - this is particularly important - for each
decision-maker. Even exotic determinants that are relevant for only a few firms and that cannot be taken into account using econometric methods are
reflected in firms• planning data.
Leaving aside the costs of collecting and compiling data, the
use of empir1cal planning data thus appears a priori as the clearly
superior approach. However, this conclusion is subject to the qualification
that it is conceivable, contrary to the assumptions made in the theory
of rational expectations, that firms do ·not make optimal use of the information theoretically available when drawing up their plans. Although this can
hardly be verified at macro level, there are many indications that
non-opti-mal planning at company level is often responsible for ex post/ ex ante
deviations at macro level. Moreover, data that are correct at micro level may
yield a not altogether satisfactory result at macro level,either because
the sample of the firms covered is not representative or because the micro planning data were not properly aggregated. In the case of trend surveys,
there is the additional problem of quantifying qualitative data 14
14 On the problem of transforming qualitative data into quantitative
data, see, for example, J.A. Carlson and M. Parkin, "Inflation
expectations", Economica 42, pp. 123-138, and G. Nerb,
Konjunktur-prognose mit Hilfe von Urteilen und Erwartungen der Konsumenten und
9
-In the present econometric study of manpower plans at macro
level the various causes of errors cannot be identified. The estimating
results presented are rather to be used to test a series of hypotheses
concerning the quality of planning data at macro level.
Hypothesis A
tirA~~-'!!.WLQ.~tt.P...l~~..:t.i~l<!_t~~.P-.~~t-t~r:~~~ttt_t~r:-t~~-t~r:a~t 'Lt.r:itb.lft_i.Jl._qy_~~t.iQ!l_t~Jli!.r1...9.~-irl-Q.YJ!.i2.~t~-~'!P..~qx_~qt_t.~~t-~C!!l-~Et._l!~c!~-~t-ttlEt.
t.i.Jn.f:._th.f:....D.lm~At.ft.At.~~fiD.t.~d..
This hypothesis can be tested by comparing the estimation on
planning data with estimations based on data other than manpower plans
provided this information is available at the time the plans are
presented.
The change in the numbers employed can be forecast directly
from manpower plans using regression equation (I) :
where~Bt is the percentage change in the numbers employed in period
t as compared with period t-1. The expression Pt_1 (t) denotes the manpower
plans for period t presented at the end of period t-1. A constant term
needs to be writ~en into equation I and into equations II, IV, V and VII
since the manpower plans and the change in the numbers employed are
measured on different scales. However, in the other equations too, the
Direct forecasting of the trend in the numbers employed using
planning data is also possible where plans are implemented with a time Lag. In the case in point, a change planned for the next period may conceivably
occur only in the next-but-one period. But given the question put (expected
change in the numbers employed in the coming three to four months), a time
Lag of more than one period (four months) appears unlikely. This Leads to regression equation (II).
It is thus assumed that the planning data adequately describe the extent of the change in the numbers employed but do not correctly indicate
the exact period when it is made. Equations I and II are compared with
regression estimations in which not only the change in real hourly wages (W) but also the change in production (Q) and the production expectations for the coming three months derived from business surveys figure as determinants.
To ensure that the values for these three determinants are indeed available
at the time the manpower plans are presented, they are written into
equation III with a time Lag of at Least one quarter.
Q
t-1 +
+ a33 (L)
The term (L) represents a polynomial of the lag operator L,
with Qt_1 (t), ~ Q and ~ W denoting the production plans, as qscertained
from business surveys, the change in the production index and the change in
hourly wages adjusted for price changes. If regression equation III were
to produce a better explanation or forecast than equations I and II, the
initial hypothesis ("firms' manpower plans yield the best forecasts that can be made at the time they are presented,.) cannot be maintained. It must also be rejected where inclusion of variables Qt_
1 (t), ~ Q or ~ W - each Lagged by at least one quarter - in equation I or II makes for a
significant improvement in the estimating results; : this would suggest
I I
-was taken into account in firms' planning data P. This hypothesis can
be tested using equation IV :
Hypothesis 8
!!_m~£r2_1!~!1£_!irm~~-m~ae2~~r_el~a~-~i~19_!h~-~~~1-e2~~i21~
~!el~a~!i2a
__
gf_~_£h~as~~-ia_sn~_ayme~r~-~mel2t~~-~~~a~!n~t-~r~_ia£2re2r~!~~
ia_imel~m~a!!!i2a_!Ya£!i2a~-An implementation function makes allowance for the fact that plans are in part conditional. Plans are altered if determinants change
during the implementation period (i.e. the period to which the plans refer).
In order to test this hypothesis, real hourly wages and the actual and
expected change in production 15 - in each case during the implementation
period appear in the function CV) together with manpower plans :
However, function V cannot be used for compiling
up-to-date forecasts since it incorporates a number of unlagged determinants,
i.e. determinants not available at the time of forecasting. Hypothesis 8
cannot be rejected if the estimating performance of function (V) is significantly
15
These are variables that theoretical considerations but also empirical studies have shown to be significant for manpower plans <see Chapter
better than one based on an estimating function in which such planning
data are not included
Hypothesis C
!o~lY~iQD_Qf_m!oeQ~~r_el!o~_m!~-~ob!o~~-!b~-~~!im!!ios !££Y£!£~_Qf_!D-~!i~!iDS-~meiQ~ID~D!_fYD£!iQD~
Whereas hypotheses A and B are rigourous in the sense that the
empirical manpower expectations are seen as providing the relatively -best forecasting or explanatory variables, the planning data in hypothesis
C are deemed to be of only relative use in the sense that their inclusion
makes for an improvement in an existing explanatory function :
Like equations V and VI, equation VII can be used solely for
providing an a posteriori explanation of changes in the numbers employed.
It cannot be used for compiling up-to-date forecasts of such changes.
Comments on the ~egression estimations
Before the regression results are discussed, a number of points
need to be made regarding the data used, the period investigated and the estimating equations applied. The question asked in Germany to obtain
information on manpower plans, our main concern in this study, is as
L
1 3
-Looking at the underlying trend, i.e. excluding purely seasonal variations, the number of workers employed by our firm will in the next three or four months
- rise ;
- remain broadly unchanged ;
- ~ecline.
The wording of the question is largely identical in all Community countries. The question itself forms part of the so-called harmonized programme of EEC business surveys in the countries of the European Community.
As agreed w;th the EEC Commission, this question must be put at least twice a year, in the spring and in the autumn. Most member countries now, however, ask it at least three times or even four times a year. Up to and including 1978, there were three annual surveys in France (March, June and November) and a fourth has since been inserted
(January, March, June and November). In Germany, this question ~as put
twice a year in the period 1963-70 (May and October) and three times a year in the period 1971-79 (January, May and September>; since 1980, it has been asked four times a year (January, April, July and October>. In the NetherlaDds and Belgium, three surveys are conducted per year (february/ March, June and October>. In the United Kingdom, three results per year are available for this question in the period 1959-71 (february, June and October>; since then, four surveys have been conducted annually (January, April, July and October).
The.,periods investigated were as follows : 1969-81 in France, 1971-79 in Germany, 1974-81 in the Netherlands, 1970-81 in Belgium and 1971-81 in the United Kingdom. Germany and the Netherlands apart, the period in each case takes in the years 1971-81. It is shorter in Germany
(1971-78) because the survey method was changed and official employment statistics modified with effect from 1980. The tentative estimates that
were none the less made for the period up to the end of 1981 yielded
.
1971-79. In the Netherlands, appropriate survey results are available only
from 1974 onwards. Italy was not included in the investigation since,
generally speaking, appropriate survey results are available there only twice a year (June and October). In the other member countries not covered
(Denmark, Luxembourg, Ireland and Greece), either no survey data on this
question are available or what data are available do not cover a
sufficiently long period.
The above question leaves doubts as to which values from
official statistics should be compared with the business survey res·ults. One main difficulty is that it is not known a priori how many months the
manpower planning period comprises for the individual firms and to what extent firms do in fact eliminate from their planning data purely
seasonal variations in the numbers employed. In order to test the predictive
value of firms• ex ante reports, various time-series comparisons were
therefore made in an earlier study - carried out on behalf of the Federal
Labour Office of Germany 16 -between business survey results and ex post
data from official statistics.
The main findings of that study can be summed up as follows
ex post values came closest to firms• expectations when the reference variable from official statistics was the average percentage change in the
numbers employed in the next four months as compared with the average for
the preceding four months. It would appear therefore that, in their
ex ante data, firms are guided less by the numbers Likely to be employed
by them at the end of the planning period than by the average trend in the
numbers employed over the next four months.
ALL the regression equations were based on a multiplicative approach. This was because the value pairs "survey balance of firms•
man-power expectations" (taken from the business survey) and "actual rate of
change" (taken from official statistics) point to the existence of
16
(3)
1 5
-non-linear relationships. To judge by the scatter diagrams, the
relationships between the survey balance and the actual values should
correspond to a higher-order type of function. A possible explanation
is that the business survey is a cyclical barometer that is highly sensitive
to small quantitative changes. Even minor changes in economic variables
show up clearly in the business survey results. However, the greater the
quantitative changes, the smaller the relative increase in the corresponding
proportions in the reports. It was therefore assumed in the regression
equation that a multiplicative Link existed between the determinants.
It is also to be noted that the qualitative variables used were
balances from the business surveys (i.e. differences between the weighted
positive and negative replies). Such balances can be compared with rates
of change but not with Levels from quantitative index series. For this
reason, the actual number of persons employed, the Level of production,
and real hourly wages as derived from official statistics were transformed
into first differences, i.e. into rates of change. ALL the data were
expressed in Log terms to take account of the_non-Linear relationships
that clearly existed. They were not seasonally adjusted but seasonal
dummies were written into the regression equations to allow for possible
seasonal variations. The estimated seasonal coefficients are not given below
since they are of secondary importance to the subject matter of our study.
Short description of the symbols used iri tables 1-5
Manpower plans for the period t, about which firms are
questioned at the end of period t-1. Survey balances.
Production expectations for the coming three months. In the
United Kingdom, business expectations are used instead of
production expectations. In Belgium, the "courbe synthtHique"
is used. Only those months in which the question regarding
Bt Number of persons employed in manufacturing in period t. In Germany
and in the United Kingdom, the rate of change~ Bt is calculated by
relating the average number of persons employed during the four months following the month in which the survey of manpower plans was conducted to the figure for the preceding four months. In the other countries, the planning data were used to forecast the numbers employed in the following quarter. Rate of change in X.
Production index for manufacturing. The rate of change ~ Qt was
determined in the same way as~ Bt ; rate of change in X.
As a rule, the index of hourly wages or the wage and salary bill in industry deflated by the index of industrial producer prices or by a proxy. In France and the Netherlands, the nominal wage trend was taken since neither country possesses a suitable deflator for
industrial production. For the determination of~ Wt, see the·
comments on
Ll
at. Rate of change in X.TABLE 1 -REiiRESSION RESULTS GERMANY -1971.1-1979.3 Equ. Coefficient (stdd.error of) Mean Lag of SEE
rf
•
(1l·1) f.::.{l
c
p t-1 (t) p t-2(t-1)Q t-1
TABLE 2 -RffiRESSION RESULTS GREAT BRITAIN 1971.3 ,., 1981 '\4 Equ •. Coefficient (stdd.error
of) !::,
f.:l
c
P t-l<tb
P t- 2 <t-1>
Qt-1 <~> Qt-1 wt-1 I GB -.004 .032 ( .001) ( .002) II GB -.004 .040 -.008 (.001) (.00~) (.004) IIIGB-.009 ( .008)
IV GB -.005 .029 · ( .002) ( .002) .009 .391 -.067 (.004) (.108) (.135) .004 .048 -.058 (.002) (.075) (.052)
c
pt-1(t) pt-2(t-1) Qt-1(t) Qt wtv
GB -.006 .032 -.002 .082 -.015 (.001) (.004) (.004) ( .022) ( .0111) VI GB -.008 .001 .440 -.118 (.007) (.005) (.117) (.131) VIIGB -.008 .029 .002 .116 -.065 (.003) (.002) (.002) c.oqr) c.oLJ6) Mean Lag of SEE R 2 Qw
( W) .0036 .9()6 (0.76) .0035 .917 (1.36) 2.52 3.66 .0075 .689 (0.53)Q e
.5.19
.0029
•
952 (1.51)
\ol 0
TABLE 5 -RFIIRFSSION RESULTS tJETHERLANDS 197ll.2 -1981.3 Equ. Coefficient (stdd.er~or of) 1·1ean Lag of SEE R2 ~
l:l
(ll·!)c
Pt-1<t> Pt-2<t-l)0
t-1<t>0
t-1 wt-1 Q,,
•
INL -.013 .020 .0079 .565 ( .004) ( .011) ( 1. 78) IIINL -. 0011 -.009 .631 -.11111 1.47 3.71 .0073 .786 ( .019) (.013) (.2311) (.176) (2.24) IV NL -.001 -.011 -.010 .710 -.2211 1.119 6.58 .0075 .792 (.001) (.012) (.001) (.286) (.239) (2.06) ~ l:lc
pt-1(t) pt-2(t-1) Qt-1(t)Qt
wt
Q \rJVNL
-.011 .020 -.026 -.096 () 0 .0082 .582N
Regression resu~ts
Hypothesis A (Forecasting superiority of manpower plans - Equations I, II, III and IV)
Manpower plans explain much of the variance in the trend of
the numbers employed (equation I); this is true of all the five countries
investigated, although a below-average result was recorded for the
Netherlands CR2 in estimating function I : 92.9 for Germany, 90.6 for the
United Kingdom, 85.9 for France, 80.0 for Belgium and 56.5 for the
Netherlands). Inclusion of manpower plans Lagged by one period- this
was done only for Germany and the United Kingdom - made for only a small improvement in the estimating results in each case (measured in terms of
2
the SEE; R
>.
In both cases, however, the Durbin-Watson measure forautocorrelation showed a significant improvement. The negative sign for the
Lagged manpower plans Pt_
2 (t-1) refutes the assumption that errors occur in respect of the Length of the planning period. It rather suggests some
degree of regressivity in manpower plans, i.e. a Lasting reversal of the
direction of expectations that produces a negative correlation between the
actual change in the target variable and the Lagged planning data 17
The estimation of the change in the numbers employed that was
carried out for control purposes using variables other than empirically
ascertained manpower plans yielded results that differed between the
countries concerned (estimating function III). In the case of Germany,
function type III cames out slightly better than function types I and II if we
Look at the standard deviation of the residuals, the coefficient of
determination and the Durbin-Watson measure.
A similar result is obtained for France. In Belgium and the Netherlands, the superiority of estimations based on function III was not
only gradual in kind but also very tangible. It was only in the case of the
17 On the matter of regressivity in plans and expectations, see also
2 3
-United Kingdom that an ex post forecast of the trend in the numbers
employed, comptled using empirically ascertained planning data,
yielded significantly better results than an alternative estimation based
on function III. Especially the decCihe"in--the number of persons empl'oyed in the United Kingdom in 1980 and 1981 cannot be explained using regression
equation III; this yields a low value for the Durbin-Watson statistic for
that country.
The estimating results obtained using function type IV were
found to be superior to regression equations I, II and III in all the
countries investigated. It is evident, therefore, that the explanatory
and forecasting power of manpower plans can be enhanced by incorporating additional explanatory variables in an implementation function. Like a
host of other empirical investigating results, this result refutes the
theory that the expectations of economic agents are rational in the
strict sense of the term. The assumption of modestly rational
expectations would seem to be more realistic (see Chapter IV). This study
has also demonstrated that, in their manpower expectations, firms do not
make· use, or do not make optimal use, of all the information available
to them when plans are presented.
The predictive value of the additional determinants investigated, viz. production expectations (or business expectations in the case of the
United Kingdom and the "courbe synthetique" in the case of Belgium, where
the time series of production expectations are not long enough), the actual
change in production and the trend in real hourly wages, is not the same in
all the countries. In Germany, but also in the United Kingdom and France,
the influence of production or business expectations in particular could be clearly demonstra·ted statistically in function type III. By contrast, in the
Netherlands, the trend in the numbers employed is much more strongly
influenced by the past trend of production than by the other explanatory
variables. In the light of the present study, no clear-cut conclusion can be drawn regarding the significance of real wages for the demand for labour.
The coefficient of real wages even has a positive sign in Germany and
France. This would be consonant with the purchasing power theory, which is
championed by the unions in particular and according to which the employment
which is in absolute opposition to the new classical macro theory, must not,
however, be exaggerated. Even convinced proponents of this new theory
concede that the negative relationship which they claim exist between the real wage level and the trend in the numbers employed- i.e. the lower
the level of real wages, the higher the numbers employed holds only in the
medium term and is overshadowed in the short term by various other
factors 18• In the United Kingdom, Belgium and the Netherlands, we obtain
for the influence of real wages at least the negative sign postulated by
neo-classical theory. But even in these three countries the influence of
wages could be only weakly demonstrated using the statistical test measures.
The conclusion concerning hypothesis A is that a forecast based
solely on manpower plans does not, as the rational expectations theory would suggest, yield the best possible estimating values. In all the cases
investigated, a better result is obtained by combining the planning data with other determinants (estimating function IV) than by using these data
direct; in most cases, however, the improvement thus achieved was only
limited since, with the exception of the Netherlands, the direct approach
itself yielded good estimating results. Hypothesis A in the narrowly sense
(manpower plans cannot be replaced by different, lagged variables, i.e. comparison of the estimating results of functions I and II, on the one
hand, and those of function III, on the other) had to be rejected
except in the case of the United Kingdom.
18
Roth and Lehment, for example, come to the conclusion that the
strongest positive employment effects of wage restraint make themselves felt· only two to three years later. This would be an argument among other things against a one-off wage freeze and in favour of a
moderate wage policy covering a longer period. (See H. Lehment,
Der Einfluss der Lohnpolitik auf Produktion, Beschaftigung und Preise in der Bundesrepublik Deutschland seit 1973, Kieler Diskussionsbeitrage
No 82, February 1982, and J. Roth, Mehr Beschaftigung durch
Testing hypothesis B
2 5
-(forecasting superiority of manpower plans in implementation functions)
The results obtained using estimating function IV are an indication of the empirical relevance of hypothesis B, according to which the best possible results are obtained by incorporating data on manpower planning in an implementation function. This is to be investigated by comparing the estimating results obtained using functions V and VI. It should be remembered that the only difference between function IV and function V is that equation IV is a pure forecasting function into which only values are written that were available before the beginning of the forecasting period. In implementation function V, however, the values for the variables production expectations or business expectations (the latter in the case of the United Kingdom), actual change in production and actual change in real wages extend into the forecasting period. Consequently, the up-to-date values of these three variables are not known in a genuine
forecasting situation. The purpose of function V is to reveal the influence of changes in the "general economic environment" that occured after
presentation of the manpower plans but during the implementation phase (forecasting period). The estimations made using function type VI serve to test hypothesis B in that they represent an attempt to proviAe an alternative explanation for the trend in the numbers employed (i.e. no use is made of manpower planning data). Both function V and function VI are in the nature of explanatory models, not forecasting models.
As the empirical regression results show, hypothesis B probably
holds only for the United Kingdom, where an explanation system base~ solely
on the trends in production and wages andon produ:ct'ion expectations yields a distinctly worse result than if manpower plans are used direct. In France,
too~ though to a much Lesser degree, implementation function V is found to
be superior to control function VI (assessment criterion : standard
deviation of the residuals>. In Belgium and the Netherlands, implementatiorl function V is clearly inferior to function type VI in explaining
fluctuations in employment. It is worth noting that current production Qt
influence implementation function V very significantly in Germany and in
as was the case in functions III and IV, we even find a "false", i.e.
positive, sign in Germany. This suggests that, unlike changes in the real
wage trend, unexpected changes in production affect the implementation of
manpower plans (at least in the short term).
Testing hypothesis C (Improving the existing employment functions by
inclusion of manpower plans as an explanatory variable)
According to this hypothesis, manpower plans enhance the quality
of existing employment functions. The difference between function type IV and function type VII is simply that the former is a forecasting function
and the latter an explanatory function. This is apparent from the fact that
only values available before the beginning of the forecasting period were
used on the right-hand side of the equation in function IV. In function VII,
on the other hand, use is also made of current values of the explanatory
factors, that is to say of values relating to the implementation stage of
the manpower plans, i.e. the forecasting period. As the empirical results
show, manpower plans in all the countries except the Netherlands make a
significant explanatory contribution in function VII. This is particularly so in the United Kingdom but also in France.
Comparison of the results for implementation function VII and
those for forecasting function IV reveals that there are generally only
small differences in the standard error and in the coefficient of
correlation. As could be expected, these measures are usually somewhat
better in the case of the explanatory function than in the case of the forecasting function (the only exception being the Netherlands). The
contribution made by manpower plans to reducing the variance is broadly identical in-both types of function; in the case of Germany and the
United Kingdom, it is noticeable that if current production levels are
taken into account, ·this indicator gains in significance relative to
production expectations (estimating function VII).
To sum up, it was only in the United Kingdom that manpower
2 7
-than the other variables looked at, irrespective of whether the latter entered the estimation as lagged or unlagged variables (I and II as against Ill). In the case of the United Kingdom too, however, that part of hypothesis A according to which manpower plans already contain all the relevant information had to be rejected. Hypothesis B (manpower plans are superior to other variables in the trend in the numbers employed) had to
be discarded in ~he cases of Belgium and the Netherlands. For Germany and
France, the results yielded by both approaches were more or less equally good; only in the United Kingdom do the results once again point clearly to the superiority of manpower plans. Lastly, hypothesis C (employment plans make a significant but not a dominant contribution to explaining
fluctuations in the numbers employed) had to be rejected only in the case of the Netherlands. The fact that, in all countries except the Netherlands, the manpower plans in forecasting function IV, i.e. combined with other determinants, make a statistically well-founded contribution is particularly important for up-to-date forecasting. Such an "indirect" estimation based on manpower plans is invariably superior to a direct forecast (where
manpower plans are simply quantified without ~ny other factors being taken
into account>. This suggests that manpower expectations are not rational in the strict sense of the theory but can best be described as semi-rational
Cse~ Chapter IV>.
III DETERMINANTS OF MANPOWER EXPECTATIONS
costs back to the level initially planned. Indeed, it is quite likely that
they will attempt to compress the share of wage costs further through
rationalization measures in order to come closer to their original profit
target in spite of the deterioration in market conditions.
However, there is little in the results of this econometric study to suggest such a manpower policy, at least in the short term. Other
empirical studies have also demonstrated that the real wage level does not
significantly influence the level of employment, at least in the short term.
With this time horizon, the employment-boosting effect of wage restraint
is clearly overlaid by a number of other factors. Most of this effect makes
itself felt only after some two to three years of an uninterrupted policy
19
of wage restraint
Even the implementation function presented in this paper produced very little, if any, statistical evidence that real wages were
an additional determinant alongside manpower and production expectations.
This may, however, be due to the fact that manpower expectations already
take the influence of real wages fully into account. For this reason, the
relationship between the planned manpower trend and the trend of real wages
'
was looked at once again, but separately this time. Yet no statistical
evidence of such a relationship was discovered. The same goes for the
influence of price expectations on manpower planning. Differences between price expectations and prices actually fetched produced an even less
satisfactory explanation than price expectations themselves. This probably has to do with the fact that price expectations are surveyed each month
.
(and, as a result, changes in price expectations show up very quickly in
this series. Consequently, the remaining differences between price
expectations prices actually fetched usually very small.
We also looked at the extent to which the manpower expectations
reported were influenced by the data yielded by the business survey on :
19
2 9
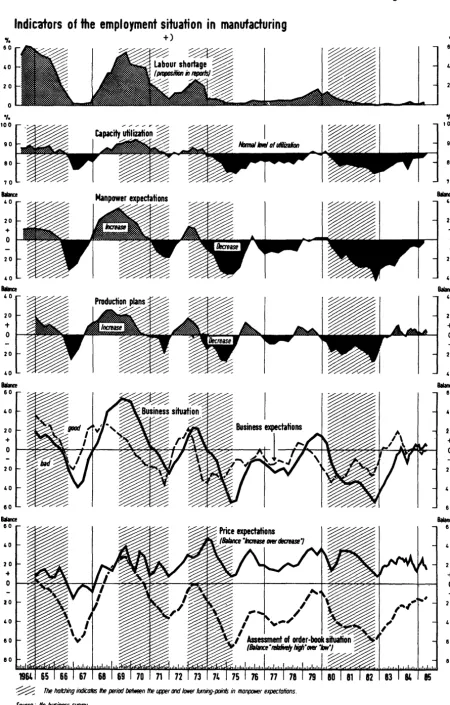
-- trend of production compared with a month earlier (survey balances>; - production expectations for the next three months (survey balances>; - current business situation (survey balances>;
- trend of business expected in the next six months (survey balances>; - assessment of current order-book situation (survey balances>;
-plant capacity utilization Cas X of normal operating limits>.
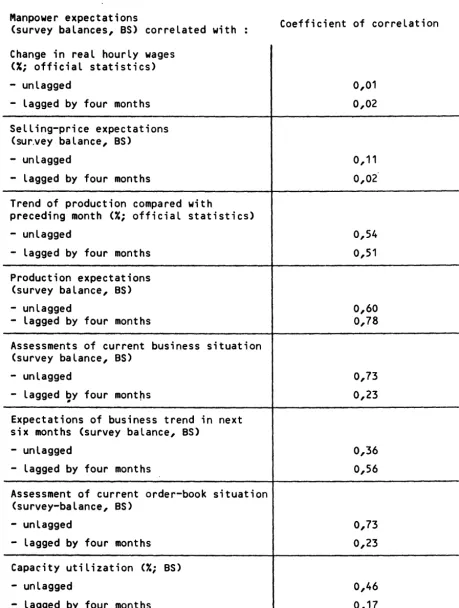
It was found that manpower planning was consistently much more closely related to these indicators than to changes in real wages or to selling-price expectations. This suggests that the current order position and business expectations are the dominant factors behind short-term adjustments in the numbers employed. It is worth noting that in virtually all cases the correlation was closest whenever no Lags were assumed in the relationship between manpower expectations and determinants. This is an indication that a Large proportion of the information contained in the other variables immediately feeds into manpower expectations. None the
less, as we saw when discussing the regression investigations, a
significant improvement in the manpower forecast is obtained if other test variables, and in particular production expectations, are taken into
Indicators of the employment situation in manufacturing
.,,
60 40 20 0
SUe
60 40 20
+
+)
~ ~
lab11ur shortage ~
(fJI(JIJIJSiiKJnin"fJJJffs)~
o r-~~~~-+-*--~~~~~~~~~~~--~rr
20 40 60
~ The holcting indicates lhe period between lhe uwer and lower IIAning-poinls in mofi{J(Mer expectations.
Source: Ho business .sutVef.
IFO-INSTITUT fur Wifllehaftsfoncflune Milnchen
•
'1.
60 40 20
0
.,.
100 90 80 70 20
+
0
20 40
Balance
40 20
+ 0
20 40
Bllance
60
loO
20
+ 0
20 40 60
3 1
-Table 6
Relationship between manpower expectations and possible determinants - the case of Germany
Manpower expectations
(survey balances, BS) correlated with
Change in real hourly wages <X; official statistics> - unlagged
- lagged by four months
Selling-price expectations <sur.vey balance, BS)
- unlagged
- lagged by four months
Trend of production compared with
preceding month <X; official statistics) - unlagged
- lagged by four months
Production expectations (survey balance, BS) - unlagged
- lagged by four months
Assessments of current business situation (survey balance, BS)
- unlagged
- lagged by four months •
Expectations of business trend in next six months (survey balance, BS)
- unlagged
- lagged by four months
Assessment of current order-book situation (survey-balance, BS)
- unlagged
- lagged by four months
Capacity utilization <X; BS) - unlagged
- lagged by four months
as
=
Ifo business surveyCoefficient of correlation
0,01
0,02
0,11
0,02
0,54
0,51
0,60 0,78
0,73
0,23
0,36
0,56
0,73
0,23
0,46
[image:34.595.71.531.122.731.2]IV POSITION WITH REGARD TO THE RATIONAL EXPECTATIONS THEORY AND ECONOMIC POLICY CONCLUSIONS
The expectations of economic agents play a central role in
modern economic theory and in the economic policy recommendations based
thereon. The rational expectations theory represents a very rigorous
system for explaining the phenomenon of stagflation, that is to say the
mixture of inflation, stagnation and unemployment, with which we have had
to contend since the mid-1960s and, above all, in the 1970s. According
to this theory, the failure of Keynesian employment policy in the period
since the mid-1960s can be put down to the fact that economic agents,i.e.
both managements and consumers, are no longer subject to money illusion.
Expansionary monetary and fiscal policy measures, so this theory tells us,
no longer trigger a rise in production and an increase in the number of
persons employed but simply lead to higher prices.
In its "strict version", the rational expectations theory
based on very restrictive assumptions. It is assumed, for example, that
economic agents are in possession of all the information available, make
the best poss"ible use of that information and hence are aware of the "true"
model of economic relationships. It is also assumed that firms and
consumers.do in fact act in line with these expectations. The Phillips curve
would thus be vertical, not only in the long term but also in the short. In
other words, there is no trade-off between the inflation rate and the
unemployment rate, the consequence being that an expansionary monetary and
fiscal policy simply generates higher inflation and does not reduce
unemployment.
Just how realistic are these assumptions regarding the
expec-tations of economic agents Numerous empirical studies have revealed that
neither the expectations of firms nor those of consumers are rational in
the sense postulated by the theory. To date, in addition to price
., 33
-investment and production expectations have been studied 20• The
analysis of manpower expectations made in this study also refutes the argument that expectations are rational in the sense postulated in the strict version of the theory. Clearly, in forming their expectations, economic agents do not take all information into consideration or are unaware of the "real" model essential to the proper evaluation of information. Although it is not possible to distinguish empirically
between these two influenc~s, it is a fact that all the empirical
studies of which the author is aware contain systematic errors in the expectations. This shows up in the fact that the deviations between anticipated and actual values are not random but have a systematic component.
However, this systematic error is usually not very great. For example, provided the statistical base is sufficiently representative and provided a suitable measuring scale is used, the correlation between
empirically ascertained expectations and outturns is,as a rule,surprisingly close.
However, as noted earlier, systematic divergence~ are discernible in most
cases, e.g. underestimations during a cyclical upswing and overestimations during a cyclical downsing. This study has demonstrated that the relation-ship between ex post and ex ante data can be improved appreciably by including additional information in an implementation function.
There are a number of explanations for the lack of complete agreement between expectations and outturns. In contrast to what the rational expectations theory assumes, some of the costs involved in obtaining and evaluating information and in making the adjustment deemed
necessary are f~irly high. On cost-benefit grounds, therefore, some
information is not utilized or adjustment processes are not initiated or are initiated with considerable delay. Yet, even if economic agents were prepared to shoulder these costs, there would still be divergences between ex post and ex ante values since, at least where economic theory
20 See, for example, K. Aiginger, Empirical Evidence on the Rational
Expectations Hypothesis using Reported Expectations, 1980, loc. cit., or P. Praet, A comparative Approach to the Measurement of Price
stands at the moment, no one possesses the true forecasting model into
which the information needs to be fed.
All in all, the findings of this study, like plenty of other
empirical studies, are arguments in support of a "weak" version of the
rational expectations theory. The relevant literature refers to
"semi-rational" expectations 21• It is assumed here that economic
agents do not possess all the relevant information and that adjustments do
not take place as promptly as is postulated in the "strict" version of the
theory. Rather, cost-benefit considerations of economic agents determine
the amount of information they possess and hence the duration of both
the learning and adjustment processes.
The extent to which such cost-benefit considerations are taken
into account fluctuates during the course of a business cycle. This is
mainly because the learning processes of economic agents are not
mechanical and because the readiness of both firms and consumers to take risks varies unpredictably over the cycle. Rational expectations (in the
"strict" version of the theory) represent a theorical but in practice
highly improbable borderline case of semi-rational expectations.
It is this cyclical flexibility in ·particular that also
distinguishes semi-rational expectations from the autoregressive
"expectations" frequently employed in econometrics (adaptive, regressive
and extrapolative>. These theoretical constructions of expectations are,
of course, esttmated in a purely mechanistic manner using past values of
the same variable. For this reason, they usually contain a substantial
systematic error~ By contrast, empirically ascertained data on
expectations, such as those collected in the context of the EEC business
and consumer surveys, represent genuine expectations. As noted earlier,
it cannot be assumed however that all respondents make use of all the.
21
3 5
-relevant information. On average, their level of information is much
lower than is assumed in the "strict" version of the rational expectations
theory. Whatever the level of information, there will also be significant
differences in the way economic agents handle information, ranging from
simple trend forecasts to highly complex forecasting systems.
What inferences for empirical economic research and for economic
policy are to be drawn from the conclusion reached in this study and in various other studies, namely that, as a rule, expectations from
representative surveys represent data that can best be described as
"semi-rational" ?
The main implications for empirical economic research are that
a mechanistic expectation-forming process (autoregressive expectations)
cannot be assumed and that decisions and actions are not taken in such
a rational fashion as postulated in the rational expectations theory.
If the theory were right on the Latter point, tt would be sufficient,
given an effective price mechanism, to keep a close watch solely on price
movements in order to ascertain the expectations of economic agents.
For the above reasons, both the expectation-forming process
and the decision-making process are much more complex and cannot be
predicted using conventional econometric methods. There is therefore no
substitu~e for empirically ascertained data on expectations such as those
yielded by the EEC business and consumer surveys. However, as this study
has clearly demonstrated, making optimal use of the planning data does not
mean converting them directly into quantitative forecasts.
Instead, it is better to incorporate planning data into an
estimating model together with other information.
The main implication that the "semi-rational" nature of
empirically ascertained data on expectations has for economic policy is
that, contrary to what is asserted by proponents of the new classical macro theory, there is at Least some room for discretionary measures to
1 4
1 3
1
2
1 1
1
0
9
8
7
6
5
3
2
1
0
1
F1g. 2
THE PHILLIPS CURVE
Inflation rate (%)
Short-term
NRU
Phillips curve
Cyclical
Overemployment
Underemployment~~
I
·•.
I
: I
I
J
J
I
I
i
I
lA*
I
2
3 45
6 7 8 910
11
12 13 14
15
1 6 5 4 3 2 1
3 7
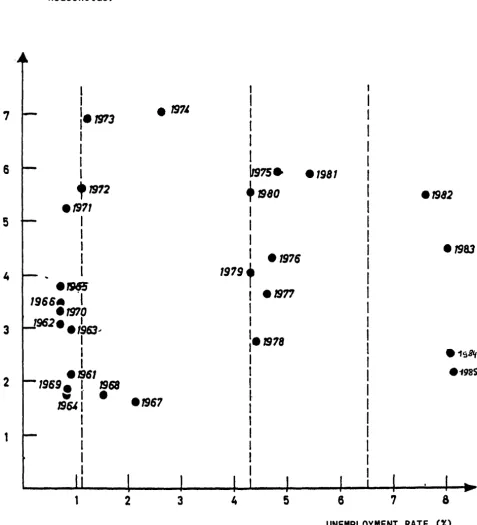
-Germany Fig. 3.
RELATIONSHIP BETWEEN INFLATION RATE AND UNEMPLOYMENT RATE
Inflation rate
<X>
(Cost-of-Living
index for all private households)
l I
• 191/,
'• S'/3
I
II
I I,1912
e/911I
I
II
I
•rslf!·
1966a
I
emo
1962
•
etk63--I
I
Ies61
1969e I 1968
w I .
•
.1961 19641
I
I
II
I1 2 3
I
I
II
I
I
lt975•
.1981+sso
e1982I
I
I
I
.1976 .19831919,
I es11
I
I
1e1918
e1satt
.198)
4 5 8
7
8UNEMPLOYMENT RATE
CX>
Legend : The dotted lines are to be seen as indicating the "natural" unemployment rate. It is necessary to imagine a series of Phillips curves around these vertical lines (see Fig. 2) which, in the short term at least,
[image:40.588.57.535.198.723.2]