A Framework for Understanding
Small Nervous Systems
The Harvard community has made this
article openly available. Please share how
this access benefits you. Your story matters
Citable link http://nrs.harvard.edu/urn-3:HUL.InstRepos:37944977
Terms of Use This article was downloaded from Harvard University’s DASH repository, and is made available under the terms and conditions applicable to Other Posted Material, as set forth at http://
A Framework for Understanding Small Nervous Systems
A dissertation presented by
Jeffrey Boryean Lee to
The School of Engineering and Applied Sciences
in partial fulfillment of the requirements for the degree of
Doctor of Philosophy in the subject of Applied Physics
Harvard University Cambridge, Massachusetts
iii
Advisor: Prof. Sharad Ramanathan Jeffrey Boryean Lee
A Framework for Understanding Small Nervous Systems
Abstract
How do we find important neurons and understand how their dynamics control behavior?
Both of these are challenging and general problems in neuroscience. In this dissertation
supervised by Sharad Ramanathan, I developed a framework to efficiently search for
essential neurons and verify them individually using precise perturbations and
measurements. I applied this framework to the small nervous system of the nematode C.
elegans and uncovered neurons that control speed. Working with Dr. Ching-Han Shen,
Dr. Josselin Milloz, and Tim Hallacy I screened through 41 transgenic lines that covered
more than 82% of the nematode nervous system and uncovered a sparse set of three
neurons which affect speed when inhibited. To measure their dynamics in freely moving
animals, I worked with Dr. Askin Kocabas and Abdullah Yonar to develop a real-time
image stabilization microscope that enabled me to stimulate individual neurons and probe
their dynamics on the order of an hour which previously was not possible. I also
developed a frequency division multiplexing imaging system which can read out pixel
information faster than traditional CCD cameras. Using these tools, I showed that the
dynamics in the sparse uncovered neurons were correlated with speed and also observed
novel slow dynamics on the scale of tens of minutes in several other neurons. In summary,
this study provides a framework to identify and study circuits essential for controlling
iv
Table of Contents
Abstract ... iii
Table of Contents ... iv
List of Figures ... vii
Acknowledgements ... x
Chapter 1. Introduction ... 1
1.1. Approach to understanding neurons and circuits ... 1
1.2. C. elegans as a model organism for studying small nervous systems ... 3
1.3. Overview of framework ... 5
Chapter 2. Uncovering neurons essential for behavior ... 8
Abstract ... 8
2.1. Introduction ... 8
2.2. Results ... 12
2.2.1. Simulation of multiple-neuron inactivation behavioral screen ... 12
2.2.2. L1 norm analysis of unc genes reveals motor neurons affect uncoordinated locomotion phenotype ... 16
2.2.3. Constructing transgenic lines from known promoters driving Archaerhodopsin-3 expression in groups of neurons ... 17
2.2.4. High-throughput behavioral screen... 19
2.3. Discussion ... 26
2.4. Materials and Methods ... 29
2.4.1. Strains ... 29
2.4.2. Promoter expression and neuron identification ... 29
2.4.3. Behavioral Assay and Image Processing ... 30
Acknowledgements ... 31
2.5. Supplementary Information... 31
Chapter 3. Measuring and perturbing neurons in freely moving animals ... 33
Abstract ... 33
3.1. Introduction ... 33
v
3.2.1. Real-time Tracking and Image Stabilization ... 43
3.2.2. GFP Controls to characterize motion artifacts and sampling noise ... 46
3.2.3. Targeted illumination in freely moving worm with spatially patterned light 48 3.3. Discussion ... 50
3.4. Materials and Methods ... 52
3.4.1. Tracking ... 52
3.4.2. GCaMP Imaging ... 57
3.4.3. Structured Illumination ... 58
3.4.4. Image Analysis of GCaMP data ... 58
Acknowledgements ... 60
Chapter 4. Frequency Division Multiplexing Point Detector Camera ... 61
Abstract ... 61
4.1. Introduction ... 61
4.2. Results ... 65
4.2.1. Array of frequency encoded pixels were generated by intersecting sinewave patterns 65 4.2.2. Experimental Setup ... 66
4.2.3. Imaging ... 68
4.3. Discussion ... 70
4.4. Materials and Methods ... 71
4.4.1. Spinning disk fabrication, mounting, and leveling ... 71
4.4.2. Setup ... 74
Acknowledgements ... 74
Chapter 5. Calcium Imaging and Targeted Photo-activation ... 75
Abstract ... 75
5.1. Introduction ... 75
5.2. Results ... 77
5.2.1. Targeted inhibition of key neuron RMG ... 77
5.2.2. Calcium imaging reveals neurons with fast or slow dynamics ... 79
vi
5.3. Discussion ... 84
5.4. Materials and Methods ... 86
5.4.1. Strains ... 86
5.4.2. Odor delivery ... 86
Chapter 6. Discussion ... 87
6.1. Summary ... 87
6.2. Slow dynamics and bandwidth ... 90
6.3. Signaling molecules and context dependence ... 91
6.4. Conclusion ... 92
References ... 93
vii
List of Figures
Figure 1.1: C. elegans modulates its speed on timescales of seconds to many minutes. ... 7
Figure 2.1: Simulated network with sparse key neurons resembling C. elegans nervous system. ... 13
Figure 2.2: Simulation of inactivating random groups of neurons and measuring phenotype. ... 14
Figure 2.3: Sparse signal is perfectly recovered using L1-norm minimization. ... 14
Figure 2.4: Sparse signal is not recovered using L2-norm minimization. ... 15
Figure 2.5: Rate of convergence to correct solution depends on the number of neurons inhibited per measurement. ... 16
Figure 2.6: Sparse solution coefficients and network controlling “uncoordinated”
movement. ... 17
Figure 2.7: 41 transgenic lines in Archaerhodopsin-3 speed behavioral screen cover >82% of the C. elegans nervous system. ... 19
Figure 2.8: Archaerhodopsin-3 activated behavioral screen assay. ... 20
Figure 2.9: Speed phenotype for 41 transgenic lines as measured by Kullbach-Leibler divergence. ... 23
Figure 2.10: Sparse solution (L1-norm) and L2 coefficients and network controlling forward speed. ... 25
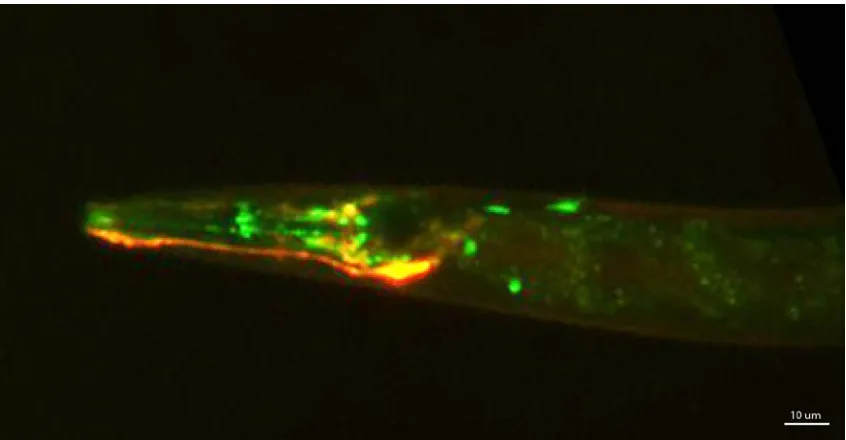
Figure 3.1: Fluorescence image showing a worm head with co-expressed marker neuron AWCR::mKO and GCaMP expressing neurons. ... 40
viii
Figure 3.3: X,Y position is stabilized to within 1 um and angle bending artifacts are
reduced 2-fold. ... 44
Figure 3.4: GCaMP from multiple neurons can be simultaneously imaged with less than 18% error in a freely moving worm over many minutes. ... 47
Figure 3.5: Targeted illumination combined with tracking enables single-neurons to perturbed in a freely moving animal. ... 49
Figure 3.6: Illustration of a dove prism. ... 53
Figure 3.7: Real-time image processing and x,y,z,θ tracking on FPGA. ... 57
Figure 3.8: Regions of interest and segmentation corresponding to different neurons in x,y are obtained from the maximum intensity projection. ... 59
Figure 3.9: Neurons at different z positions in z-stack can be resolved by the maximum intensity. ... 60
Figure 4.1: Illustration of Frequency Division Multiplexing camera. ... 64
Figure 4.2: Generation of frequency encoded pixel array. ... 66
Figure 4.3: Experimental setup of FDM microscope... 68
Figure 4.4: FDM microscope imaging 10um diameter spots. ... 69
Figure 4.5: Schematic CAD of disk pattern. ... 73
Figure 4.6: High-magnification image of disk pattern... 73
Figure 4.7: Procedure for minimizing wobble and azimuthal angle. ... 74
Figure 5.1: Targeted inhibition of RMG alone is sufficient to elicit speed phenotype. ... 78
Figure 5.2: BAG calcium activity in freely moving worms. ... 79
ix
x
Acknowledgements
The project would not have been possible without the continued support from my
many friends, family, and colleagues. Graduate school has been an absolute privilege and
I have enjoyed every day of it. Much of this is because my advisor, Professor Sharad
Ramanathan, has been not only my mentor, but also a dearest friend. Together, we have
solved numerous challenges and uncovered even more that still need to be addressed.
“These are not easy problems to solve now … let’s put them on the backburner”—SR.
Nearly every aspect of the project was a story in and of itself—from the scope and
broader impact, down to the screws that held our microscope stage together. His
confidence in me has helped me find courage and confidence in myself. I cannot thank
him enough for this. It also comes as no surprise that he put together a group of some of
the most talented and supportive colleagues I have ever known.
Every one of the lab members, current and past, has been a pleasure to work with.
They have all contributed to my experience in unique ways. I have held deep and
stimulating conversations with every one of them. More importantly, I’ve also had some
of the best laughs in my life with them. They are my friends and wish them the very best.
I must also give a special thanks to my friends outside of lab, in Boston and overseas.
They have not only broadened my scope of the world, but also opened my heart.
Lastly, I thank my family. My parents, Ho-Shang and Mei-Li, and my sister, Julia,
have always been there for me. My father has always been a spiritual as well as academic
advisor to me. The strength I see in him and his ability to lead by example is probably
what my late grandmother inspired in. It is cliché to say, but there is nothing like a
xi
challenging times and she has taught me something that is often difficult to do in our
world, to listen. And last but not least, my sister is one of the toughest people I know. She
has shown resilience and perseverance in the most challenging settings while
xii
To
1
Chapter 1.
Introduction
1.1.
Approach to understanding neurons and circuits
One of the primary goals in neuroscience is to understand how neurons and their
circuits control behaviors. Answering this involves, among many others, understanding
circuit architecture and the kinds of computations they are capable of. Trying to
understand the whole brain at once, however, is a daunting task. It is technically
challenging to simultaneously measure and understand the dynamics of all neurons in
small nervous systems such as that of the nematode Caenorhabditis elegans, and
seemingly impossible for higher organisms such as humans which have roughly 100
billion neurons. Although efforts have been made towards such a “whole-brain”
approach1–4, the neuroscience field has traditionally taken a divide-and-conquer approach
and focused on only a small subset of the nervous system at a time5. The hope is that the
complex problem of understanding the nervous system can be broken into simpler ones
and that the circuits and computations underlying at least some behaviors can be better
understood by studying a subset of neurons which are essential to function6,7.
While it is possible that all neurons are functionally tightly connected and breaking
any one piece would destroy the nervous system’s functions, we are continually finding
examples where this is not the case. A spectacular example is that of the American
railroad foreman, Phineas Gage, who in 1848 survived having a large iron rod driven
through his head, destroying much of his left frontal lobe. Amazingly, Phineas was able
to retain much of his brain function and even operated as a stagecoach driver for several
2
any given behavior. Instead, the picture seems to be that behaviors are encoded by
subsets of the nervous system. For example, a recent functional screen of chemosensory
neurons in C. elegans found that neurons represent their environment using hierarchical
sparse codes and that few neurons participate in encoding multiple cues9. Activity in
sparse sets of neurons has also been a hallmark feature of cortical and hippocampal
function10–12. The question then is what are the essential neurons and circuits and how
does one go about identifying and studying them?
The success of studying essential neurons has been concomitant with the
development of tools and techniques to both perturb and measure neuronal activity.
Perturbing individual cells which are micron in size and quantifying their dynamics is
difficult. In addition to requiring spatial resolution, measuring individual neurons entails
probing dynamics whose relevant timescales could range from milliseconds to hours
depending on the behavior and organism. We have come a long way since the early
voltage clamp measurements on axons in squids13,14. Perturbation and measurement
techniques that used to involve invasive surgery can now be done using optogenetics and
imaging. These tools have enabled us to study small circuits of the brain in detail and
revealed numerous key circuits such as those controlling turning and bout behaviors in
zebrafish15,16 and that feed-forward circuits control odor discrimination in rodents17–19.
They have been particularly successful C. elegans which has several characteristics that
3
1.2.
C. elegans
as a model organism for studying small nervous systems
The nematode C. elegans is a model organism for studying how neurons control
various behaviors and for developing the tools to do so. The roughly 1mm long worm
was the first to have its genome sequenced and the developmental fate of every single
one of its roughly 1000 somatic cells mapped20,21. The connectome of its small nervous
system of 302 neurons was fully mapped more than thirty years ago and is highly
conserved across individuals22–25. Although there are likely some complications, this
constancy and repeatability justifies the divide-and-conquer approach; it is possible to
build the functional map of the worm piece by piece and important neurons found in one
worm should be the same in any other. The nematode’s transparency also makes it ideal
for imaging and manipulating with optics. Despite its relatively small nervous system, C.
elegans exhibits complex behaviors such as chemotaxis, mating, learning, and social
behaviors26–28. While the neuronal activity patterns are different from that of higher
organisms, notably because worms do not exhibit action potentials, there are similarities
in architecture29,30. For instance, theoretical studies have identified feed-forward motifs
and clustering patterns in C. elegans which are also found in the mammalian cortex31,32.
Studying the nervous system of the nematode, therefore, may help us better understand
small nervous systems as well as the human brain.
Evidence has shown that several C. elegans behaviors can be controlled by
sub-circuits of the nervous system. Single-neuron ablation experiments have shown that a
sparse set of key neurons may be essential for a given behavior, but not others.
Conversely, some neurons are involved in multiple behaviors. For instance, behaviors
4
specialized motor neurons29,33,34. These circuits have usually been uncovered by
combining the results from functional perturbation of individual neurons with the
anatomical wiring diagram. The role of various sensory neurons in encoding mechanical,
thermal, and chemicals has been functionally verified35–38 and even circuits controlling
navigation and chemotaxis from the sensory, to the interneurons that integrate the signals,
and down to the command interneurons and motor neurons have been proposed39–41.
Kocabas et al. found that by synchronizing the activity of a single interneuron to head
bending using optogenetics, they could make worms evoke chemotactic-like behavior.
Motivated by its success, there has been a continued effort to find essential neurons and
modules controlling other behaviors.
Discovering essential neurons and measuring from them has traditionally been
difficult. Before measuring and perturbing neurons, one has to first know which neurons
to look at and it is difficult to rely on solely on the anatomy. Although there are only 302
neurons in the worm, they are highly interconnected with each directly connected to
roughly 15% of the brain through synapses or gap junctions and no two neurons are more
than three connections apart42. There are a large number of possible circuits and pathways
one can draw between any two neurons. And even though neurons can be divided into the
three functional classes based on morphology: sensory, inter, motor22,43,44, we are
continually finding neurons that have multiple modalities45,46. Furthermore, even if a
neuron is not directly responsible for transducing or modulating a signal, it could still
play an important role as a signal channel and integration hub. Therefore, the connectome
and anatomy does not reveal what the essential neurons are and we have had to rely on
5
time, in the large space of possible neurons is challenging in small nervous systems such
as that of the nematode and nearly impossible in higher organisms. Improving efficiency
and throughput would allow us to explore more of the nervous system. Furthermore, even
if we manage to identify the essential neurons, measuring their dynamics is also a
challenge.
To understand how essential neurons control behavior, it is necessary to measure
their dynamics in a freely behaving animal. This is a general challenge in neuroscience
and particularly important in organisms such as C. elegans whose behaviors are
characterized by locomotion. The tradition approach of probing with electrodes is being
replaced by imaging fluorescent voltage indicators. For C. elegans, one needs the spatial
resolution to measure from micron scale neurons in an organism that is moving hundreds
of times that scale per second. Furthermore, the timescale of the dynamics that needs to
be measured depends on the neurons and behaviors in question and could range from
seconds to many minutes. For instance, second-scale resolution is needed to correlate
activity with reversal events47–49, whereas tens of minutes are needed to see the slower
transition between local-global search50,51. These are outstanding challenges but the work
described in this dissertation addresses several of them and allowed me to correlate
activity to behavior in a freely moving worm on timescales that previously were not
possible.
1.3.
Overview of framework
We developed a framework to both identify essential neurons and measure their
6
challenging so many studies have focused on the same previously studied neurons and
behaviors. How then does one generally find essential neurons without knowing where to
start? Our approach was to utilize principles of compressed sensing52,53 to functionally
screen more neurons and in fewer measurements than previously done using traditional
single-neuron perturbation methods. To verify and measure dynamics in these neurons,
we developed a real-time tracking and image stabilization microscope that enabled us to
selectively activate or inhibit individual neurons and measure calcium dynamics in freely
behaving animals over tens of minutes. This included developing a fluorescence imaging
system that can read out pixels faster than traditional CCD sensory by using frequency
division multiplexing.
We applied our framework to find essential neurons controlling speed during
chemotaxis in C. elegans. Chemotaxis and navigation is widely studied and speed should
play an important role because it is relates to how the worm, a point detector, translates
space into time. Bees, for instance, trade-off speed for foraging accuracy54–57. Worms
crawling on an agar pad towards food show speed fluctuations that range from the order
7
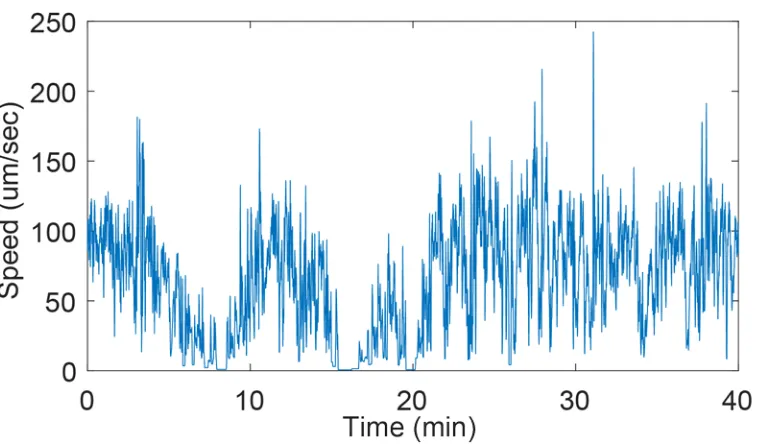
Figure 1.1: C. elegans modulates its speed on timescales of seconds to many minutes.
Speed of a nematode crawling freely on an agarose pad. Speed is modulated on the order of a head-swing (seconds) as well as over tens of minutes. Animal occasional slows to a standstill for several minutes as seen at minutes 8 and 15.
We asked what neurons are essential for controlling speed and where these dynamics are
coming from. Speed is challenging to study because measurements and perturbations
must be done in a moving animal. Using this framework, we functionally screened more
than 80% of the nematode’s nervous system and found three candidate neurons
controlling speed. Using our microscope, I then verified them by measuring neuronal
activity and selectively inhibiting them. Although the developed framework is optimized
for the study of C. elegans, its principles and techniques may be useful for studying other
8
Chapter 2.
Uncovering neurons essential for behavior
Abstract
I developed a behavioral screen that utilizes compressive sensing to find neurons
essential for behavior in fewer measurements than would be necessary using traditional
methods. I demonstrated it on a simulated small nervous system and then applied it to C.
elegans to uncover neurons controlling forward speed.
2.1.
Introduction
Studying import subsets of neurons and the patterns of activity in the circuits they
form has helped us better understand how information flows and computations are done
within the nervous system to control specific behaviors58. The existence of subsets of
neurons controlling a specific behavior suggest that neural networks that perform
computations for a specific behavior pass through essential neurons, thus making them
central players for that behavior. The ability to identify the specific subsets of neurons
experimentally helps us understand the architecture and function. One approach in
neuroscience to understand the nervous system is to find key subsets of neurons
controlling each behavior through experiments that target specific neural subtypes either
through genetics or more recently through optogenetics. The hope is that such
understanding can eventually be synthesized to give uncover how the nervous system
works at a systems level. Finding the key subsets of neurons that control specific
9
sizes ranging from a few hundred neurons in nematodes to several hundred billion in
humans.
Although C. elegans has only 302 neurons, they are highly interconnected with
each neuron being directly connected via chemical synapses or gap junctions to roughly
15% of the brain as shown by electron microscopy22 and illustrated in Figure 2.1. The
complicated wiring anatomy alone neither reveals how computations are performed in
brain nor the identities of neurons controlling specific behavior. Neurons can generally be
classified as sensory neurons that have sensory dendrites, motor neurons with
neuromuscular junctions, or interneurons that connect the two. This classification gives a
rough picture of the flow of information but there are several complications. Naively we
might think that neurons which integrate signals from upstream neurons are important
hubs and are therefore likely essential neurons. However, because of the high degree of
connectivity it is difficult to identify the essential neurons based on just the physical
wiring diagram alone. Therefore, one has had to rely on time consuming and challenging
functional experiments such as single-neuron laser ablations to find essential neurons.
Although single-neuron laser ablations are possible in several organisms, they
have been particularly successful in C. elegans and have revealed neurons and circuits
underlying several behaviors such as touch avoidance and egg-laying34,59. Ablating any
neuron is unlikely to result in a phenotype which implies that not all neurons are
important; but ablating a specific neuron can be sufficient39,59,60. This suggests that
information controlling each behavior flows through essential neurons and that these
neurons may be sparse in number. Single-neuron functional imaging, which has its own
10
using hierarchical sparse codes and that few neurons participate in encoding multiple
cues9. Knowing which neurons are essential can help us focus on important subsets of the
nervous system, but finding them is challenging even in one of the most widely studied
and characterized model organisms.
The challenges of single-neuron perturbation techniques have made it difficult to
sample much of the C. elegans nervous system. Identifying essential neurons has
traditionally been tedious—perturbing a single neuron at a time, commonly using laser
ablation, and measuring the phenotype for a statistically relevant number of animals is
difficult. Furthermore, ablations are typically done at the early larval stage after which
the C. elegans nervous system continues to develop and synapses can regenerate,
possibly resulting in it deviating from the stereotypical wiring and function61–64. Recently,
microfluidics and reversible immobilization techniques have been developed to
parallelize laser ablation experiments and increase throughput65,66. Alternatively, neurons
can be optogenetically inhibited or activated by driving Archaerhodopsin-3 (Arch) or
Channelrhodopsin-2 (ChR2) expression under specific promoters, respectively67,68.
Several neurons express unique genes which can be used to optogenetically perturb single
cells. In cases where a specific neuron does not express a gene uniquely, of which there
are many43, it is possible to do intersection optogenetics in which overlapping sets of
promoters are combined with the use of a recombinase such as Cre68,69. While these
single-neuron perturbation experiments may be simple to interpret, in addition to being
experimentally challenging they are the least efficient method of finding sparse sets of
11
The recent elucidation of compressive sensing from the field of information
theory has shown that not only can a sparse signal be compressed, but its information can
be acquired in fewer measurements. Given a vector 𝑥𝑥⃗ with N unknowns, finding the N
coefficients would take on order N measurements if sampled one-by-one. If the solution
is sparse, i.e. most of the N unknowns are zero, however, and groups of them are sampled
at a time, the solution can be obtained in order log(N) measurements using compressive
sensing. The critical insight, first published by E.J. Candes and T. Tao, for obtaining the
sparse solution from an underdetermined linear system of equation is to minimize the
L1-norm, �|𝑥𝑥⃗|�152,70–72. The commonly used Euclidean distance, or straight-line distance, is
the L2-norm, �|𝑥𝑥⃗|�2. Compressive sensing has become increasingly popular in numerous fields such as machine learning, communications, image processing, and genetics73–75.
Motivated by this and the hypothesis that the set of key neurons is sparse, we constructed
a behavioral assay that covered much more of the C. elegans nervous system than
previously attempted using single-neuron ablation and optogenetics. An optogenetic
neural activation screen for over 1000 GAL4 lines has previously been done to construct
a brain-wide neural-behavioral map in drosophila76. Instead of sampling neurons
one-by-one, we sampled groups of them at a time and minimized the L1-norm to find the sparse
solution. I first demonstrated this method using a simulation and then applied it to the
library of known unc “uncoordinated” genes. I then implemented it experimentally to
find neurons controlling forward speed. We used the extensive library of known promoter
expression from the literature to drive Arch expression in a handful of neurons at a time.
12
forward speed, it serves as a general framework for understanding other behaviors and in
other small nervous systems as well.
2.2.
Results
2.2.1.
Simulation of multiple-neuron inactivation behavioral screen
To test my approach of screening for sparse neurons controlling behaviors, I
simulated a small behavioral circuit of roughly 100 neurons with only a handful of
essential neurons and asked how well I could recover the identities of the neurons and
their strengths by randomly inactivating several neurons at a time and minimizing the
L1-norm. Five of these neurons were given non-zero strengths contributing to behavior
phenotype when inactivated, while all other neurons were zero (Figure 2.1). As an
example, I based the connectivity off the anatomical wiring of C. elegans. The simulated
network shown in Figure 2.1 thus resembles the nematode’s nervous system with the
simplification that all left and right as well as dorsal ventral pairs with the same neuron
prefix were grouped as one neuron. For example, SMDDL, SMDDR, SMDVL, SMDVR,
were combined into neuron SMD. I then generated data by perturbing random groups of
neurons at a time (Figure 2.2), and solved for the sparse solution by minimizing the
13
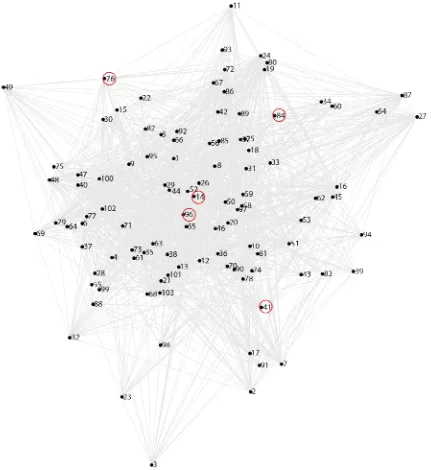
Figure 2.1: Simulated network with sparse key neurons resembling C. elegans nervous system. Each numbered point denotes one of the 118 neurons in the simulated network. A simulated sparse circuit of 5 key neuron (14, 41, 76, 84, 96) controlling the behavior in question is circled in red. Each key neuron was given a non-zero strength whereas all others are zero. In this example, I modeled the connectivity from the C.
elegans connectome. Chemical and gaps junctions are shown by grey lines. Adapted from
http://www.wormatlas.org/neuronalwiring.html
[image:26.612.92.523.71.541.2]14
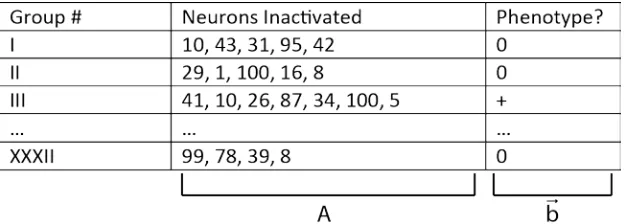
Figure 2.2: Simulation of inactivating random groups of neurons and measuring phenotype. As an example, 32 different groups of on average 5 randomly chosen neurons are inactivated. The column “Neurons Inactivated” represents the measurement matrix, A, and column “Phenotype” represents the data vector, 𝒃𝒃��⃗, in the linear system
[image:27.612.151.464.71.183.2] [image:27.612.108.503.331.471.2]𝑨𝑨𝒙𝒙��⃗= 𝒃𝒃��⃗.
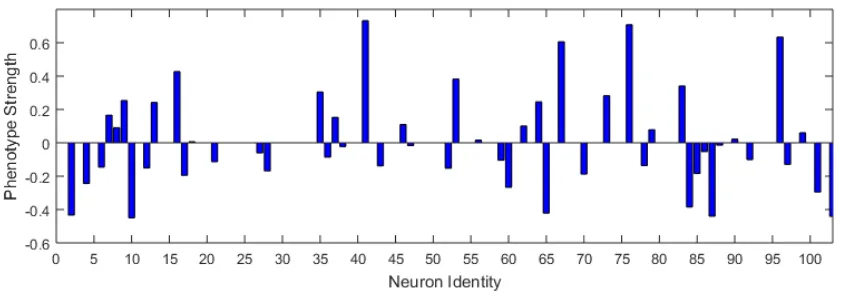
Figure 2.3: Sparse signal is perfectly recovered using L1-norm minimization.
15
Figure 2.4: Sparse signal is not recovered using L2-norm minimization. The L2-norm,
�|𝒙𝒙��⃗|�𝟐𝟐, was minimized subject to 𝑨𝑨𝒙𝒙��⃗ =𝒃𝒃��⃗. Not only were the 5 key neurons not recovered with the correct strengths, but half of the neurons had non-zero strengths.
The method was consistently able to recover the sparse solution but the number of
different groups, or measurements, needed to do so depended on the number of neurons
sampled in each group. For comparison, the commonly used L2-norm minimization was
poor at recovering the sparse signal (Figure 2.4). Typically, around 30 measurements of 5
randomly chosen neurons at a time were sufficient to produce the correct sparse
solution—far less than the total number of neurons. On average, finding sparse neurons
by sampling one at a time, as is typically done with single-neuron laser ablation, is the
least efficient and requires sampling all of them; whereas sampling 5 or 10 random
neurons at a time requires 30% to 50% fewer measurements, respectively (Figure 2.5).
Sampling more neurons at a time initially results in more false positives, but convergence
16
Figure 2.5: Rate of convergence to correct solution depends on the number of neurons inhibited per measurement. Different colored curves show the number non-zero entries found for different sampling sizes as a function of number of measurements. Each curve shows the mean over n=5 simulations. Sampling more neurons per measurement initially produces more false positives, but converges faster because it samples the space in fewer measurements. Sampling one by one, shown by the blue curve, has no false positives but is the least efficient and requires the most measurements.
2.2.2.
L1 norm analysis of unc genes reveals motor neurons affect
uncoordinated locomotion phenotype
I used this L1-norm framework on existing data from the literature to see which
neurons are involved in uncoordinated movement. Many genes in C. elegans, when
mutated, impact the nematode’s coordination and movement are named unc genes, or
“uncoordinated” genes. The uncoordinated phenotype has typically been observed
17
locomotion may affect speed so essential neurons found for the first may overlap with the
latter. Unsurprisingly, I found that motor neurons and command interneurons are
important. It is also expected that inhibiting muscle will affect coordination. Each unc
gene is expressed in 9 neurons on average. I hypothesized that only a sparse subset of the
neurons expressing an unc gene is responsible for the phenotype. The sparse solution was
found by minimizing the L1-norm was composed of 14 of 66 interneurons, of which 4 are
command interneuron, 8 of 21 motor, 7 of 31 sensory, and muscle (Figure 2.6).
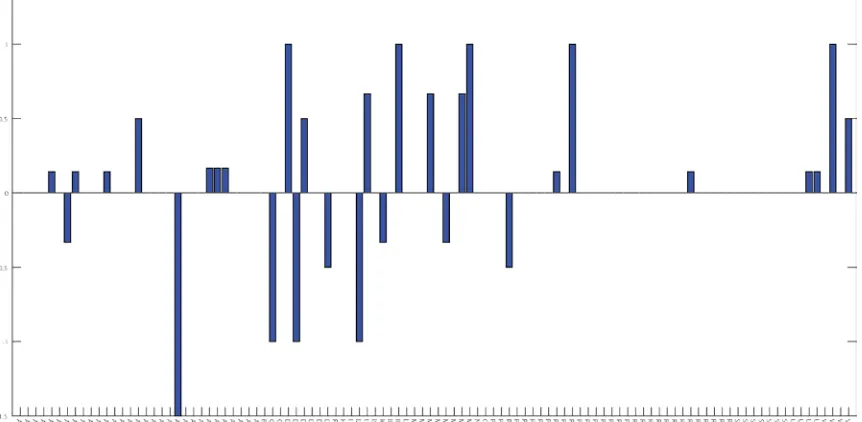
Figure 2.6: Sparse solution coefficients and network controlling “uncoordinated” movement. The sparse solution for neurons controlling “uncoordinated” movement showed a higher representation of motor and command interneurons over inter- and sensory neurons.
2.2.3.
Constructing transgenic lines from known promoters driving
Archaerhodopsin-3 expression in groups of neurons
After demonstrating the benefits of a simultaneous multi-neuron perturbation
[image:30.612.92.523.282.493.2]18
specific neurons using known promoters from the literature. The compounded difficulty
of ablating multiple neurons in the same animal, and being able to repeat this for multiple
animals, meant that I needed to find an alternative means to perturb neurons. Optogenetic
activation or inhibition has the advantage of being reversible and preserving the innate
wiring. I chose to use the photoactivatable proton pump Archaerhodopsin-3, or Arch,
which when exposed to green light inactivates the neuron it is expressed in, because the
blue light used to activate commonly used ChR2 is harmful to C. elegans in large
dosages79. Free online resources such as Wormweb.org have conveniently organized the
vast literature on the expression pattern of hundreds of promoters collected by numerous
groups over the past few decades. Thanks to the tremendous effort of several colleagues
who synthesized and injected the promoter::Arch-tagRFP fusion PCR constructs into
hundreds of animals, I screen 41 transgenic lines for a speed phenotype (Table 2.1). The
background we used was a lite-1 mutant which lacks a ultra-violet light receptor and does
not avoid light79.
The 41 transgenic lines used in the behavioral screen covered 82% of the
nematode’s neurons. Due to complications primarily from expression being mosaic, I
avoided promoters that were expressed in more than a dozen neurons. Although most of
our lines showed the same expression pattern as those from the literature, a handful of
them were significantly different, possibly due to slight differences in the promoter
construct. We determined the expression pattern for those lines obviously deviating from
the literature using high resolution DIC and fluorescence microscopy. As with the
simulation, I grouped left, right, ventral, and dorsal pairs as the same neuron. On average,
19
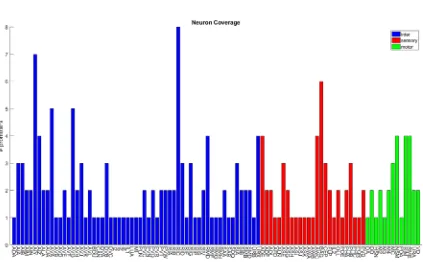
of all sensory neurons, 62% of all motor neurons, and 89% of all interneurons (Figure
[image:32.612.96.519.148.410.2]2.7).
Figure 2.7: 41 transgenic lines in Archaerhodopsin-3 speed behavioral screen cover 82% of the C. elegans nervous system. All neurons covered by the screen as well as the number of lines expressing them are shown. The screen covers 89% of all interneurons (blue), 81% of all sensory neurons (red), and 62% of all motor neurons.
2.2.4.
High-throughput behavioral screen
I screen the 41 transgenic arch lines for a speed phenotype using a custom built
high-throughput assay. Multiple replicates were done for each line over multiple days.
Briefly, a low magnification and large field of view cMOS camera (3-5 frames per
second) was used to image between five and fifty animals chemotaxing on a standard 10
cm agar dish. Using fewer animals per experiment enabled to track individuals for longer
20
illumination. Because I wanted to measure behavior, specifically speed dynamics in the
context of chemotaxis, a small 10uL droplet of stationary growth phase OP50 bacteria
was placed at the center of the dish. At the start of the experiment, groups of animals
were placed in small droplets of water 1.5 cm from the bacteria and allowed to freely
chemotax towards the food once the droplets dried and released them, typically within a
few minutes. On average, >70% of all wild-type animals were able to reach the lawn of
bacteria within an hour (data not shown). A powerful 525nm LED light source (~
5mW/mm2) was used to activate arch and inactivate neurons. Appropriate color filters
[image:33.612.94.519.348.608.2]were used to minimize exposure to UV-blue light and radiative heating.
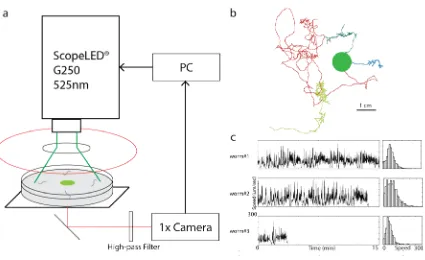
Figure 2.8: Archaerhodopsin-3 activated behavioral screen assay.
21
(Continued) processed using custom software from which position and speed, (b) and (c), respectively, were measured. (b) Example of individual C. elegans trajectories, shown as different colors, during chemotaxis towards the bacterial lawn (green dot). On average, 70% of all wild-type animals reached the lawn within an hour. (c) Left column: time series of instantaneous speed for individual animals. Right column: histograms of the instantaneous speed.
Behaviors were analyzed from the video recordings using custom software written
in MATLAB. Several elements, notably the image segmentation algorithms, were
adopted from “The Parallel Worm Tracker” (Miriam Goodman Lab)80. The centroid
position of each animal was tracked throughout the movie and speed was calculated by
taking the time derivative. Although not a focus of my study, other behaviors and metrics
such as reversals, gradual turning, and acceleration could be easily extracted from the
position data (Figure 2.8b). To compare different animals and transgenic lines, I binned
the time series speed data into histograms and quantified the difference between them
using the Kullbach-Leibler divergence (Figure 2.8c, 2.9). This metric was chosen because
I wanted to screen generally for neurons that controlled speed and this could be
manifested in higher moments such as variance and skew. For instance, it has been found
that dopamine signaling in C. elegans controls the coefficient of variation rather than the
mean speed81. The average speed distribution for each line, obtained by pooling the
histograms for each replicate equally, was compared to that of the wild-type,
DKL(<speedline i>||<speedwild-type>). A significance threshold was set by measuring
inter-animal variability amongst wild-type inter-animals, DKL(speedwild-type i||<speedwild-type>), and
taking the 95th percentile (Figure 2.9b).
To ensure that the light exposure was not inducing any speed phenotypes
22
minutes on wild-type animals and compared their speed distributions. Although we used
an ultraviolet light receptor mutant, lite-1, which does not avoid visible light, there could
be other effects such as photo-damage which could manifest as a phenotype. There was
no significant difference in the speed distributions in these control animals when the light
was on versus off. The average K-L Divergence ON/OFF (.053 std:.040 n=14, data not
shown) was less than the average inter-animal speed variability (Figure 2.9b).
Of the 41 transgenic arch lines in the screen, only 5 (flp-21, npr-4, odr-2b, sra-11,
dop-2) showed statistically significant speed distributions from wild-type as scored by the
KL divergence (Figure 2.9). Their mean forward speed were also significantly slower
than wild-type. A pan-neuronal arch line, F25B33, was used as a positive control and
showed a phenotype. That few lines showed a phenotype is consistent with the hypothesis
that the set of essential neurons is sparse. All five lines showing phenotypes expressed in
multiple neurons while none of the unique promoters showed a phenotype. Although
there has previously never been such an extensive neuronal screen for forward speed
phenotypes, there were a few lines that surprisingly did not show a phenotype. My
analysis of unc mutants showed that motor and command interneurons are important in
controlling locomotion which likely affects speed (Figure 2.6). The unc-25 mutant, as its
name implies, has a locomotory behavior in which the animal simultaneously contracts
both ventral and dorsal body muscles, resulting in a “shrinking” motion which I expected
would have affected forward speed but did not82. Previous studies noted that the
expression of the transgene is mosaic and phenotypic strength variable which could have
made it difficult for my assay to resolve. Similarly, flp-11 is also expressed in several
23
been implicated in controlling speed while crawling on bacteria yet inhibition of
serotonin receptor and dopamine synthesizing hydroxylase expressing neurons, mod-1
and cat-2, respectively did not show a phenotype during chemotaxis towards bacteria81,83.
Inhibiting dopamine receptor expressing neurons, dop-2 did, however, produce a
phenotype. The context of most experiments from the literature was taken on the bacterial
lawn or at least near the edge of it and is possibly different from that of our chemotaxis
assay.
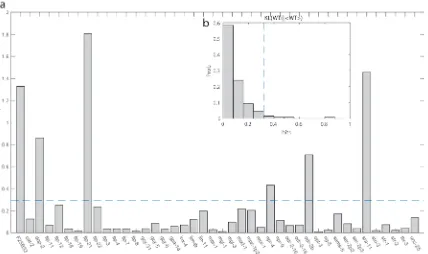
Figure 2.9: Speed phenotype for 41 transgenic lines as measured by Kullbach-Leibler divergence. (a) 5 of the 41 transgenic lines showed a significant speed phenotype as measured by the Kullbach-Leibler divergence between the average speed histogram of the line and wild-type. The blue dashed line, computed in (b), represents the significance threshold and is taken to be the 95th percentile for KL divergence between individual wild-type animals, WTi, and the average wild-type distribution, <WT>.
After scoring the phenotypes, I used the same L1-norm minimization formalism
[image:36.612.96.524.295.549.2]24
behavior phenotype and neuron expression were both binarized as 1 for phenotype and
likely expressed, and 0 for no phenotype and unlikely expressed, respectively. The sparse
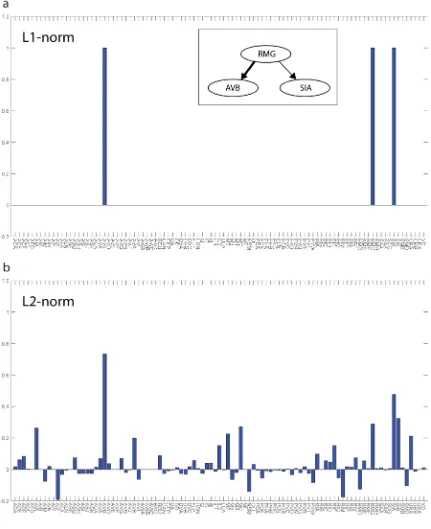
solution was neurons AVB, RMG, and SIA out of the 97 covered neurons (Figure 2.10a).
I chose to binarize the phenotype because with such a large variability in the wild-type
control it was unlikely that I had the resolution to treat the phenotype as continuous.
Furthermore, because the assumption is that the phenotype producing neurons are sparse,
it was unlikely that I would have sampled multiple of them at a time. Therefore the
strength of the sparse non-zero coefficients simply scales as the strength of the phenotype.
The sparse solution neurons were consistent with literature. AVB has long been known to
be a command interneuron driving forward locomotion47,59,84, RMG activation has
recently been shown to increase forward speed85, and SIA has neuromuscular junctions86.
In contrast, all coefficients in the the L2-norm solution had non-zero strengths and the top
5 percentile, although containing the three neurons from the L1-norm sparse solution,
also included the pharyngeal pumping neuron MC which is not expected to control speed
25
26
2.3.
Discussion
I developed a framework to identify key neurons controlling behavior. Motivated
by the hypothesis that the set of essential neurons is sparse, I sampled the phenotype from
perturbing multiple neurons at a time and minimized the L1-norm to find the sparse
solution. This order of log(N) versus order of N measurements needed to accurately find
the sparse solution is a poignant application of compressive sensing. Although
single-neuron ablation experiments have been used for decades and uncovered important
circuits underlying several behaviors, their difficulty has limited their search to a
relatively small portion of the nervous system. Sampling multiple neurons at a time and
using the L1-norm minimization is a more efficient way to find essential neurons. The
solution can then be verified using targeted inhibition, such as laser ablation, and
functional imaging.
The important neurons that I found capable of controlling speed, RMG, AVB, and
SIA, are all consistent with the literature but there were some surprising results which
may be due to both technical limitations and my approach. I made the important
assumption that any neuron expressing arch at detectable levels was strongly inhibited
during the behavioral assay and also that the inhibition was binary—either on or off. The
degree to which optogenetically activated rhodopsins can depolarize or hyperpolarize a
cell depends on many factors such as their expression levels, the type of neuron, and
developmental stage88,89. Prior to behavioral experiments, the animals were screen for
brightness as well as characteristic expression pattern. I also chose to use higher light
intensity than what is typical to accentuate the perturbation and behavior phenotype.
27
activating arch. Nevertheless, the light levels needed to inhibit may not have been
sufficient for all neurons.
Even with the assumption that the essential neurons are sparse, according to my
simulations, my 41 promoters should have been enough to get close to the correct
solution, but there may be false positives or negatives. For instance, the interneuron IL2
is only expressed in one line, odr-2b. This line also expresses SIA which is in another
phenotype line, npr-4. The L1-norm minimization chooses only SIA instead of SIA and
IL2. The possibility of false negatives would decrease by sampling each neuron more
frequently (Figure 2.6, 2.7). Sampling neurons more frequently would also increase the
number of pairwise and greater groups which would be helpful in understanding epistasis
The efficiency of this framework over traditional single-neuron ablations could
make it possible to measure epistasis and non-linear interactions. Studies in C. elegans
and zebrafish have shown instances where removing individual neuropeptides had no
effect and that they acted collectively where triple mutants did show a phenotype90,91.
There may be behaviors that are controlled by essential groups rather than individual
neurons. In those cases, all pathways must be shut off to elicit a phenotype. To find
neurons with such interactions, it would be necessary to measure all possible pairs,
triplets, etc., which is, by construction, not possible with single-neuron perturbation
experiments. Furthermore, the search space becomes combinatorially large. For pairwise
interactions, each pair can be thought of as an unknown and of which there are 𝐶𝐶2𝑁𝑁, and
goes as N2 for large N. Although multi-neuron ablation experiments are possible, it
28
compressive sensing, however, the search would take of order log(N2) = 2 log(N)
measurements which is much smaller and may be experimentally feasible.
Lastly, optogenetic activation and laser ablation experiments uncover important
neurons and circuits capable of controlling behavior, but do not reveal their underlying
dynamics. Laser ablation is tonic in nature and while optogenetic activation can be turned
on and off, or even varied continuously, it is more efficient to use the behavioral screen to
first narrow down candidate neurons and then study their dynamics afterwards.
Furthermore, although perturbing these neurons may be sufficient to produce a phenotype,
we do not know if the strengths are physiological and we do not know the dynamic range
of signals during normal behavior. For instance, although flp-21::arch expressing animals
are almost paralyzed under green light, they respond to mechanical touch with reversals
and forward speeds qualitatively identical to wild-type suggesting that the optogenetic
inhibition was not sufficiently strong to inhibit the neuron under all contexts or that the
nematode uses multiple pathways to control speed (data not shown). Perhaps the circuit
controlling this avoidance behavior works in parallel to bypass the neurons normally used
to control speed during chemotaxis. How the nematode chooses and weighs different
pathways could be complicated and context dependent. It is therefore necessary to
measure and verify the dynamics in these neurons, using GCaMP functional imaging for
instance, while the animal is freely behaving. Functional imaging experiments, however,
are technically challenging and low in throughput and therefore should be preceded by
29
2.4.
Materials and Methods
2.4.1.
Strains
Strains were grown and maintained under standard conditions unless indicated
otherwise. All experiments were done in lite-1 mutants to minimize the animal’s
sensitivity to blue light. All promoters were fused to Archaerhodopsin-3 by fusion-PCR
and injected into C. elegans using standard protocols. Animals were fed all-trans retinal
(1mM), a cofactor required for rhodopsin activity, for 12+ hours prior to the behavioral
assay. All non-transgenic animals as well as transgenic animals not fed all-trans retinal
were pooled as wild-type. Day to day variation of the same line showed comparable
variability to non-all-trans retinal fed animals of different transgenic lines. Only young
adults were used in the behavioral assay.
2.4.2.
Promoter expression and neuron identification
The neuronal expression pattern of the promoter::arch constructs was verified
using high magnification (100X) fluorescence and DIC microscopy. Only lines showing a
phenotype or those with expression patterns that were obviously different from that of the
literature under a lower magnification fluorescence microscope were examined. In most
instances, a combination of fluorescence-DIC co-localization and neuron process
morphology was sufficient to determine the expression pattern. We imaged a minimum
of 10 animals for each line and claimed the animal expressed those neurons reliability if
they were in at least 75% of them. Although we observed some mosaicism in the
expression pattern for several lines, all neurons were expressed in either >75% of the
30
2.4.3.
Behavioral Assay and Image Processing
The green light (5mW/mm2) used to activate arch covered >70% of the plate area
with less than 15% variation in intensity as verified with a Thorlabs S120C photodiode.
A video camera was used to record the movements of the worms at 3-5 fps92. Only data
from ~70% of the plate area centered on the bacterial lawn was processed and analyzed.
Custom MATLAB software with elements from “The Parallel Worm Tracker” (Miriam
Goodman Lab)80 were used to segment and track the position of individual nematodes
across camera frames. To estimate sub-pixel and hence sub-resolution scale
displacements, I binned the real space into discrete pixels based on pixel size, i.e. a
non-zero displacement was only observed if the animal move more than √2 × pixel width, the distance between diagonally adjacent pixels. Such analysis is likely more accurate
than arbitrary time averaging which is typically used and does not take spatial resolution
into account. Under the roughly 1x magnification, each animal was typically around
50-100 pixels in size. In most instances, I was able to track individuals for at least 10
minutes before they either entering the bacterial lawn or colliding with another animal.
This time depended on the number of animals used in each trial with ranged from 5 to a
few dozen. Speed was calculated by taking the time derivative of centroid position.
Forward speed was taken as all speeds at least +/- 3 seconds from a reversal event as
31
Acknowledgements
I thank Josselin Milloz and Ching-Han Shen for the designing much of the behavioral
screen assay and gathering much of the data. Together with Abdullah Yonar, they made
all of the transgenic lines. Jagan Srinivasan and Christopher Chute provided vital
assistance to Tim Hallacy in verifying the promoter expression using high magnification
DIC and fluorescence images. Sharad Ramanathan came up with the idea to apply the
L1-norm minimization to our data and find the sparse solution.
2.5.
Supplementary Information
Table 2.1: Promoter Expression Patterns
Promoter Neurons Expressing Promoter
cat2 CEP; ADE; PDE
dop2 CEP; SIA; SIB; RIA; RID; ADE
flp11 AUA; BAG; DA; DD; DVB; LUA; PHC; PVC; SAB; URX; VD
flp12 BAG; SAA; SMB; AVH; AVJ
flp18 AVA; AIY; RIG; RIM; M2; M3
flp19 AWA; URX; BAG
flp21 URX; URA; RMG; MC; M2; AIY
flp22 AIM; ASG; AVA; AVG; AVL; CEP; PVD; PVW; RIC; AIZ; RIV; SMD; URA
flp3 IL1; OLL; URB; PQR
flp4 NSM; ADL; I5; I6; AWC; FLP
flp7 ALA; AVG; PHB; PDA; PVW; RIC; SAA
flp8 URX
gcy31 BAG
gcy5 ASE
gcy8 AFD
gpa14 ASI; ASJ; ASH; ASK; ADE; PHA; PHB; ALA; AVA; CAN; DVA; PVQ; RIA
inx4 ADA; ADE; AIN; AUA; AVJ; DVC; FLP; PHA; PHB; PVR; PVT; RIC; RIG; RIM; RIP
lim6r RME; ASE; DVB; PVT
32
mbr1 AWC; AIM; RIC; AIN
mgl1 AIA; RMD; NSM
mgl3 NSM; ADF; ASE; AWC; RIB; RIC; BAG
mod1 RIM; RID; RIC; AIZ; AIY; AIB; AIA
mpz1prom2 M4; NSM; MC; RMH; RMF; RMD; HSN; SDQ; PVC; PVQ; PVN
nmr1 AVA; AVD; AVE; RIM; AVG
npr4 SIA; SIB; RIC; AVA; RMD; AIY; AVK; BAG
npr9 AIB
odr216 AVF
odr218 SMB; RME; ALN; PLN; RIG
odr2b IL2; SIA; AIB; ASG; RIF; RIV; AVG
opt3 AVE
rig5 RMD; SMD; I2; MC; M4
sams5 MI
ser2prom2 RME; AIZ; RID; AIY; BDU ser2prom3 OLL; PVD
sra11 AIY; AVB; AIA
sto3 RIB
str1 AWB
33
Chapter 3.
Measuring and perturbing neurons in
freely moving animals
Abstract
In order to verify the key neurons controlling speed found in the arch behavioral screen
(Chapter 2), I needed to measure calcium dynamics from individual neurons in freely
moving worms with high spatio-temporal resolution. Furthermore, this had to be done
over tens of minutes to see slow fluctuations in speed (Figure 2.8c). Existing systems
were not capable of doing this so I designed and built a novel real-time tracking and
image stabilization microscope that could. This simultaneously enabled me to selectively
excite or inhibit single neurons expressing photoactivatable rhodopsins.
3.1.
Introduction
Over the past two decades, neurons’ behavioral functions have been identified
using a combination of mutant knockouts, laser ablation, and more recently, optogenetics.
By driving the expression of Channelrhodopsin-2 (ChR2) and Archaerhodopsin-3 (Arch)
under specific promoters and stimulating with blue and green light, it is possible to
activate and inhibit, respectively, individual or sets of neurons. Unlike laser ablation, the
effects of optogenetics are reversible, non-invasive, and preserve the stereotyped circuit
wiring68. Although photoactivating and inhibiting neurons suggests behavioral function,
like laser ablation, it does not reveal any of the underlying dynamics. Importantly, it
34
animal during normal behavior. It is also unclear that tonic inhibition which is mostly
commonly used is the appropriate stimulation for studying the nervous system if
information is encoded in the dynamics. Furthermore, a combination of high expression
levels and intense optical stimulation could drive neurons to non-physiological levels.
Electrophysiology, often in the form of voltage clamps, enables the electrical potential to
be measured at high temporal resolution but requires dissecting and immobilizing the
animal. Imaging intracellular calcium levels with calcium-sensitive fluorescent proteins,
most prominently GCaMP, to readout neural activity has therefore become a popular
means for measuring dynamics67. It is widely used in nemoatodes, drosophila, zebrafish
and mice1,18,47. Measuring GCaMP activity in freely moving animals, however, has
traditionally been difficult.
One challenge of measuring GCaMP in a moving animal is that motion artifacts are
prominent at the higher magnifications needed to resolve weak fluorescent signals from
individual cells. The vast majority of neurons in C. elegans are densely clustered in the
head region around the nerve ring. High magnification objectives, i.e. ≥50x, with large
numerical apertures must be used to collect enough light and resolve cells. This
consequently limits the field of view to only several hundred microns. C. elegans can
easily move at speeds >250 um/sec on an agar pad and traverse the field of view in less
than one second, making even minute long experiments impossible without constraining
or tracking the worm. Furthermore, the motion in the field of view blurs the image and
reduces resolution. The main challenges, some general to fluorescent imaging, of
35
- High magnification, numerical aperture are needed to resolve neurons and
signals
- Motion artifacts are pronounced at high magnifications
- GCaMP fluorescence signals are typically weak
- Animals should be freely moving, i.e. unconstrained, to observe natural
behaviors
- Excitation light should be minimal to prevent light induced behavioral
response and photo-toxicity
Earlier methods for imaging GCaMP in moving worms sought to physically constrain the
worms and sacrificed free movement for ease of imaging. Immobilizing worms in glue or
by administering sedatives removed motion artifacts all together and enabled high
resolution imaging47,93,94. Guo et al. were even able to simultaneously combine ChR2
activation and GCaMP imaging of upstream and downstream neurons, respectively, using
spatially structured illumination to decipher functional connections in a stationary worm47.
Although these experiments did not allow GCaMP activity to be imaged during behavior
they could be linked by combining results from ChR2 and laser ablation experiments in
freely moving worms. An extension of this was to image worms in microfluidics devices
which allowed the local chemical environment to be precisely controlled and supposedly
resulted in less procioceptive sensory response than immobilization95–97. Recently, this
has become the platform for doing ‘whole-brain imaging’ in which neuronal activity from
50+ neurons are simultaneously recorded over several minutes9,98. These microfluidics
36
neurons. It is difficult to believe, however, that this method is significantly less
perturbing than immobilizing in glue as the worm’s movement is restricted to just a few
microns. Although dynamics in GCaMP activity can be observed, they cannot be directly
correlated to behavior, and must be understood in the context of the worm being
immobilized. Being able to image in a freely moving worm would solve these issues.
Special ‘worm arenas’ have been developed which partially constrain worm motion and
image with a lower magnification and larger field of view objective. The forces of
swimming in liquid is different from that of crawling on an agar pad and it is not clear if
the worm thinks and coordinates neural activity differently in these contexts99.
Furthermore, in compromising resolution for movement these techniques struggle with
signal-to-noise51. An alternative to constraining worm movement is to mechanically
compensate for it.
Techniques have been developed which mechanically compensate for motion
artifacts, i.e. track, but it has not been possible to do high resolution GCaMP imaging in a
freely moving worm for more than a few minutes. Here, freely moving, means crawling
on the surface of an agar pad—the most commonly studied context and from which most
behaviors have been characterized. This has been challenging because the worm’s speed
relative to imaging field of view is large and therefore requires both precise and fast
feedback. Latency, the total delay between the worm’s movement and system’s response
to it, must be minimal. Often mistaken as acquisition time or loop rate, latency includes
all the delays in the pipeline from acquisition, data transfer, computation, and mechanical
response. Low magnification tracking systems40,51,97 can follow worms for many minutes
37
measure GCaMP dynamics. Recently, several groups have started to do high
magnification and more precise tracking by tracking fluorescently tagged cells rather than
the body posture which is constantly distorting during locomotion3,48. These marker
neurons are typically much brighter than GCaMP and because they are stable, can be
used for tracking. Although these systems have higher magnifications and resolution,
they are still not capable of tracking freely moving worms on an agar pad. Not only are
they unable to correct for motion artifacts on the scale of the neurons they are trying to
image, but they cannot track the worms for the tens of minutes needed to see the slower
dynamics that characterize commonly studied behaviors such as local-global range
search51. Some confine the worms in mineral oil between a coverslip and the agar plate
where they crawl and reverse several times slower and more frequently, respectively3.
Others sacrifice resolution for speed by using a lower magnification such that the worm
does not leave the field of view between exposures48. Common to all of them is that they
use intense light to image GCaMP which is problematic.
One limitation of prior art tracking methods is that, although they keep the worm in
the field of view, they all require dangerously high levels of light. Edwards et. al
published a report which importantly, given the popularity of optogenetics, showed that C.
elegans is acutely sensitive to light79—particularly to blue and shorter wavelengths which
is what excites GCaMP. They showed that just 0.5 mW/mm2 of blue (500nm) light
evoked an escape behavior. 5.5 mW/mm2 of green (545nm) light showed no effect on the
worm over the course of an hour but 5 minutes of exposure to that same intensity of blue
was lethal. For comparison, current techniques use a minimum of 14 mW/mm2 and up to
38
responsible for the escape response to blue light79. Many groups, including ours, use this
mutant to eliminate the escape response when using blue light but this does not imply the
worm is not being stressed or damaged. Evidence supporting that worms are not stressed
or dying in these high light level tracking experiments is lacking. Even if existing
systems were technically able to reliably track worms for many minutes, they would
probably die within a few minutes due to the high light levels. More worrisome is that
GCaMP and the behavioral response measured from these systems might have to be
taken in the context of a dying worm. Other calcium indicators, mostly derived from
GCaMP, that are excited by longer wavelengths such as YCaMP and RCaMP exist and
could be used instead but are dim in comparison100.
My goal was to develop a real-time tracking and imaging system that used minimal
and safe levels of light. Even with state-of-the-art EMCCD cameras, using more than
10-fold less excitation light while still maintaining good signal-to-noise is difficult unless
exposure times are increased. Increased exposure times, however, exaggerate motion
artifacts. My approach, therefore, was to track the neurons so quickly and accurately that
they not only stayed in our field of view, but looked stationary. This technique is known
as ‘image stabilization’ and is widely used in photography, although there the motions
from the camera and operator are stabilized, not the object. Not only did this make
GCaMP imaging in a moving worm possible, but it enabled me to use spatially structured
light to selectively perturb neurons expressing photoactivatable rhodopsins as Guo et. al
did in a fixed worm47. I was therefore able to inhibit just the essential neurons identified
39
illumination has already been shown, but not in a freely moving worm and with such high
spatio-temporal resolution.
3.2.
Results
I designed and built a microscope that stabilizes the worms few hundred microns
per second artifacts to just a micron and allows GCaMP to be imaged with >30
millisecond long exposures and individual neurons to be photoactivated. I approached the
challenges of imaging GCaMP in a freely moving worm by separating tracking and
imaging such that they could be optimized independently. Tracking worm movements
and imaging GCaMP have inherently different timescales. Tracking should be done
quickly with minimal exposure times. Imaging GCaMP on the other hand should be done
with long exposure times such that low light levels can be used without sacrificing
signal-to-noise. To track with single-cell resolution, I naturally sought to track the cells
themselves. I labelled a specific neuron in the head region with mKusabira-Orange. This
bright ‘marker’ neuron label is then co-expressed with promoter driven GCaMP. I chose
AWCR or AWCL as the marker neuron because its soma which can be used for tracking
x,y,z is conveniently located in the head region where most of the sensory and
interneurons are and has process that projects anteriorly to the nose tip which can be used