Clinical Epidemiology 2018:10 549–560
Clinical Epidemiology
Dove
press
submit your manuscript | www.dovepress.com 549
O R I G I N A L R E S E A R C H
open access to scientific and medical research
Open Access Full Text Article
Validity of a method for the self-screening
of cardiovascular risk
María Barroso,1–3 Silvia
Pérez-Fernández,1,4 M Mar Vila,1,4,5
M Dolors Zomeño,6,7 Ruth
Martí-Lluch,8 Ferran Cordon,9
Rafel Ramos,8,10,11 Roberto
Elosua,1,4 Irene R Degano,1,4
Montse Fitó,5,12 Carmen
Cabezas,13 Gemma Salvador,13
Conxa Castell,13 María Grau1,4,14
1Cardiovascular Epidemiology and Genetics
Research Group, IMIM-Hospital del Mar Research Institute, 2Centre d’Atenció
Primària La Marina, Direcció d’Atenció Primària Barcelona, Institut Català de la Salut, 3Department of Pediatrics, Obstetrics,
Gynecology and Preventive Medicine, School of Medicine, Autonomous University of Barcelona, 4Consortium for Biomedical
Research in Cardiovascular Disease (CIBERCV), 5Department of Mathematics
and Computer Science, University of Barcelona, 6Cardiovascular Risk and
Nutrition, IMIM-Hospital del Mar Research Institute, 7School of Health Sciences,
Blanquerna-Ramon Llull University, Barcelona, Spain; 8Unitat de Suport a la
Recerca de Girona, Institut Universitari d’Investigació en Atenció Primària Jordi Gol, 9Centre d’Atenció Primària Montilivi,
Direcció d’Atenció Primària Girona, Institut Català de la Salut, 10Department of Medical
Sciences, School of Medicine, University of Girona, 11Girona Biomedical Research
Institute, Girona, Spain; 12Consortium
for Biomedical Research in Obesity and Nutrition (CIBEROBN), 13Catalan Agency
of Public Health, 14Department of Medicine,
University of Barcelona, Barcelona, Spain
Background: The validity of a cardiovascular risk self-screening method was assessed. The results obtained for self-measurement of blood pressure, a point-of-care system’s assessment of lipid profile and glycated hemoglobin, and a self-administered questionnaire (sex, age, diabetes, tobacco consumption) were compared with the standard screening (gold standard) conducted by a health professional.
Methods: Crossover clinical trial on a population-based sample from Girona (north-eastern Spain), aged 35–74, with no cardiovascular disease at recruitment. Participants were random-ized to one of the two risk assessment sequences (standard screening followed by self-screening or vice versa). Cardiovascular risk was estimated with the Framingham-REGICOR function. Concordance between methods was estimated with the intraclass correlation coefficient (ICC). Sensitivity, specificity, and positive and negative predictive values were estimated, considering 5% cardiovascular risk as the cutoff point. ClinicalTrials.gov Registration #NCT02373319. Clinical Research Ethic Committee of the Parc de Salut Mar Registration #2014/5815/I.
Results: The median cardiovascular risk in men was 2.56 (interquartile range: 1.42–4.35)
estimated by standard methods and 2.25 (1.28–4.07) by self-screening with ICC=0.92 (95%
CI: 0.90–0.93). In women, the cardiovascular risk was 1.14 (0.61–2.10) by standard methods and 1.10 (0.56–2.00) by self-screening, with ICC=0.89 (0.87–0.90). The sensitivity, specificity, and positive and negative predictive values for the self-screening method were 0.74 (0.63–0.82), 0.97 (0.95–0.99), 0.86 (0.77–0.93), and 0.94 (0.91–0.96), respectively, in men. In women, these values were 0.50 (0.30–0.70), 0.99 (0.98–1), 0.81 (0.54–0.96), and 0.97 (0.95–0.99), respectively.
Conclusion: The self-screening method for assessing cardiovascular risk provided similar results to the standard method. Self-screening had high clinical performance to rule out intermediate or high cardiovascular risk.
Keywords: risk assessment, cardiovascular diseases, preventive medicine, public health, epi-demiology, empowerment
Background
Cardiovascular diseases are the main cause of death in the developed world and are
gaining importance in low-income countries.1 Nonetheless, a substantial fall in
cardio-vascular disease mortality has been observed in developed countries, approximately half of which has been attributed to cost-effective evidence-based treatments used in clinical cardiology and half to the crucial role of healthy diet, increased physical
activity, and decreased consumption of tobacco and alcohol.2,3 These key drivers are
increasingly recognized as being potentially powerful, rapid, equitable, and cost-saving.4
Currently, the first step in cardiovascular risk screening is the estimation of
cardiovas-cular risk using validated risk functions.5,6 This procedure, usually performed in primary
Correspondence: María Grau Cardiovascular Epidemiology and Genetics, IMIM-Hospital del Mar Research Institute, Barcelona E-08003, Spain
Tel +34 93 316 0800 Fax +34 93 316 0796 Email [email protected]
Journal name: Clinical Epidemiology Article Designation: ORIGINAL RESEARCH Year: 2018
Volume: 10
Running head verso: Barroso et al
Running head recto: Self-screening of cardiovascular risk DOI: http://dx.doi.org/10.2147/CLEP.S158358
Clinical Epidemiology downloaded from https://www.dovepress.com/ by 118.70.13.36 on 20-Aug-2020
For personal use only.
Dovepress Barroso et al
care settings under the supervision of health professionals, has
limitations.5,7 For instance, there is a wide gap between expert
recommendations and actual preventive practice.8 Physicians
have been found to have difficulty meeting the international standards even when they strongly believe that preventive care is important and that risk factors for cardiovascular
disease can and should be reduced.9,10 Moreover, the current
screening strategy may not reach young, healthy people, who
are less likely to visit primary care settings11 but are also the
main audience for the preventive message because cumulative exposure to cardiovascular risk factors over time precedes the clinical expression of cardiovascular diseases.
In addition, the trends in coronary heart disease mortal-ity in the USA show a troubling contrast between the steep decrease recently observed in older populations and the small
decreases in young populations.12 Although the low burden of
cardiovascular diseases in younger populations would make it difficult to observe dramatic decreases, the implementa-tion of preventive programs in young people is key to reduce the incidence at older ages. This paradigm may change if individuals can be empowered to assume a leading role in
making decisions about their own health.13 Thus, the use of a
self-screening method to assess cardiovascular risk may help to increase population awareness and shared responsibility for cardiovascular disease prevention.
To better address a key target population for the preventive message, the objective of the present study was to evaluate the validity of a cardiovascular risk self-screening method that includes self-measurement of blood pressure, a point-of-care assessment of lipid profile and glycated hemoglobin, and a self-administered questionnaire (sex, age, diabetes, tobacco consumption), compared with the standard screening (gold standard) conducted by a health professional.
Methods
In a randomized crossover clinical trial in the city of Girona and surrounding areas (northeastern Spain), individuals were randomly selected from the reference population. Those aged 35–74 who did not present with cardiovascular diseases at baseline were included in the study. Participants were ran-domly assigned to one of two cardiovascular risk screening sequences: standard screening followed by self-screening or vice versa. Both screening methods were performed the same day and included the eight variables used to estimate cardiovascular risk with the Framingham function, adapted
and validated for the Spanish population14 using the
stan-dard methodology15: sex, age, systolic and diastolic blood
pressure, total cholesterol, high-density lipoprotein (HDL)
cholesterol, tobacco consumption, and diabetes. The only difference between the screening methods was the active role of the team of trained nurses in the standard screening and their minimal supervision of the self-screening, mainly related to blood capillary extraction and analysis.
We needed a sample size of 900 individuals to estimate a kappa index of 0.8 with 95% CI, considering that 65% of
the reference population presented with low risk (<5%), 25%
with intermediate risk (≥5% and <10%), and 10% with high
risk (≥10%).6
All participants provided written informed consent before enrollment. The present study was approved by the Clinical Research Ethic Committee of the Parc de Salut Mar (CEIC-PSMAR, #2014/5815/I) and has been registered in ClinicalTrials.gov (#NCT02373319).
Blood pressure measurement
Blood pressure was measured with an automatic blood pressure monitor and a cuff adapted to upper arm perimeter (young, adult, obese) for each participant. After a 5-min rest, two measurements were taken, at least 2 minutes apart, and the lower value was recorded for the study. The cutoff points for hypertension followed the criteria in the Seventh
Report of the Joint National Committee.16 The team of nurses
performed these measures in the standard screening; in the self-screening, computer prompts guided the participants to independently measure and record their blood pressure.
Laboratory tests
To determine the lipid profile (total cholesterol, HDL cho-lesterol, and triglycerides) and the glycated hemoglobin in the standard screening procedure, blood was withdrawn in
<60 seconds after 10–14 h fasting. Serum sample aliquots
were stored at –80°C. Total cholesterol and HDL cholesterol concentrations were determined by enzymatic and direct methodologies, respectively (ABX-Horiba, Montpellier,
France). When triglycerides were <300 mg/dL, low-density
lipoprotein cholesterol was calculated using the Friedewald formula. Glycated hemoglobin was determined by colo-rimetry and latex agglutination procedures (ABX-Horiba). All analyses were performed in a central laboratory. When participants used the self-screening methodology, they performed a capillary blood analysis with the Cobas b101 (Roche Diagnostics, Basel, Switzerland) point-of-care device under nurse supervision. Total and HDL choles-terol (ApoB precipitation) were determined by enzymatic methods and glycated hemoglobin by latex agglutination procedure.
Clinical Epidemiology downloaded from https://www.dovepress.com/ by 118.70.13.36 on 20-Aug-2020
Dovepress Self-screening of cardiovascular risk
Other variables collected
Both screening methods collected data on sex, age, educa-tional level, tobacco consumption, and self-reported diabetes and related treatment with self-administered standard ques-tionnaires. Although educational level was not required to estimate the cardiovascular risk, this variable was collected for the assessment of comparability of the two study groups. Diabetes was considered whenever an individual reported a history of the disorder, was being treated with insulin or oral antidiabetic treatments, or presented with a glycated
hemoglobin ≥6.5%.17
A precision scale of easy calibration was used for weight measurement with participants in underwear. Height was measured with a standard measuring rod, with participants standing barefoot. Body mass index was determined as
weight divided by squared height (kg/m2). Waist perimeter
was also collected.
Statistical analysis
All analyses were stratified by sex. Categorical variables were presented as proportions and continuous variables as mean and SD or median and interquartile range when their distribution departed from normal.
To compare the results of the standard and the self- screening methods, the intraclass correlation coefficient (ICC) and kappa index were estimated for continuous (total and HDL cholesterol, glycated hemoglobin, systolic and diastolic blood pressure, cardiovascular risk) and categori-cal variables (diabetes), respectively. We also estimated the kappa index in a sensitivity analysis, considering glycemia in the estimate of diabetes prevalence for the standard
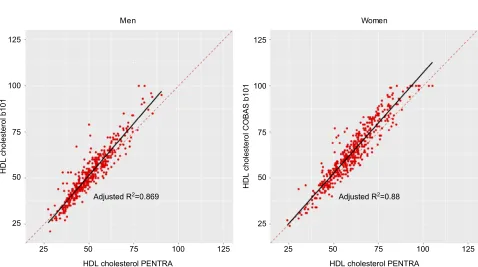
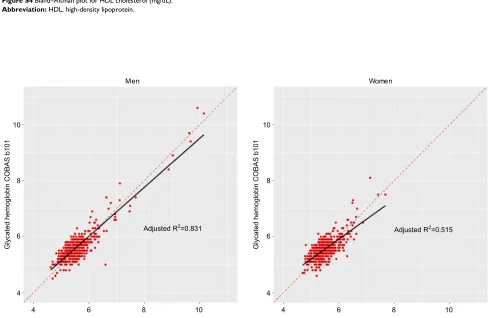
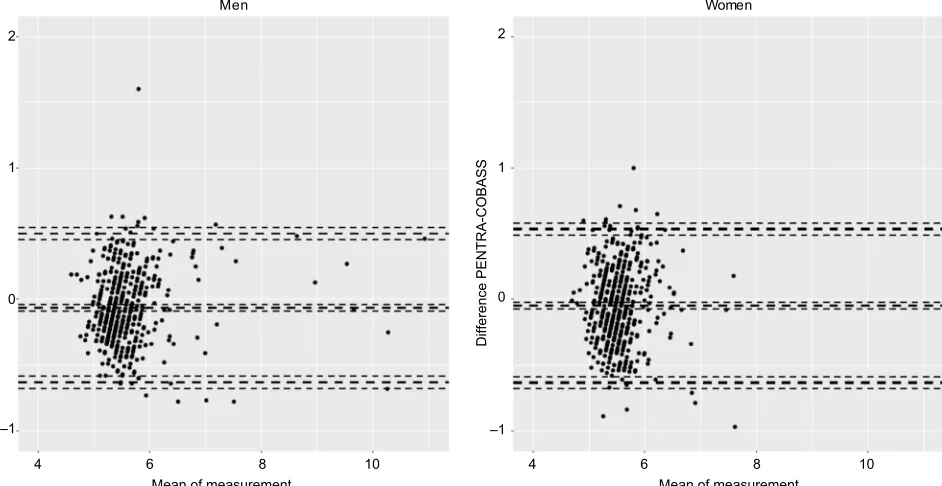
screening. Additionally, the concordance of lipid measure-ments and glycated hemoglobin between the ABX-Horiba
Pentra autoanalyzer® (standard screening) and the Cobas
b101® point-of-care device (self-screening) was measured
using the R2 coefficient of determination and Bland– Altman
plots.18 We estimated the Pearson correlation between the
two screening methods and compared the distribution in
three cardiovascular risk categories (low <5%, intermediate
≥5% and <10%, and high ≥10%) with chi-square tests. We
described the intermediate/high-risk individuals identified with each strategy and estimated sensitivity, specificity, and the positive and negative predictive value, likelihood ratios of a positive and a negative test, diagnostic accuracy and odds ratio, Youden Index, and area under the receiver operator
characteristics (ROC) curve at a cutoff point ≥5%.19
All the statistical analyses were performed with the R Statistical Package (R Foundation for Statistical Computing, Vienna, Austria; V.3.3.2).
Results
The present study included 937 individuals (52.3% women)
with mean age of 50 years (SD=10) (Figure 1) and a response
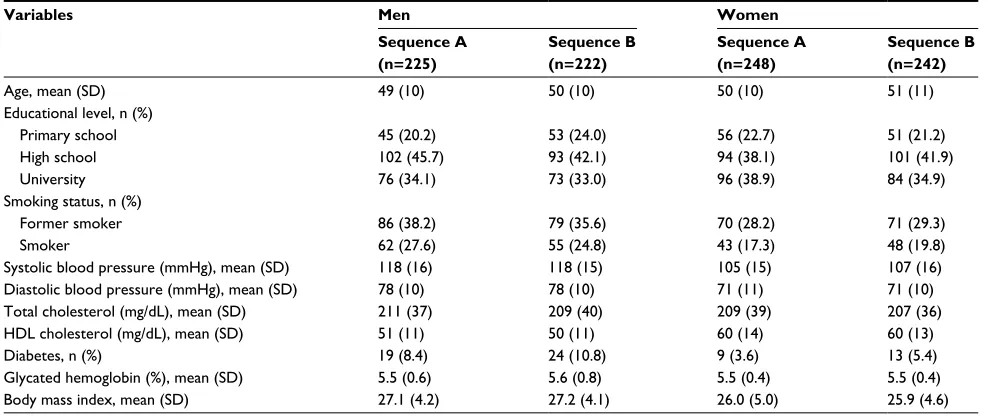
rate of 60%. No sex or age differences were found between participants and nonparticipants. Table 1 summarizes the main characteristics of the participants by sex and screen-ing sequence. The additional variables, not used to estimate the cardiovascular risk, have been described using the same stratification in Table S1. The concordance between self-screening and standard measures was high for all single
variables studied (ICC≥0.86), except for glycated hemoglobin
in women (ICC=0.72). The ICCs for cardiovascular risk were
Figure 1 Flow chart of the participants in the ACRISC Study.
Abbreviation: CVR, cardiovascular risk; ACRISC, self-screening of cardiovascular risk.
Participants N=937
Sequence A N=473 (50.5%)
Men N=225 (47.6%)
CVR <5%
N=182 (80.9%) N=236 (95.2%)CVR <5% N=178 (80.2%)CVR <5% N=228 (94.2%)CVR <5% CVR ≥5% and <10%
N=13 (5.4%) CVR ≥5% and <10%
N=37 (16.7%) CVR ≥5% and <10%
N=12 (4.8%) CVR ≥10% N=0 (0.0%) CVR ≥5% and <10%
N=37 (16.4%) CVR ≥10%
N=6 (2.7%) N=7 (3.2%)CVR ≥10% N=1 (0.4%)CVR ≥10%
Women
N=248 (52.4%) N=222 (47.8%)Men N=242 (52.2%)Women Sequence B
N=464 (49.5%)
Clinical Epidemiology downloaded from https://www.dovepress.com/ by 118.70.13.36 on 20-Aug-2020
Dovepress Barroso et al
high in both men and women (0.92 [95% CI: 0.90–0.93] and 0.89 [0.87–0.90], respectively) (Table 2 and Figure 2). The results of the sensitivity analysis using glycemia for the standard screening yielded similar results (kappa index in men and in women: 0.94 and 0.86, respectively). Figures
S1–S6 show the linear regression plots with the estimated R2
and the Bland–Altman plots for total and HDL cholesterol and glycated hemoglobin levels as measured with the Pentra
autoanalyzer® and Cobas b101® point-of-care device.
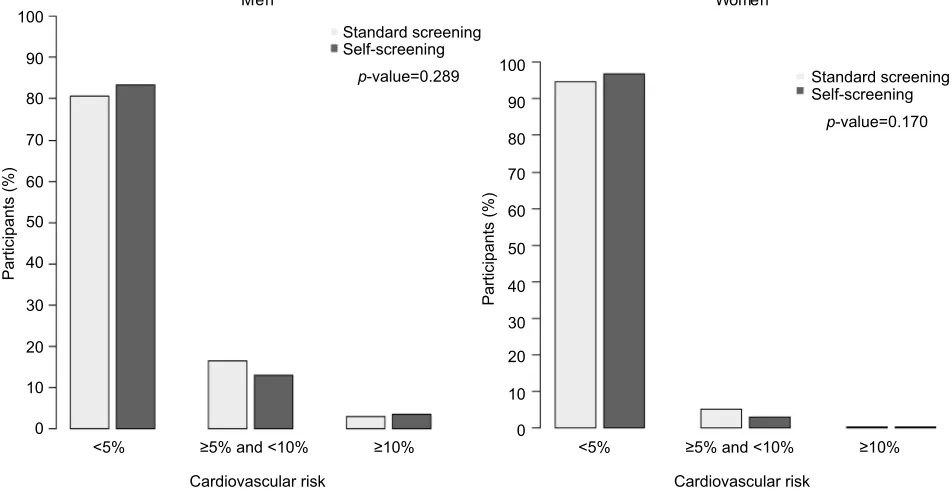
The standard and self-screening methods did not differ significantly in their classification of individuals by risk
category (<5%, ≥5% and <10%, and ≥10%) with a kappa
index =0.80 (Figure 3).
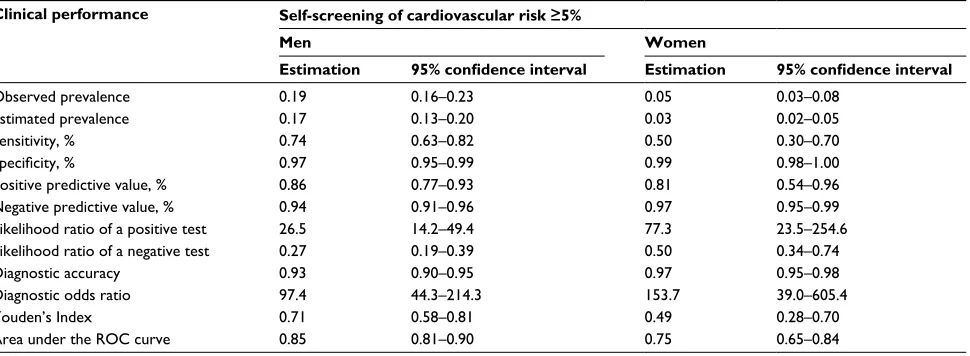
Self-screening of cardiovascular risk considering a cutoff
point ≥5% showed high specificity and negative predictive
value in both men and women. The likelihood ratio for a positive test (26.5 in men and 77.3 in women) indicated high probability of increased risk and the likelihood ratio for a negative test showed low probability of increased risk (0.27 and 0.50, respectively). The diagnostic accuracy was also high, pointing out a marked proportion of correctly classified subjects. In addition, the estimates of diagnostic odds ratio, the Youden Index, and the area under the ROC curve showed a satisfactory discriminative power of the self-screening using the 5% cutoff point (Table 3).
Discussion
The estimation of cardiovascular risk is acknowledged as the first step in cardiovascular prevention, enabling application of the most efficient preventive strategy in each individual.
Table 1 Participant characteristics by screening sequence
Variables Men Women
Sequence A
(n=225)
Sequence B
(n=222)
Sequence A
(n=248)
Sequence B
(n=242)
Age, mean (SD) 49 (10) 50 (10) 50 (10) 51 (11)
Educational level, n (%)
Primary school 45 (20.2) 53 (24.0) 56 (22.7) 51 (21.2)
High school 102 (45.7) 93 (42.1) 94 (38.1) 101 (41.9)
University 76 (34.1) 73 (33.0) 96 (38.9) 84 (34.9)
Smoking status, n (%)
Former smoker 86 (38.2) 79 (35.6) 70 (28.2) 71 (29.3)
Smoker 62 (27.6) 55 (24.8) 43 (17.3) 48 (19.8)
Systolic blood pressure (mmHg), mean (SD) 118 (16) 118 (15) 105 (15) 107 (16)
Diastolic blood pressure (mmHg), mean (SD) 78 (10) 78 (10) 71 (11) 71 (10)
Total cholesterol (mg/dL), mean (SD) 211 (37) 209 (40) 209 (39) 207 (36)
HDL cholesterol (mg/dL), mean (SD) 51 (11) 50 (11) 60 (14) 60 (13)
Diabetes, n (%) 19 (8.4) 24 (10.8) 9 (3.6) 13 (5.4)
Glycated hemoglobin (%), mean (SD) 5.5 (0.6) 5.6 (0.8) 5.5 (0.4) 5.5 (0.4)
Body mass index, mean (SD) 27.1 (4.2) 27.2 (4.1) 26.0 (5.0) 25.9 (4.6)
Abbreviation: HDL, high-density lipoprotein.
Table 2 Concordance between self-screening and standard measures needed to estimate cardiovascular risk, stratified by sex
Variables Men Women
Standard screening
(n=447)
Self-screening
(n=447)
Concordance (95% CI)
Standard screening
(n=490)
Self-screening
(n=490)
Concordance (95% CI)
Systolic blood pressure (mmHg), mean (SD) 118 (15) 118 (15) 0.86 (0.83–0.88)a 106 (16) 106 (16) 0.86 (0.83–0.88)a Diastolic blood pressure (mmHg), mean (SD) 78 (10) 78 (10) 0.88 (0.86–0.90)a 71 (10) 73 (11) 0.87 (0.84–0.89)a Total cholesterol (mg/dL), mean (SD) 210 (38) 200 (35) 0.86 (0.69–0.92)a 208 (37) 199 (34) 0.90 (0.74–0.95)a HDL cholesterol (mg/dL), mean (SD) 51 (11) 52 (13) 0.91 (0.88–0.93)a 60 (13) 64 (15) 0.90 (0.76–0.95)a Glycated hemoglobin, mean (SD) 5.6 (0.7) 5.7 (0.8) 0.91 (0.89–0.93)a 5.5 (0.4) 5.6 (0.5) 0.72 (0.67–0.76)a
Diabetes, n (%) 43 (9.6) 44 (9.8) 0.94b 22 (4.5%) 26 (5.3%) 0.87b
Cardiovascular risk, median (IQR) 2.56 (1.42–4.35)
2.25 (1.28–4.07)
0.92 (0.90–0.93)a
1.14 (0.61–2.10)
1.10 (0.56–2.00)
0.89 (0.87–0.90)a
Notes:aIntraclass coefficient correlation; bkappa index.
Abbreviations: HDL, high-density lipoprotein; IQR, interquartile range.
Clinical Epidemiology downloaded from https://www.dovepress.com/ by 118.70.13.36 on 20-Aug-2020
Dovepress Self-screening of cardiovascular risk
The innovative self-screening method proposed empowers the individual to measure and record the eight health vari-ables (blood pressure, lipid profile, glycated hemoglobin, age, sex, tobacco consumption, diabetes) required to assess cardiovascular risk, with minimal supervision by a health professional. As results obtained were similar to the gold-standard clinical method, healthy people who do not frequent clinical settings could increase their awareness and avoid
preventable cardiovascular disease by conducting their own risk assessment at their convenience.
Empowerment for the prevention of
cardiovascular diseases
Population empowerment is considered a key principle of
health promotion by the World Health Organization.20 This
concept emphasizes that all persons have strengths and Figure 2 Correlation between standard screening and self-screening measures of cardiovascular risk
0 5 10
Cardiovascular risk self-screening (%) Cardiovascular risk self-screening (%)
Cardiovascular risk standard screening (%
)
Cardiovascular risk standard screening (%
)
Pearson correlation (95% CI) = 0.92 (0.91–0.93) Pearson correlation (95% CI) = 0.89 (0.87–0.90)
15 20 0 5 10 15 20
20
10
5
0 15
20
10
5
0 15
Men Women
Figure 3 Distribution of participants by cardiovascular risk category according to standard screening and self-screening results. Men
Standard screening Self-screening
p-value=0.289 Standard screening
Self-screening
p-value=0.170 Women
Participants (%
)
Participants (%
)
100
90
80
70
60
50
40
30
20
10
0
100
90
80
70
60
50
40
30 20
10
0 <5% ≥5% and <10%
Cardiovascular risk
≥10% <5% ≥5% and <10% Cardiovascular risk
≥10%
Clinical Epidemiology downloaded from https://www.dovepress.com/ by 118.70.13.36 on 20-Aug-2020
Dovepress Barroso et al
providing appropriate resources enhances these strengths. This focus on lifestyle choices and personal responsibil-ity has the potential to change how healthy people avoid preventable cardiovascular diseases as well as other chronic diseases and could indirectly promote choices of healthful activities. Recent reports have identified two approaches, improvement of individual patient skills and transfer of power and decision-making authority about interventions to
patients, as effective empowerment strategies.21 The present
study aimed to validate an easy procedure to self-collect eight variables of general interest (age, sex, tobacco con-sumption, diabetes, systolic and diastolic blood pressure, and total and HDL cholesterol) to estimate cardiovascular risk. As in previous studies, lifetime risk increased expo-nentially after 55 years of age according to the number of
cardiovascular risk factors above the recommended levels.22
Additionally, the combination of such variables in a car-diovascular risk score (e.g., Framingham-REGICOR score validated for the Spanish population) provides valid
infor-mation about an individual’s 10-year cardiovascular risk.6
General practitioners play an important role in the primary prevention of cardiovascular disease; however, mhealth has the potential to promote patient self-management, as a complement to the doctor’s intervention, and encourage greater participation in medical decision making. Our solu-tion could be used together with usual office consultasolu-tion and remote patient monitoring to implement a health care model including personalized health care delivery with an early diagnosis and treatment if needed. Although our self-screening method is not the first to be described in the
literature,23,24 its novelty is the self-collection of objective
variables (e.g., blood pressure, lipid profile, weight) with validated devices.
Prevention of cardiovascular disease in
healthy individuals
Numerous innovations in health information technology are empowering individuals to assume a more active role in monitoring and managing their health and wellness, as well
as their chronic conditions and therapeutic regimens.25 The
effectiveness of self-management in chronic diseases has been analyzed through traditional education programs or, more recently, through mobile apps and other information
and communication technologies.25–27 Regarding the latter,
innovative approaches have been reported for overcoming
obesity,28 encouraging regular physical activity29 and
smok-ing cessation,30 control of hypertension31 and dyslipidemia,32
and treating diabetes mellitus.33 However, a major limitation
of these innovative technologies is the absence of published evaluations. The present crossover clinical trial validates a new self-screening system that aims to empower individuals to assess their own cardiovascular risk. This device also could be used to estimate the risk of other chronic diseases such as
cancer34–36 or cognitive decline37 in which the assessed
comor-bidities (hypertension, diabetes, obesity, dyslipidemia) play a crucial role. The added value of this validated procedure is the stratification of population risk, as users become aware about their own health and the most efficient strategies for preventing chronic diseases. Self-screening for cardiovascular risk yielded remarkable specificity and negative predictive values compared with the gold standard. In addition, there was high concordance between methods in the estimated cardiovascular risk category.
Table 3 Sensitivity, specificity, positive and negative predictive values, diagnostic accuracy and odds, Youden’s Index, and area under the ROC curve of self-screening compared with standard screening, stratified by sex
Clinical performance Self-screening of cardiovascular risk ≥5%
Men Women
Estimation 95% confidence interval Estimation 95% confidence interval
Observed prevalence 0.19 0.16–0.23 0.05 0.03–0.08
Estimated prevalence 0.17 0.13–0.20 0.03 0.02–0.05
Sensitivity, % 0.74 0.63–0.82 0.50 0.30–0.70
Specificity, % 0.97 0.95–0.99 0.99 0.98–1.00
Positive predictive value, % 0.86 0.77–0.93 0.81 0.54–0.96
Negative predictive value, % 0.94 0.91–0.96 0.97 0.95–0.99
Likelihood ratio of a positive test 26.5 14.2–49.4 77.3 23.5–254.6
Likelihood ratio of a negative test 0.27 0.19–0.39 0.50 0.34–0.74
Diagnostic accuracy 0.93 0.90–0.95 0.97 0.95–0.98
Diagnostic odds ratio 97.4 44.3–214.3 153.7 39.0–605.4
Youden’s Index 0.71 0.58–0.81 0.49 0.28–0.70
Area under the ROC curve 0.85 0.81–0.90 0.75 0.65–0.84
Abbreviation: ROC, receiver operator characteristics.
Clinical Epidemiology downloaded from https://www.dovepress.com/ by 118.70.13.36 on 20-Aug-2020
Dovepress Self-screening of cardiovascular risk
Limitations
Risk estimation is considered the best tool to prioritize primary
prevention strategies.5,8 Our crossover clinical trial aimed to
validate a new self-screening method in a population-based sample that covered a very wide range of cardiovascular risk. Participants were randomized to one of two sequences of risk assessment (i.e., the current gold standard followed by self-screening or vice versa) and all four risk measurements (sys-tolic and dias(sys-tolic blood pressure, total and HDL cholesterol) were collected with both methodologies. Selection bias may affect the present study, but is likely to be modest because it was population-based and participants were not selected on the basis of cardiovascular risk. In addition, the low cardiovascular
risk traditionally observed in Mediterranean women38 and also
reflected in our analysis may explain the low sensitivity of the self-screening (50%) to rule out intermediate or high cardiovas-cular risk. Despite the availability of a cardiovascardiovas-cular risk score with no laboratory and blood pressure determinations that has
been validated for the Spanish population,39 we preferred to
validate the self-screening procedure using the more accurate
Framingham-REGICOR cardiovascular risk chart.6,14 The aim
of the study was to assess the validity of a cardiovascular risk self-screening method by comparing the results with a gold standard (current clinical practice). However, we did not test whether the self-screening had an effect on health outcomes. Further randomized clinical trials should be performed to answer this question. Finally, although our aim is to empower individuals to monitor their cardiovascular health, preferably at home, the blood capillary extraction and analysis must be supervised by a health care professional. Thus, the present version of the system must be implemented at a centralized location that is readily accessible to the target population (e.g., pharmacies, primary health care settings).
Future directions
This self-screening system encourages users to take respon-sibility for their own health and well-being. Although health care professionals are ideally positioned to provide advice and education on risk factors and lifestyle modifications to people living with chronic conditions, a large part of the healthy population seldom visits a health care provider. Thus, a validated self-management system based on objective measurements empowers healthy people to avoid preventable cardiovascular and other chronic diseases. Our innovative method makes it possible to expand screening coverage to healthy populations, encouraging personal empowerment and increasing self-awareness of individual risk. A feedback strategy could be combined with tailored lifestyle
recom-mendations to improve adherence to healthier habits and encourage effective disease prevention strategies.
Conclusion
The self-screening method for assessing cardiovascular risk provided similar results to the standard method. In addition, this innovative system showed high clinical performance to
rule out intermediate or high cardiovascular risk (i.e., ≥5%).
Acknowledgments
The authors wish to thank Marta Cabañero, Leny Franco, Neus Guday, Montse Peris, Martina Sidera, and Susanna Tello for their contribution to the data collection and man-agement of this project and appreciate the revision of the English text by Elaine Lilly, Ph D. This study was partially financed with unconditional support from Roche Diagnostics and by Spain’s Ministry of Economy and Competitiveness through the Carlos III Health Institute FEDER (CM12/03287, CPII17/00012, and FIS14/00449).
Author contributions
All authors made substantial contributions to conception and design, acquisition of data, or analysis and interpretation of data; took part in drafting the article or revising it critically for important intellectual content; gave final approval of the version to be published; and agree to be accountable for all aspects of the work.
Disclosure
The authors report no conflicts of interest in this work.
References
1. World Health Statistics. Monograph on the Internet. Geneva: World Health Organization. Available from: https://apps.who.int/infobase/. Accessed January 27 2017.
2. Capewell S, Ford ES, Croft JB, Critchley JA, Greenlund KJ, Labarthe DR. Cardiovascular risk factor trends and potential for reducing coro-nary heart disease mortality in the United States of America. Bull World Health Organ. 2010;88(2):120–130.
3. Flores-Mateo G, Grau M, O’Flaherty M, et al. [Analyzing the coronary heart disease mortality decline in a Mediterranean population: Spain 1988–2005]. Rev Esp Cardiol. 2011;64(11):988–996. Spanish. 4. O’Flaherty M, Buchan I, Capewell S. Contributions of treatment and
lifestyle to declining CVD mortality: why have CVD mortality rates declined so much since the 1960s? Heart. 2013;99(3):159–162. 5. Grau M, Marrugat J. Risk functions and the primary prevention of
cardiovascular disease. Rev Esp Cardiol. 2008;61(4):404–416. 6. Marrugat J, Vila J, Baena-Díez JM, et al. [Relative validity of the 10-year
cardiovascular risk estimate in a population cohort of the REGICOR study]. Rev Esp Cardiol. 2011;64(5):385–394. Spanish.
7. McKee G, Kerins M, Hamilton G, et al. Barriers to ESC guideline implementation: results of a survey from the European Council on Cardiovascular Nursing and Allied Professions (CCNAP). Eur J Car-diovasc Nurs. 2017;16(8):678–686.
Clinical Epidemiology downloaded from https://www.dovepress.com/ by 118.70.13.36 on 20-Aug-2020
Dovepress Barroso et al
8. Piepoli MF, Hoes AW, Agewall S, et al. 2016 European Guidelines on cardiovascular disease prevention in clinical practice: the Sixth Joint Task Force of the European Society of Cardiology and Other Societies on Cardiovascular Disease Prevention in Clinical Practice. Eur Heart J. 2016;37(29):2315–2381.
9. Gjelsvik B. Conflicts and dilemmas in prevention of cardiovascular disease. The new, Norwegian guidelines--a new approach to risk man-agement. Eur J Gen Pract. 2012;18(1):56–62.
10. Vancheri F, Strender LE, Backlund LG. General practitioners’ coronary risk estimates, decisions to start lipid-lowering treatment, gender and length of clinical experience: their interactions in primary prevention.
Prim Health Care Res Dev. 2013;14(4):394–402.
11. Catalán-Ramos A, Verdú JM, Grau M, et al. Population prevalence and control of cardiovascular risk factors: what electronic medical records tell us. Aten Primaria. 2014;46(1):15–24.
12. Wilmot KA, O’Flaherty M, Capewell S, Ford ES, Vaccarino V. Coronary heart disease mortality declines in the United States from 1979 through 2011: evidence for stagnation in young adults, especially women. Cir-culation. 2015;132(11):997–1002.
13. Feigin VL, Norrving B, Mensah GA. Primary prevention of cardiovas-cular disease through population-wide motivational strategies: insights from using smartphones in stroke prevention. BMJ Glob Health.
2017;2(2):e000306.
14. Marrugat J, Subirana I, Comín E, et al; VERIFICA Investigators. Valid-ity of an adaptation of the Framingham cardiovascular risk function: the VERIFICA Study. J Epidemiol Community Health. 2007;61(1): 40–47.
15. Manual of The MONICA Project [Manual on the Internet]. Geneva: World Health Organisation; 2000. Available from: http://www.ktl.fi/ publications/monica/manual/index.htm. Accessed January 8, 2017. 16. Chobanian AV, Bakris GL, Black HR, et al; Joint National Committee
on Prevention, Detection, Evaluation, and Treatment of High Blood Pressure. National Heart, Lung, and Blood Institute; National High Blood Pressure Education Program Coordinating Committee. Seventh report of the Joint National Committee on Prevention, Detection, Evaluation, and Treatment of High Blood Pressure. Hypertension.
2003;42(6):1206–1252.
17. Sacks DB, Arnold M, Bakris GL, et al; National Academy of Clinical Biochemistry. Guidelines and recommendations for laboratory analysis in the diagnosis and management of diabetes mellitus. Diabetes Care.
2011;34(6):e61–e99.
18. Bland JM, Altman DG. Statistical methods for assessing agreement between two methods of clinical measurement. Lancet. 1986;1:307–310. 19. Šimundić AM. Measures of diagnostic accuracy: basic definitions.
EJIFCC. 2009;19(4):203–211.
20. Woodall J, Raine G, South J, Warwick-Booth L. Empowerment and Health & Well-Being: Evidence Review. Leeds: Centre for Health Pro-motion Research, Leeds Metropolitan University; 2010.
21. Wallerstein N. What is the evidence on effectiveness of empowerment to improve health? 2006. Copenhagen: WHO Regional Office for Europe (Health Evidence Network report. Available from: http://www.euro.who. int/Document/E88086.pdf. Accessed October 1, 2017.
22. Berry JD, Dyer A, Cai X, et al. Lifetime risks of cardiovascular disease.
N Engl J Med. 2012;366(4):321–329.
23. Neufingerl N, Cobain MR, Newson RS. Web-based self-assessment health tools: who are the users and what is the impact of missing input information? J Med Internet Res. 2014;16(9):e215.
24. Patel RS, Lagord C, Waterall J, Moth M, Knapton M, Deanfield JE. Online self-assessment of cardiovascular risk using the Joint British Societies (JBS3)-derived heart age tool: a descriptive study. BMJ Open.
2016;6(9):e011511.
25. Burke LE, Ma J, Azar KM, et al. Current science on consumer use of mobile health for cardiovascular disease prevention: a scientific statement from the American Heart Association. Circulation. 2015;132(12):1157–1213. 26. Warsi A, Wang PS, LaValley MP, Avorn J, Solomon DH. Self-management education programs in chronic disease: a systematic review and methodological critique of the literature. Arch Intern Med.
2004;164(15):1641–1649.
27. Kim BY, Lee J. Smart devices for older adults managing chronic disease: a scoping review. JMIR Mhealth Uhealth. 2017;5(5):e69.
28. Siopis G, Chey T, Allman-Farinelli M. A systematic review and meta-analysis of interventions for weight management using text messaging.
J Hum Nutr Diet. 2015;28(Suppl 2):1–15.
29. Bort-Roig J, Gilson ND, Puig-Ribera A, Contreras RS, Trost SG. Mea-suring and influencing physical activity with smartphone technology: a systematic review. Sports Med. 2014;44(5):671–686.
30. Whittaker R, McRobbie H, Bullen C, Borland R, Rodgers A, Gu Y. Mobile phone-based interventions for smoking cessation. Cochrane Database Syst Rev. 2012;11:CD006611.
31. Uhlig K, Patel K, Ip S, Kitsios GD, Balk EM. Self-measured blood pressure monitoring in the management of hypertension: a systematic review and meta-analysis. Ann Intern Med. 2013;159(3):185–194. 32. Dekkers JC, van Wier MF, Ariëns GA, et al. Comparative effectiveness
of lifestyle interventions on cardiovascular risk factors among a Dutch overweight working population: a randomized controlled trial. BMC Public Health. 2011;11(1):49.
33. Pal K, Eastwood SV, Michie S, et al. Computer-based diabetes self-management interventions for adults with type 2 diabetes mellitus.
Cochrane Database Syst Rev. 2013;(3):CD008776.
34. Koene RJ, Prizment AE, Blaes A, Konety SH. Shared risk factors in car-diovascular disease and cancer. Circulation. 2016;133(11):1104–1114. 35. Baena-Díez JM, Peñafiel J, Subirana I, et al. Risk of cause-specific death in individuals with diabetes: a competing risks analysis. Diabetes Care.
2016;39(11):1987–1995.
36. Barroso M, Goday A, Ramos R, et al; FRESCO Investigators. Interaction between cardiovascular risk factors and body mass index and 10-year incidence of cardiovascular disease, cancer death, and overall mortality.
Prev Med. 2018;107:81–89.
37. Srinivasa RN, Rossetti HC, Gupta MK, et al. Cardiovascular risk factors associated with smaller brain volumes in regions identified as early predictors of cognitive decline. Radiology. 2016;278(1):198–204. 38. Grau M, Elosua R, Cabrera de León A, et al. Cardiovascular risk factors
in Spain in the first decade of the 21st century, a pooled analysis with individual data from 11 population-based studies: the DARIOS study.
Rev Esp Cardiol. 2011;64(4):295–304.
39. Marrugat J, Subirana I, Ramos R, et al; FRESCO Investigators. Deri-vation and validation of a set of 10-year cardiovascular risk predictive functions in Spain: the FRESCO Study. Prev Med. 2014;61:66–74.
Clinical Epidemiology downloaded from https://www.dovepress.com/ by 118.70.13.36 on 20-Aug-2020
Dovepress Self-screening of cardiovascular risk
Supplementary materials
Table S1 Participant characteristics (additional variables) by screening sequence
Variables Men Women
Sequence A
(n=225)
Sequence B
(n=222)
Sequence A
(n=248)
Sequence B
(n=242)
Family history, n (%)
Coronary death 22 (9.8) 30 (13.5) 26 (10.5) 27 (11.2)
Stroke 37 (16.4) 42 (18.9) 47 (19.0) 56 (23.1)
Intermittent claudication 6 (2.7) 14 (6.3) 13 (5.2) 20 (8.3)
Waist circumference (cm), mean (SD) 98.9 (7.0) 99.1 (6.8) 101.1 (9.2) 100.4 (8.1)
LDL cholesterol (mg/dL), mean (SD) 136 (38) 137 (39) 133 (33) 130 (31)
Triglycerides (mg/dL), mean (SD) 91 (66–119) 89 (66–123) 69 (54–98) 74 (56–101)
Non-HDL cholesterol (mg/dL), mean (SD) 160 (37) 159 (39) 149 (37) 147 (34)
Total/HDL cholesterol, mean (SD) 4.3 (1.0) 4.3 (1.2) 3.6 (1.0) 3.6 (0.9)
LDL/HDL cholesterol, mean (SD) 2.7 (0.9) 2.8 (1.0) 2.3 (0.8) 2.3 (0.7)
Triglycerides/HDL cholesterol, mean (SD) 2.3 (1.6) 2.3 (1.9) 1.5 (1.1) 1.5 (1.0)
Glycemia (mg/dL), mean (SD) 93 (87–100) 94 (89–101) 89 (83–96) 89 (83–96)
History of diabetes, n (%) 15 (6.7) 22 (10.0) 7 (3.1) 12 (5.5)
History of hypertension, n (%) 60 (27.0) 68 (31.2) 36 (14.8) 42 (17.4)
Abbreviations: HDL, high-density lipoprotein; LDL, low-density lipoprotein.
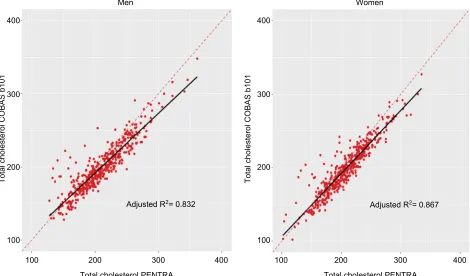
Figure S1 Linear regression analysis for total cholesterol (mg/dL) by sex. Men
400
300
200
100
400
300
200
100
Adjusted R2= 0.832 Adjusted R2= 0.867
Total cholesterol PENTRA
Total cholesterol COBAS b101 Total cholesterol COBAS b101
100 200 300 400
Total cholesterol PENTRA
100 200 300 400
Women
Clinical Epidemiology downloaded from https://www.dovepress.com/ by 118.70.13.36 on 20-Aug-2020
Dovepress Barroso et al
Figure S2 Bland–Altman plot for total cholesterol (mg/dL).
100 200 300 400
80
40
0
–40
–80
100 200 300
Mean of measurements Mean of measurements
Di
fference PENTRA-COBA
S
80
40
0
–40
–80
Di
fference PENTRA-COBA
S
400
Men Women
Figure S3 Linear regression analysis for HDL cholesterol (mg/dL) by sex.
Abbreviation: HDL, high-density lipoprotein.
Men
125
100
75
50
25
125
100
75
50
25
25 50 75
HDL cholesterol PENTRA HDL cholesterol PENTRA
HDL cholesterol b101
HDL cholesterol COBAS b101
Adjusted R2=0.869 Adjusted R2=0.88
100 125 25 50 75 100 125
Women
Clinical Epidemiology downloaded from https://www.dovepress.com/ by 118.70.13.36 on 20-Aug-2020
Dovepress Self-screening of cardiovascular risk
Figure S4 Bland–Altman plot for HDL cholesterol (mg/dL).
Abbreviation: HDL, high-density lipoprotein.
Men
10
0
–10
–20
–30
10
0
–10
–20
–30
25 50 75
Mean of measurement
100 125 25 50 75
Mean of measurement
Difference PENTRA-COBAS Difference PENTRA-COBAS
100 125
Women
Figure S5 Linear regression analysis for glycated hemoglobin (%) by sex.
Men
10
8
6
4
4 6 8
Glycated hemoglobin PENTRA
Adjusted R2=0.831 Adjusted R2=0.515
Glycated hemoglobin PENTRA
Glycated hemoglobin COBAS b10
1
Glycated hemoglobin COBAS b10
1
10
10
8
6
4
4 6 8 10
Women
Clinical Epidemiology downloaded from https://www.dovepress.com/ by 118.70.13.36 on 20-Aug-2020
Dovepress
Clinical Epidemiology
Publish your work in this journal
Submit your manuscript here: https://www.dovepress.com/clinical-epidemiology-journal
Clinical Epidemiology is an international, peer-reviewed, open access, online journal focusing on disease and drug epidemiology, identifica-tion of risk factors and screening procedures to develop optimal pre-ventative initiatives and programs. Specific topics include: diagnosis, prognosis, treatment, screening, prevention, risk factor modification,
systematic reviews, risk and safety of medical interventions, epidemiol-ogy and biostatistical methods, and evaluation of guidelines, translational medicine, health policies and economic evaluations. The manuscript management system is completely online and includes a very quick and fair peer-review system, which is all easy to use.
Dove
press
Barroso et al
Figure S6 Bland–Altman plot for glycated hemoglobin (%).
Men 2
1
0
–1
4 6 8
Mean of measurement Mean of measurement
Difference PENTRA-COBASS
2
1
0
–1
Difference PENTRA-COBASS
10 4 6 8 10
Women
Clinical Epidemiology downloaded from https://www.dovepress.com/ by 118.70.13.36 on 20-Aug-2020